Accounting Flowchart Symbols
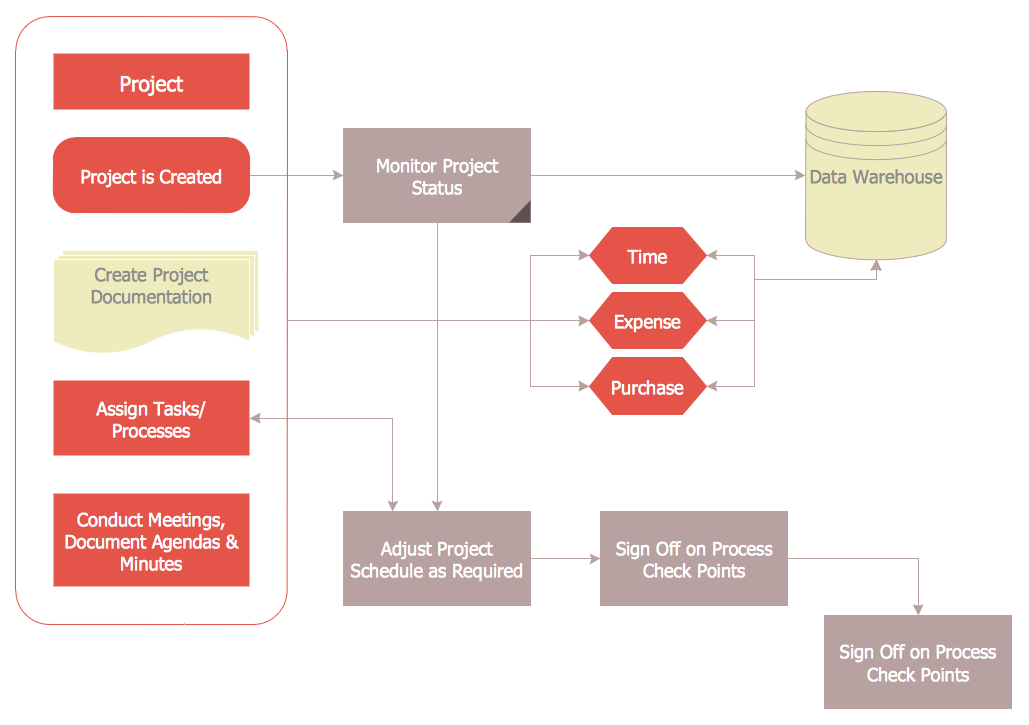
Accounting is a well known and popular tool used for gaining full quantitative information about the finances. The accounting process includes extensive set of activities that begins with transactions and ends with closing of books. It contains all financial information for a given organization, the data about incomes, expenditures, purchases, sales, return, payroll, and many other numerical information. The excellent possibility to create great-looking Accounting Flowcharts is offered by professional ConceptDraw DIAGRAM diagramming and vector drawing software. It includes the Accounting Flowcharts solution containing wide variety of predesigned accounting flowchart symbols. All symbols are easy recognizable, commonly used, vector and professionally designed, so are capable effectively save your time and efforts when representing all stages of accounting work process, the flow of data in an organization, accounting procedures and processes, documents, tasks, responsible people, users, components and authorizations.Linux Audit Flowchart Example. Flowchart Examples
Create your own Linux audit flowcharts using the ConceptDraw DIAGRAM diagramming and vector drawing software extended with the Audit Flowcharts solution from the Finance and Accounting area of ConceptDraw Solution Park. This flowchart example describing auditd, the linux audit tool.Flowchart Maker
A flowchart maker is a software showing the interaction, sequence or organization. It also known as flowchart maker or ConceptDraw DIAGRAM standard supplied with different types of symbol collections: standard symbols, branded set and authored. It used strictly for enhancing scientific or business documents with abstract explanatory pictures. Business graphic applications show a special knowledge representations and include many features for creating schematic pictures. These graphic tools are known as flowchart maker or flowchart maker software.Technical Drawing Software
Technical drawing or draft is a form of specialized graphic communication, exchange of ideas in industry and engineering. It is a visual representation of object with indication of dimensions and used material, constructed with maintaining the proportions between its parts. Technical drawings are constructed by architects, technologists, engineers, designers, drafters, and other technical professionals according to defined rules, specifications, internationally accepted standards and standardized notations allowing to make unambiguous, clear and understandable technical drawings. ConceptDraw DIAGRAM extended with Electrical Engineering solution, Mechanical Engineering solution, Chemical and Process Engineering solution from Industrial Engineering Area of ConceptDraw Solution Park is ideal technical drawing software. Its powerful drawing tools, predesigned vector objects, templates, samples are helpful for creation all kinds of Technical Drawings and Technical Diagrams, Electrical and Mechanical Schematics, Circuit and Wiring Diagrams, Structural Drawings, and many other.Audit Steps
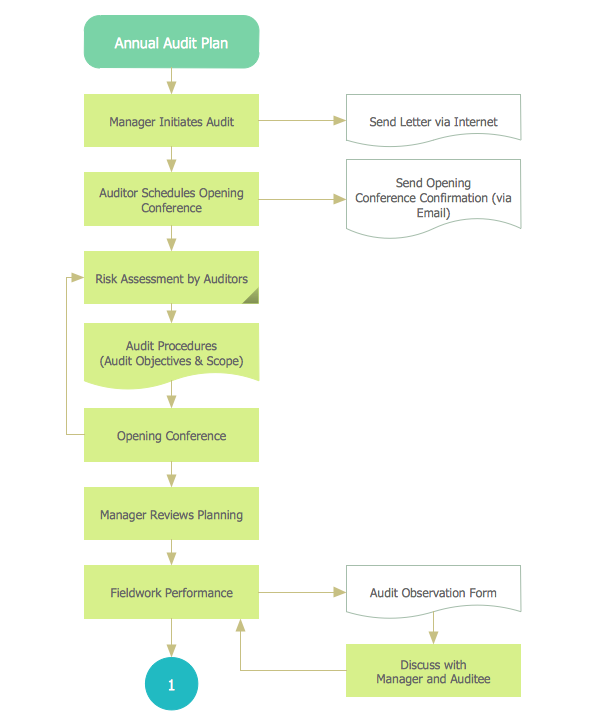
Audit Steps - The auditing process is an independent examination of data, statements, operations, records, financial or otherwise performances of an enterprise for any stated purpose. It is a complex process that includes 10 audit steps: Notification, Planning, Opening Meeting, Fieldwork, Communication, Draft Audit, Management Response, Final Meeting, Report Distribution, Feedback.
 Computer Network Diagrams
Computer Network Diagrams solution extends ConceptDraw DIAGRAM software with samples, templates and libraries of vector icons and objects of computer network devices and network components to help you create professional-looking Computer Network Diagrams, to plan simple home networks and complex computer network configurations for large buildings, to represent their schemes in a comprehensible graphical view, to document computer networks configurations, to depict the interactions between network's components, the used protocols and topologies, to represent physical and logical network structures, to compare visually different topologies and to depict their combinations, to represent in details the network structure with help of schemes, to study and analyze the network configurations, to communicate effectively to engineers, stakeholders and end-users, to track network working and troubleshoot, if necessary.
Steps of Accounting Cycle
The steps of accounting cycle include the processes of identifying, collecting, analyzing documents, recording transactions, classifying, summarizing, posting, and preparing trial balance, making journal entries, closing the books and final reporting financial information of an organization. Use the ConceptDraw DIAGRAM with Accounting Flowcharts Solution to create your own professional Accounting Flowcharts of any complexity quick and easy.Chart Audit
ConceptDraw DIAGRAM enhanced with Audit Flowcharts solution from the Finance and Accounting area of ConceptDraw Solution Park is a powerful diagramming and vector drawing software for designing professional looking Chart Audit of any complexity. Chart Audit is incredibly convenient for representing important information about audit process and audit planning process. It also helps auditors to define the problem areas and to elaborate the ways of their solving and effectiveness improvement.Chart Audits. Chart Auditor
Chart Audits, Chart Auditor - Designing the chart auditor can use the audit flowchart symbols from the Audit Flowcharts library for Audit Flowcharts Solution. Moreover it is convenient to use anyone of samples or templates offered by Audit Flowcharts Solution and design its own chart audits and audit flowcharts on the base of them.Process Flowchart
The main reason of using Process Flowchart or PFD is to show relations between major parts of the system. Process Flowcharts are used in process engineering and chemical industry where there is a requirement of depicting relationships between major components only and not include minor parts. Process Flowcharts for single unit or multiple units differ in their structure and implementation. ConceptDraw DIAGRAM is Professional business process mapping software for making Process flowcharts, Process flow diagram, Workflow diagram, flowcharts and technical illustrations for business documents and also comprehensive visio for mac application. Easier define and document basic work and data flows, financial, production and quality management processes to increase efficiency of your business with ConcepDraw DIAGRAM. Business process mapping software with Flowchart Maker ConceptDraw DIAGRAM includes extensive drawing tools, rich examples and templates, process flowchart symbols and shape libraries, smart connectors that allow you create the flowcharts of complex processes, process flow diagrams, procedures and information exchange. Process Flowchart Solution is project management workflow tools which is part ConceptDraw Project marketing project management software. Drawing charts, diagrams, and network layouts has long been the monopoly of Microsoft Visio, making Mac users to struggle when needing such visio alternative like visio for mac, it requires only to view features, make a minor edit to, or print a diagram or chart. Thankfully to MS Visio alternative like ConceptDraw DIAGRAM software, this is cross-platform charting and business process management tool, now visio alternative for making sort of visio diagram is not a problem anymore however many people still name it business process visio tools.
Steps in the Accounting Process
Steps in the Accounting Process - The Accounting Process is a sequence of organization activities that is used for gaining quantitative information about the finances. This complex process consists of a set of sequential steps. 9 steps in the accounting process: Analysis of Business Transactions, Make Journal Entries, Post to Ledger Accounts, Prepare Trial Balance, Make Adjusting Entries, Adjusted Trial Balance, Prepare Financial Statements, Close Accounts, Post-Closing Trial Balance.Business Diagram Software
When managing the projects, people, or networks, there are daily designed and used different types of Business diagrams, so the powerful drawing software will be very useful for this. ConceptDraw DIAGRAM with large quantity of business solutions will meet your needs and will help you convey your ideas successful and rapidly, no matter are you professional or beginner. It is the best choice for business specialists and technical professionals who need quickly and easily explore, visualize, and communicate information. ConceptDraw DIAGRAM business diagram software is the most powerful business software and relational charting software. Create advanced, completely customizable Business Process Diagrams, Business Flow Charts, Work Flow Diagrams, Organizational Charts, Audit diagrams, Marketing diagrams, Value Stream Maps, TQM diagrams, ERD diagrams, EPC diagrams, Cause and Effect diagrams, Infographics, Dashboards, and other Relational business diagrams from your data using the powerful drawing tools of ConceptDraw Solution Park.
 Telecommunication Network Diagrams
Telecommunication Network Diagrams solution extends ConceptDraw DIAGRAM software with samples, templates, and great collection of vector stencils to help the specialists in a field of networks and telecommunications, as well as other users to create Computer systems networking and Telecommunication network diagrams for various fields, to organize the work of call centers, to design the GPRS networks and GPS navigational systems, mobile, satellite and hybrid communication networks, to construct the mobile TV networks and wireless broadband networks.
Flow Diagram Software
The diagram is a convenient way of representing complex information and data in a simple, visual and comprehensive form. There are used many types of diagrams, each of them has its own fields of application. Flow diagram is a diagram that illustrates the flow or set of dynamic relationships in a system, visually depicts the structure of the elements in a complex system and their interactions. The term Flow diagram is also synonym for a Flowchart. Flow Diagrams are the perfect way to visually represent the structural data. ConceptDraw DIAGRAM extended with Flowcharts solution from the Diagrams area is a professional flow diagram software. The basic set of vector stencils libraries offered by Flowcharts solution, variety of samples and templates developed by specialists, and also advanced RapidDraw technology open before ConceptDraw users wide opportunities in representing the flow processes, in drawing Flow Diagrams and Flowcharts of any type and complexity. Easy tools of exporting to different graphical formats give the possibility of further successful use the diagrams.
 Data Flow Diagrams (DFD)
Data Flow Diagrams solution extends ConceptDraw DIAGRAM software with templates, samples and libraries of vector stencils for drawing the data flow diagrams (DFD).
Half Pipe Plans
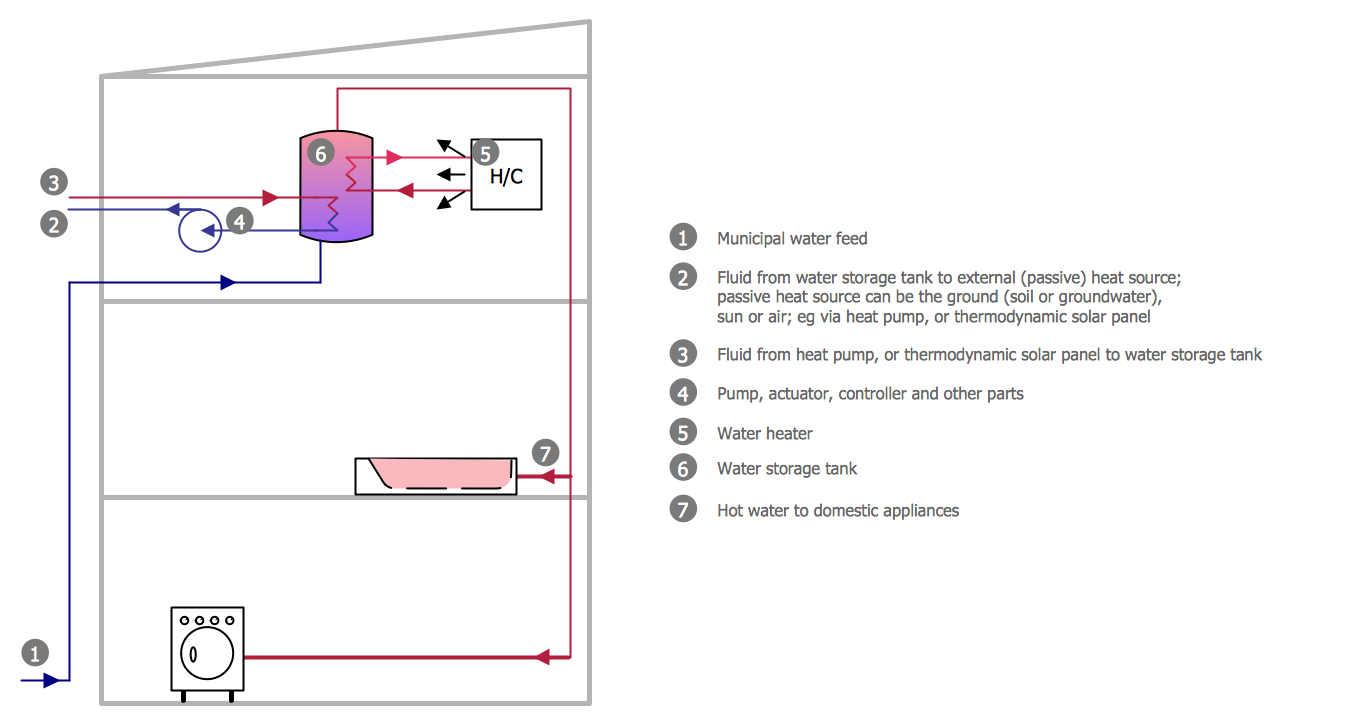
Drawing of Half Pipe Plans is quite complex process. But now it's very to design the Half Pipe Plans of any complexity with ConceptDraw DIAGRAM diagramming and vector drawing software extended with Plumbing and Piping Plans Solution.Social Media Flowchart Symbols
Social media is a popular view of mass communication which allows people, companies and organizations create, share, discover, modify, access, comment, discuss and exchange information through the Internet. Social Media Response solution for ConceptDraw DIAGRAM provides collection of 10 libraries with diversity of predesigned vector social media flowchart symbols for fast and easy creating interactive Social Media Flowcharts, Response Charts and Action Mind Maps.
 Universal Diagramming Area
This area collects solutions for drawing diagrams, charts, graphs, matrices, geographic and road maps for education, science, engineering, business.
Create Flow Chart on Mac
A Flowchart is a commonly used type of chart that describes an algorithm, process or workflow. It applies the boxes of various kinds to represent the steps and connects them with arrows showing their order. The Flowcharts help to understand the processes, visualize the process steps, and effectively find the flaws and bottlenecks. They are widely used in various fields for analyzing, documenting, designing, and managing simple and complex processes and programs, for representing process operations and problems' solution models. There are many types of Flowcharts, such as Cross-Functional Flowcharts, Data Flow Diagrams, Swimlane Flowcharts, Workflow Diagrams, Business Process Diagrams, Process Flowcharts, etc. ConceptDraw DIAGRAM is a powerful diagram software used to create Flow chart on Mac and Windows without efforts. The Flowcharts solution from Diagrams area of ConceptDraw Solution Park and ConceptDraw Rapid Draw functionality are greatly effective tools for designing various types of Flowcharts for business processes.Basic Audit Flowchart. Flowchart Examples
This sample shows the Audit Process Flowchart. It was created in ConceptDraw DIAGRAM diagramming and vector drawing software using the Flowcharts solution from the Diagrams area of ConceptDraw Solution Park. The Audit Flowcharts are widely used in the financial management, accounting, money management and in many others fields.- Technical Flow Chart
- Basic Flowchart Symbols and Meaning | Gantt chart examples | How ...
- Audit Flowchart Symbols | Accounting Flowchart Symbols | Basic ...
- Mechanical Engineering Drafting Drawing Symbols Chart
- Process Flow Diagram Symbols | How to Create a Mechanical ...
- Drafting Symbols Chart
- Audit Procedures | Audit Steps | Audit Flowchart Symbols | Audit ...
- Process Flowchart | Basic Flowchart Symbols and Meaning | Audit ...
- Process Flowchart | Functional Flow Block Diagram | Block Diagram ...
- Audit Process | Audit process flowchart (multipage) | Audit Steps ...
- Process Flowchart | Technical Drawing Software | Mechanical ...
- Define Communication Flow Diagram
- Process Flow Diagram Symbols | Mechanical Drawing Symbols ...
- Technical Drawing Software | Process Flow Diagram Symbols ...
- Mechanical Drawing Symbols | Mechanical Drawing Software ...
- Interior Design. Office Layout Plan Design Element | Network ...
- Auditing Process. Audit Planning Process | Audit planning flowchart ...
- Audit Steps | Audit Process Flowchart . Audit Flowchart | Auditing ...
- Mechanical Drawing Software | Mechanical Drawing Symbols ...
- Financial Audit Process Flowchart


