A five level pyramid model of different types of Information Systems based on the information processing requirement of different levels in the organization. The first level represents transaction processing systems to process basic data. The second level represents office support systems to process information in office. The third level represents management information systems to process information by managers. The fourth level represents decision support systems to process explicit knowledge. The fifth level represents executive information systems to process tacit knowledge.
"A Computer(-Based) Information System is essentially an IS using computer technology to carry out some or all of its planned tasks. The basic components of computer based information system are:
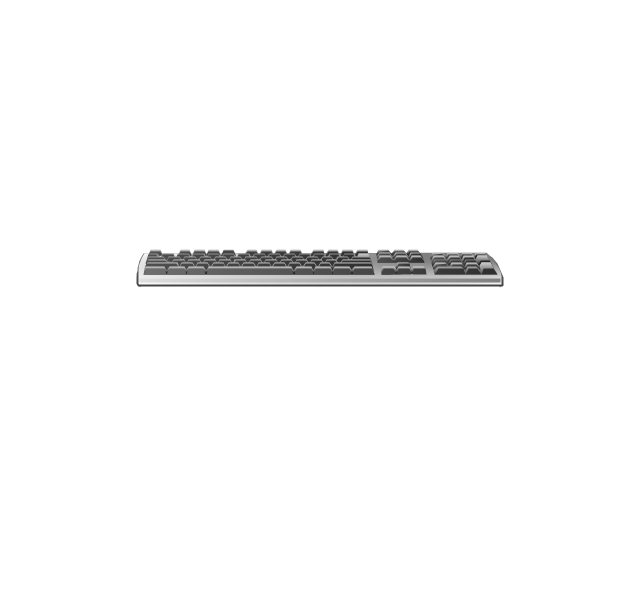
(1) Hardware - these are the devices like the monitor, processor, printer and keyboard, all of which work together to accept, process, show data and information.
(2) Software - are the programs that allow the hardware to process the data.
(3) Databases - are the gathering of associated files or tables containing related data.
(4) Networks - are a connecting system that allows diverse computers to distribute resources.
(5) Procedures - are the commands for combining the components above to process information and produce the preferred output.
The first four components (hardware, software, database and network) make up what is known as the information technology platform. Information technology workers could then use these components to create information systems that watch over safety measures, risk and the management of data. These actions are known as information technology services." [Information systems. Wikipedia]
This pyramid diagram was redesigned using the ConceptDraw PRO diagramming and vector drawing software from Wikimedia Commons file Five-Level-Pyramid-model.png. [commons.wikimedia.org/ wiki/ File:Five-Level-Pyramid-model.png]
This file is licensed under the Creative Commons Attribution 3.0 Unported license. [creativecommons.org/ licenses/ by/ 3.0/ deed.en]
The triangle chart example "Information systems types" is included in the Pyramid Diagrams solution from the Marketing area of ConceptDraw Solution Park.
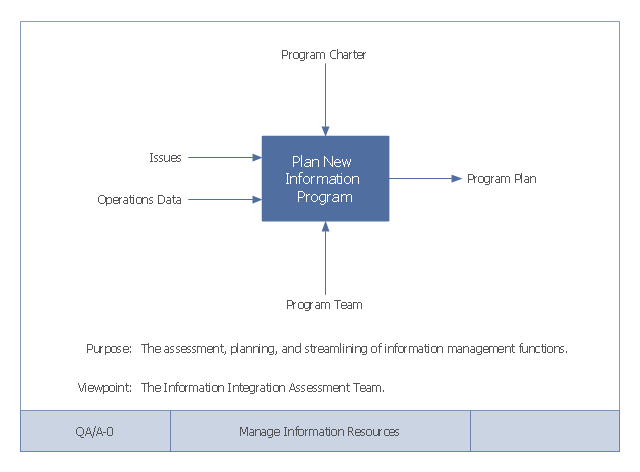
This example of a Top Level Context Diagram for an information system management process was redesigned from the Wikipedia file: IDEF Top-Level Context Diagram.jpg. [en.wikipedia.org/ wiki/ File:IDEF_ Top-Level_ Context_ Diagram.jpg]
"Graphical notation.
IDEF0 is a model that consists of a hierarchical series of diagrams, text, and glossary cross referenced to each other. The two primary modeling components are:
(1) functions (represented on a diagram by boxes), and
(2) data and objects that interrelate those functions (represented by arrows).
... the position at which the arrow attaches to a box conveys the specific role of the interface. The controls enter the top of the box. The inputs, the data or objects acted upon by the operation, enter the box from the left. The outputs of the operation leave the right-hand side of the box. Mechanism arrows that provide supporting means for performing the function join (point up to) the bottom of the box.
The IDEF0 process.
The IDEF0 process starts with the identification of the prime function to be decomposed. This function is identified on a “Top Level Context Diagram,” that defines the scope of the particular IDEF0 analysis. ... From this diagram lower-level diagrams are generated." [IDEF0. Wikipedia]
The IDEF0 diagram example "Top-level context diagram" was created using the ConceptDraw PRO diagramming and vector drawing software extended with the IDEF0 Diagrams solution from the Software Development area of ConceptDraw Solution Park.
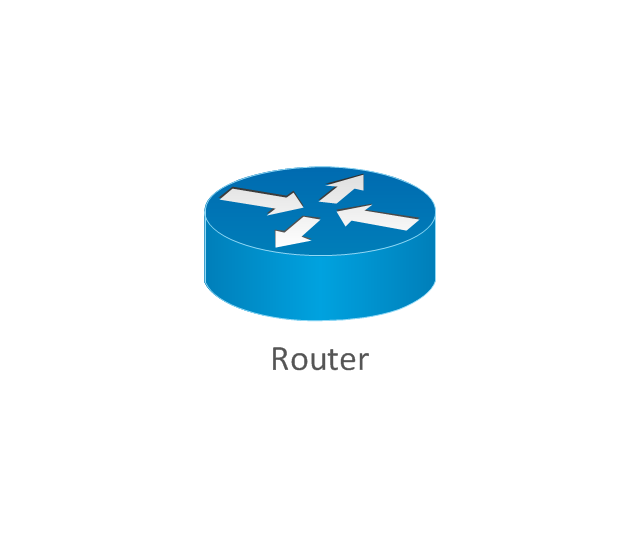
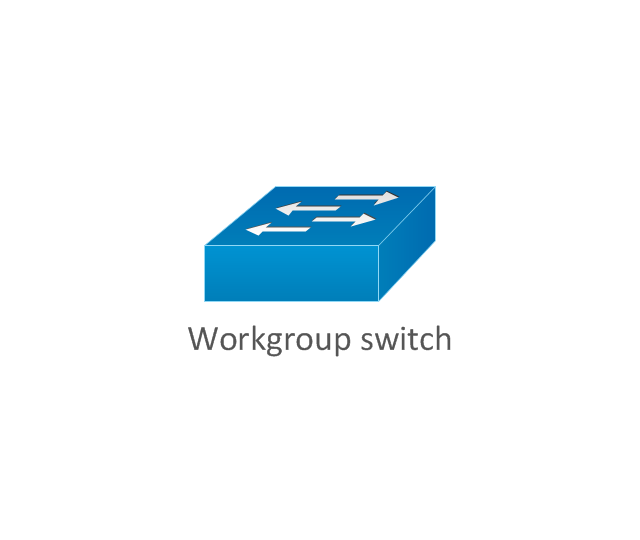
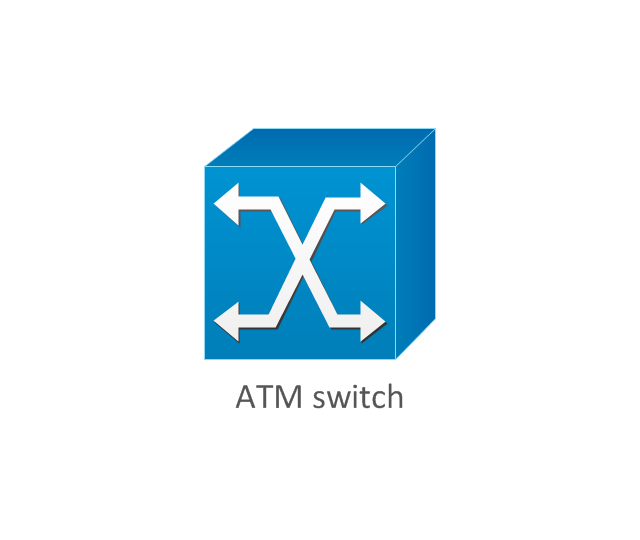
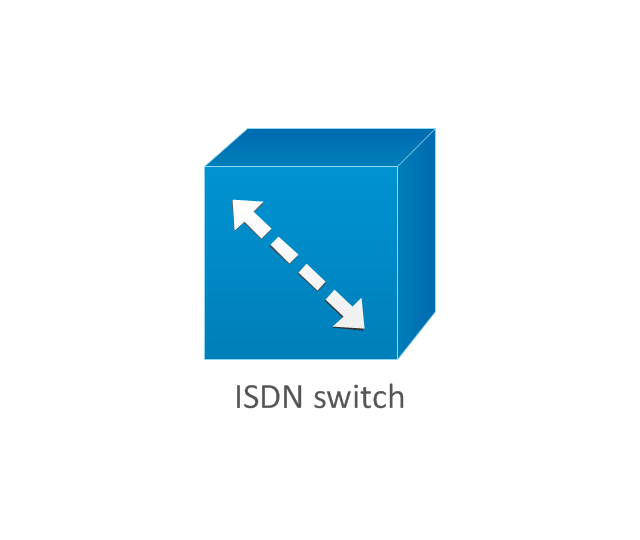
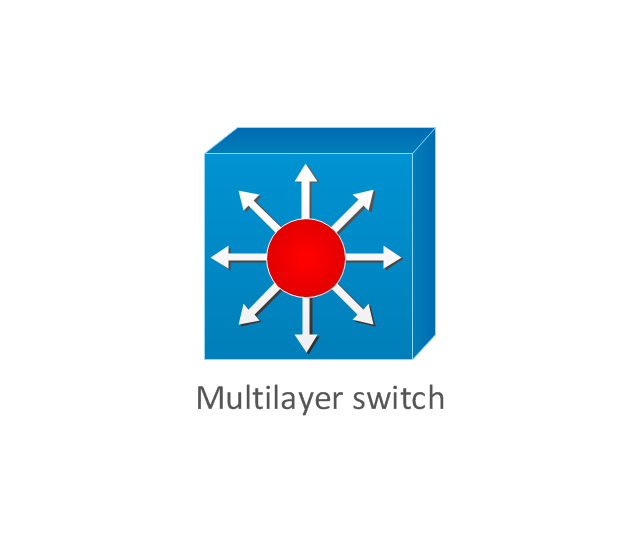
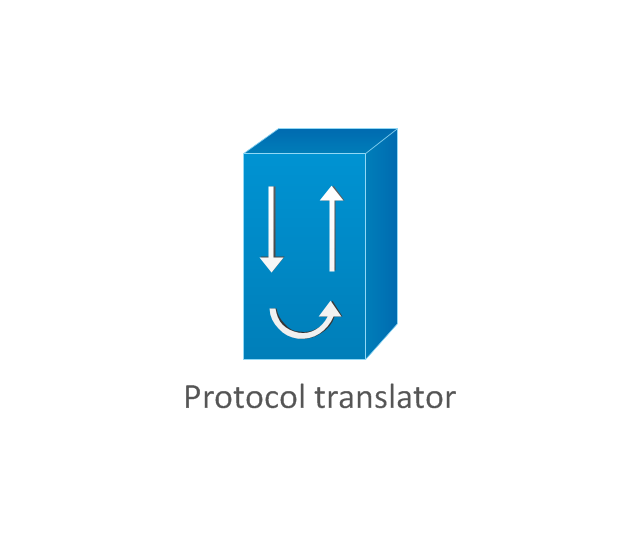
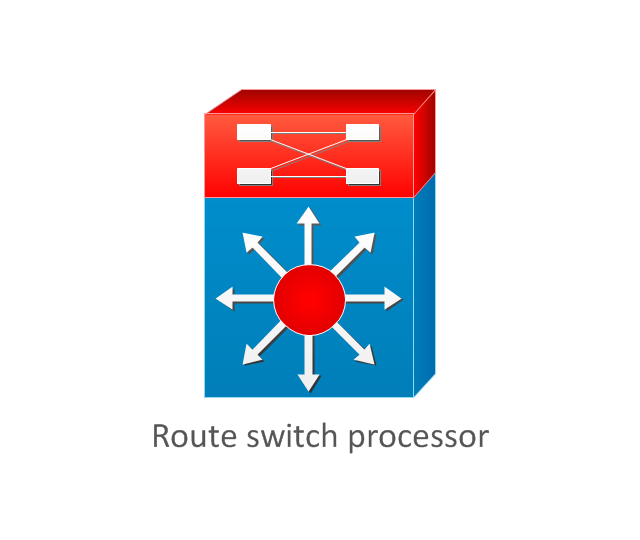
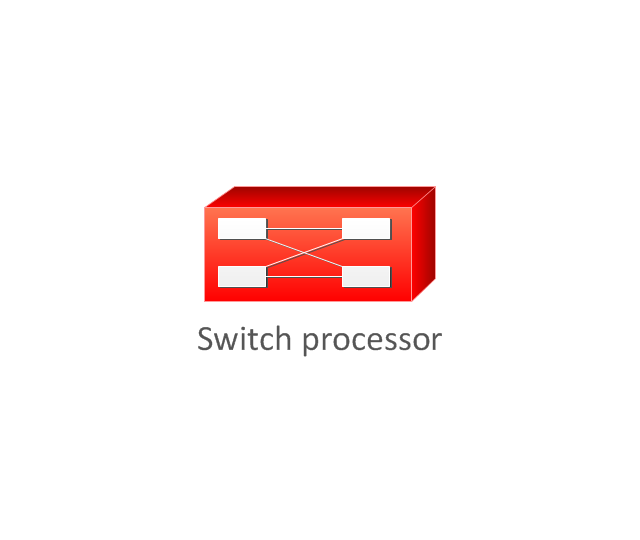
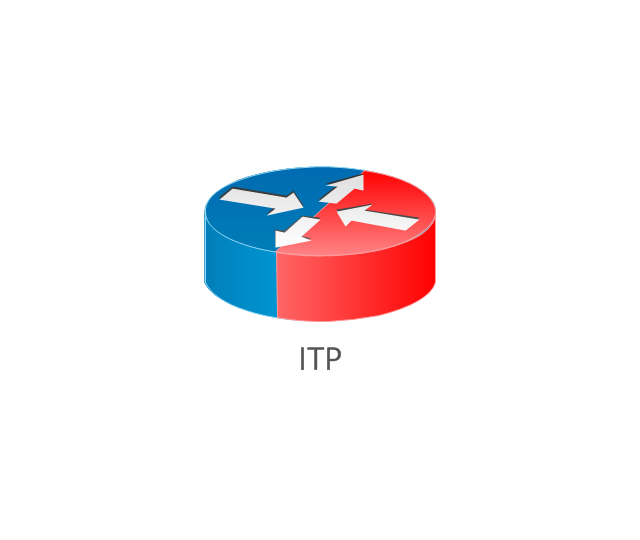
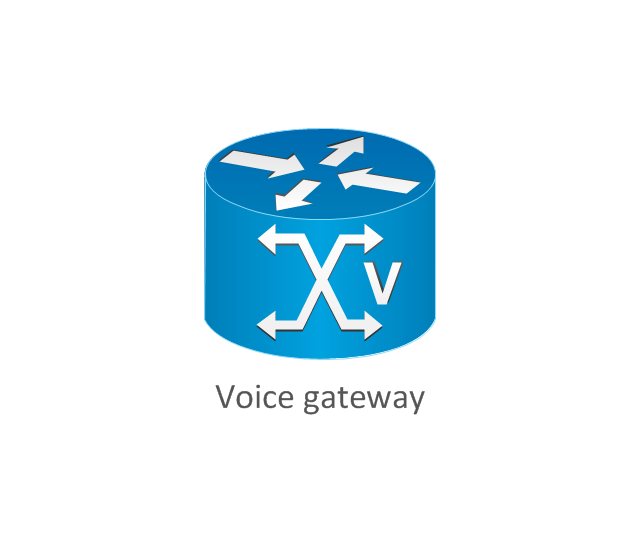
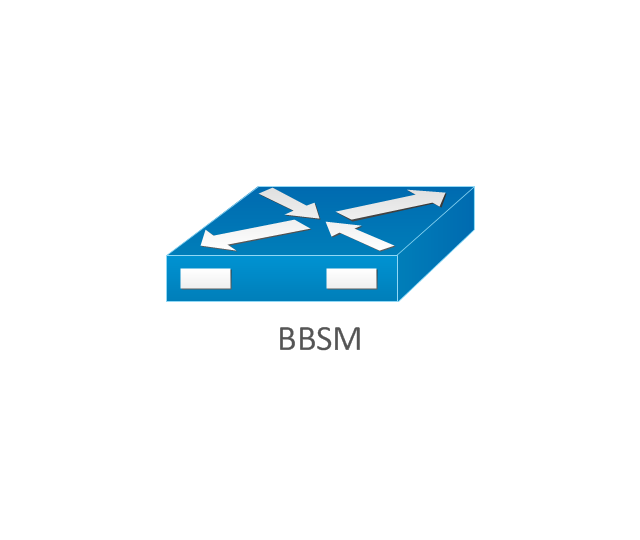
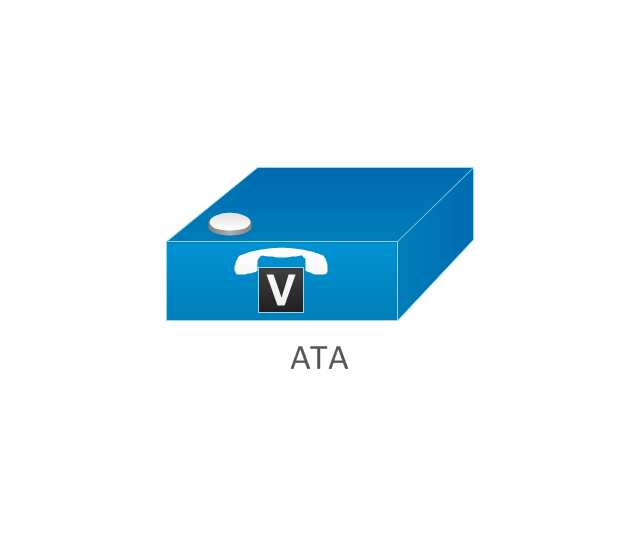
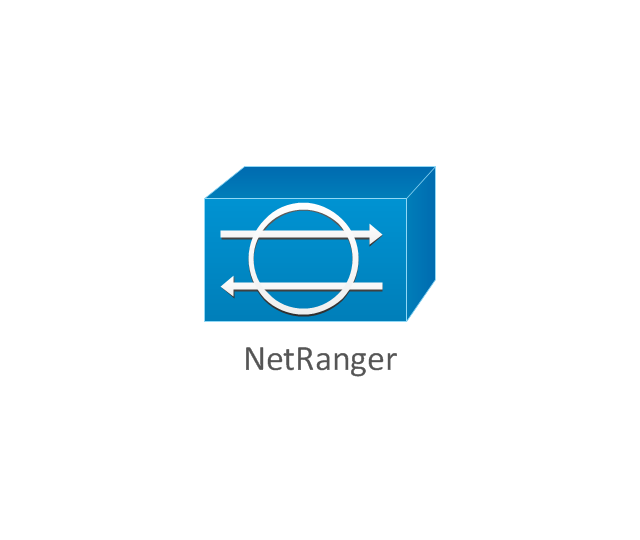
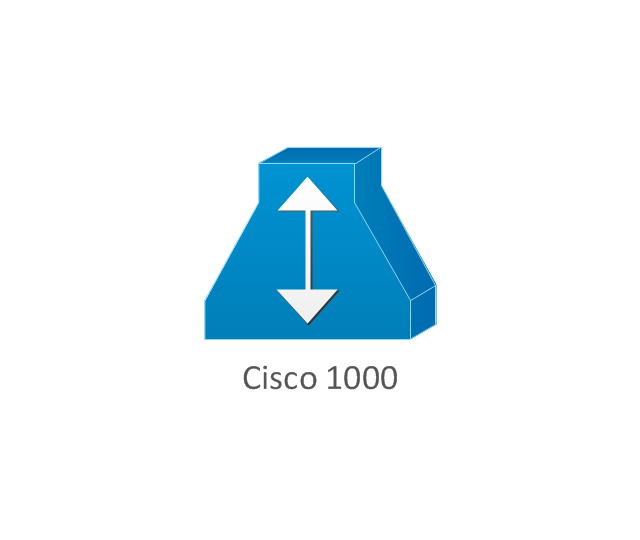
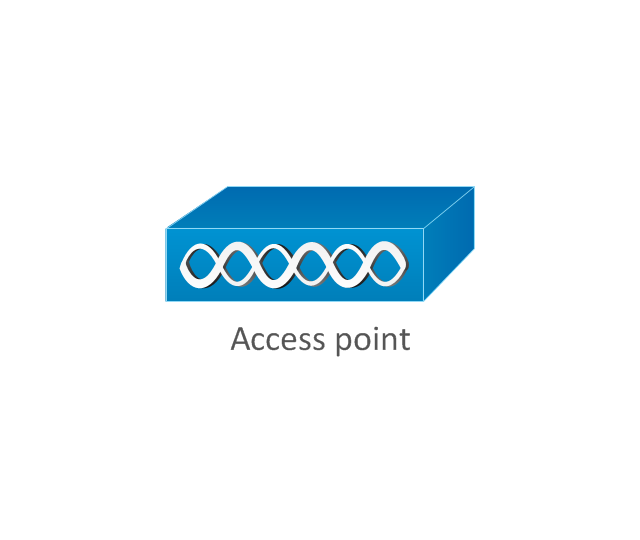
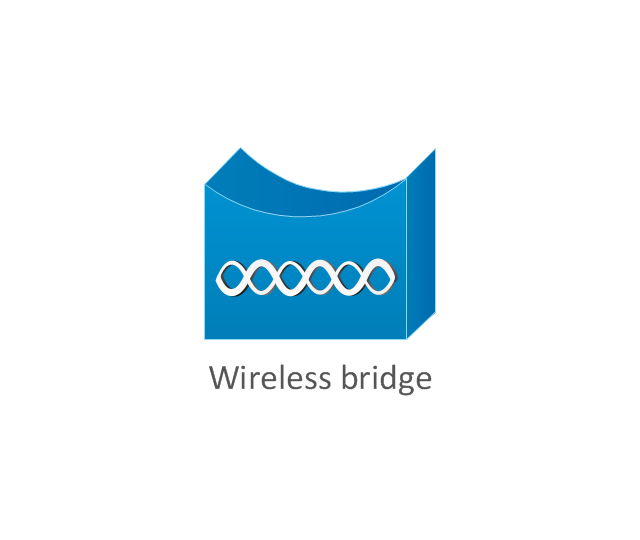
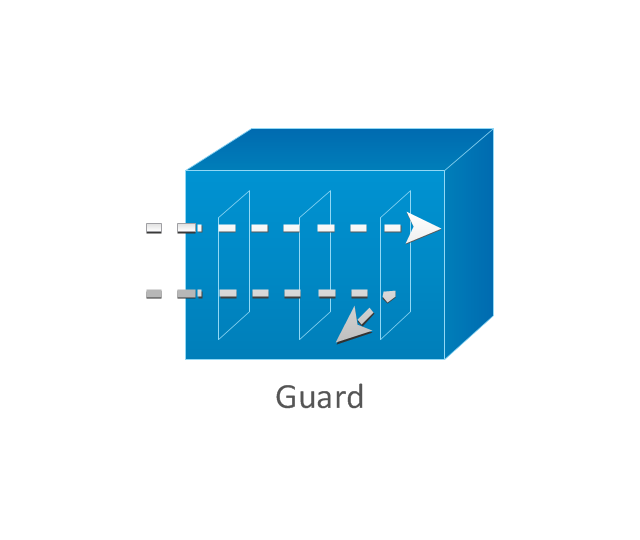
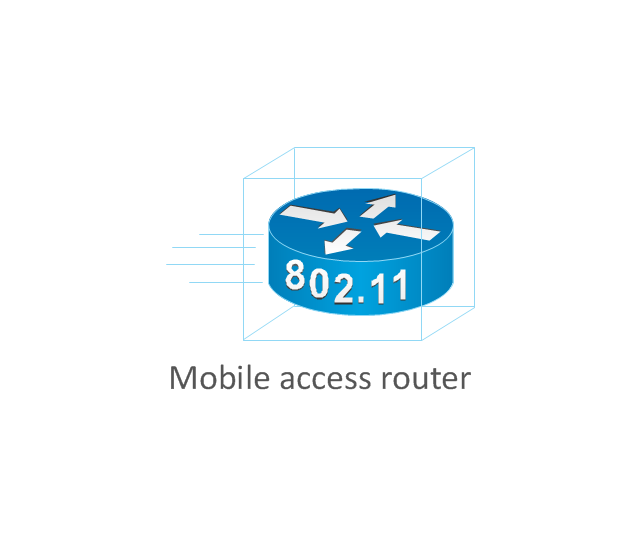
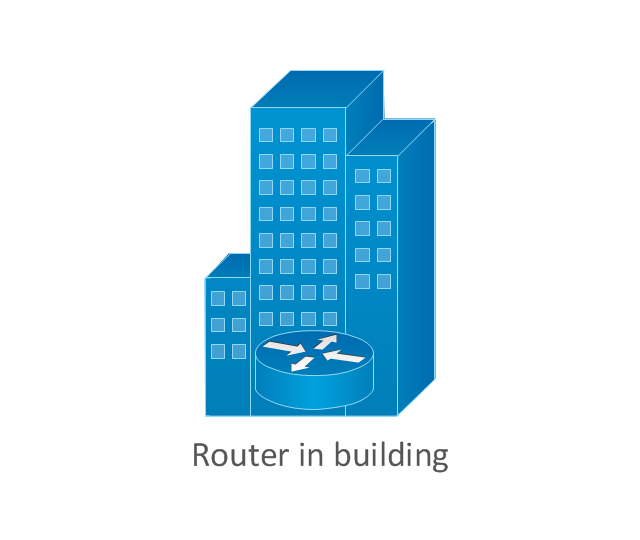
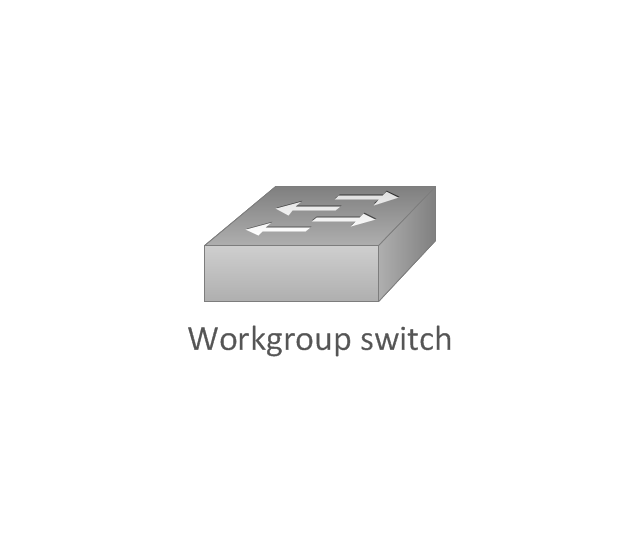
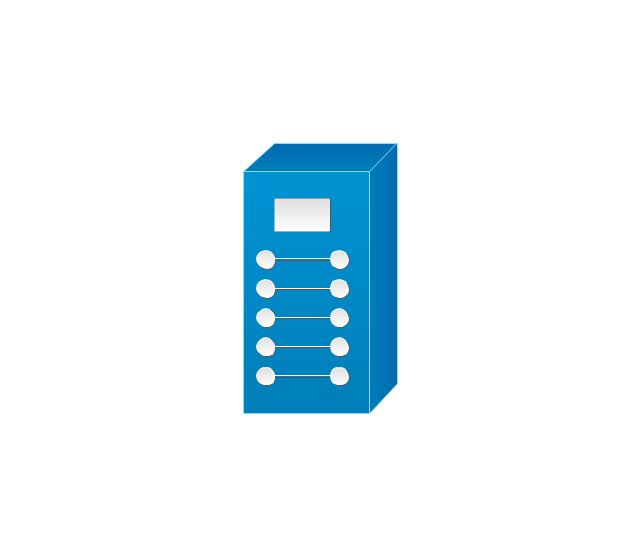
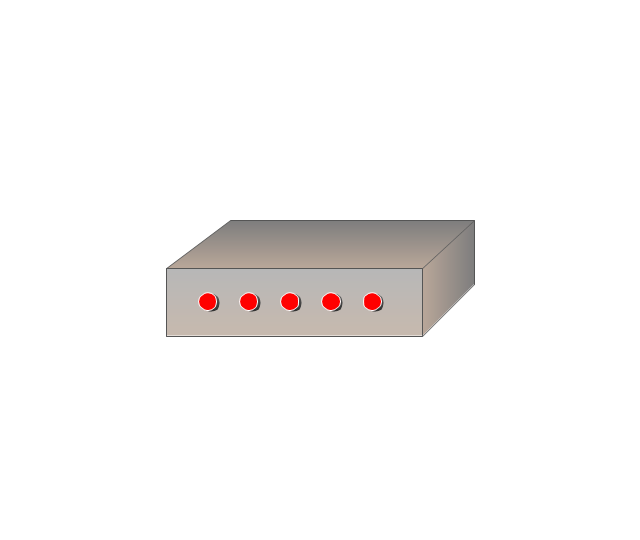
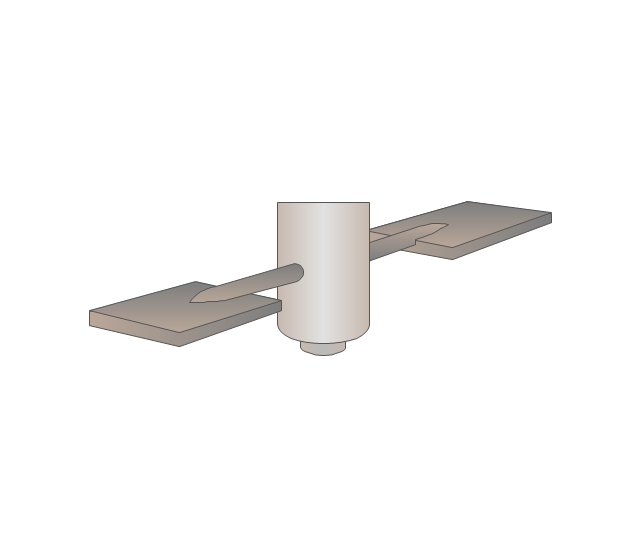
The vector stencils library "Cisco network topology" contains 89 symbols of Cisco network devices and design elements for drawing computer network topology diagrams.
"There are two basic categories of network topologies:
(1) Physical topologies,
(2) Logical topologies.
The shape of the cabling layout used to link devices is called the physical topology of the network. This refers to the layout of cabling, the locations of nodes, and the interconnections between the nodes and the cabling. The physical topology of a network is determined by the capabilities of the network access devices and media, the level of control or fault tolerance desired, and the cost associated with cabling or telecommunications circuits.
The logical topology in contrast, is the way that the signals act on the network media, or the way that the data passes through the network from one device to the next without regard to the physical interconnection of the devices." [Network topology. Wikipedia]
The symbols example "Cisco network topology - Vector stencils library" was created using the ConceptDraw PRO diagramming and vector drawing software extended with the Cisco Network Diagrams solution from the Computer and Networks area of ConceptDraw Solution Park.
www.conceptdraw.com/ solution-park/ computer-networks-cisco
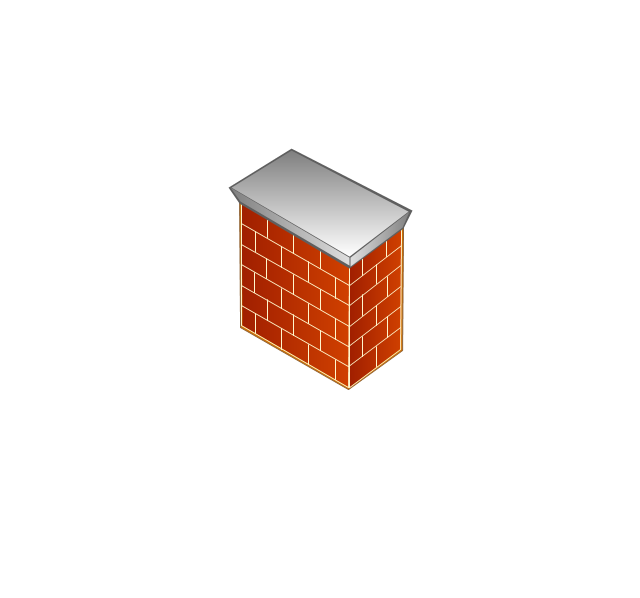
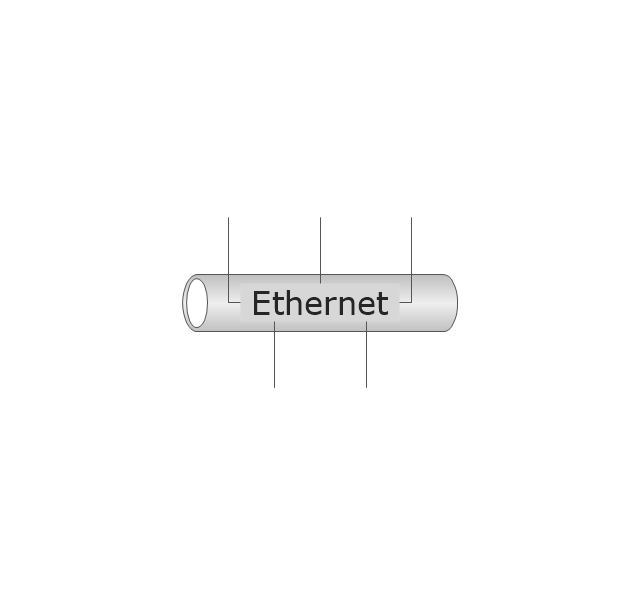
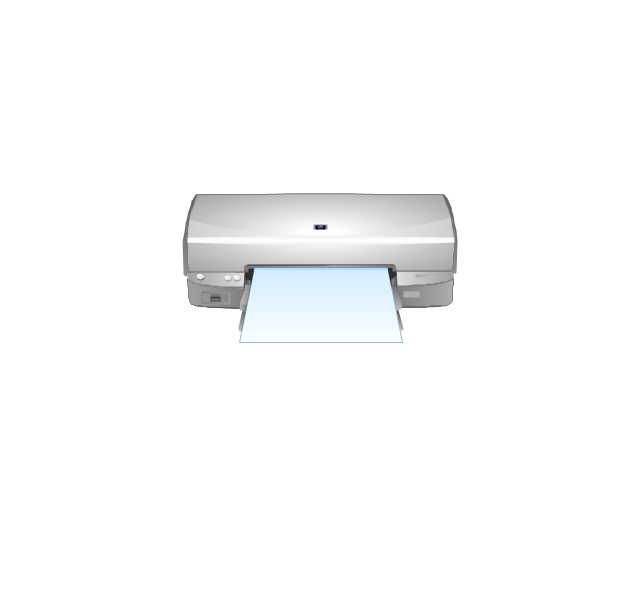
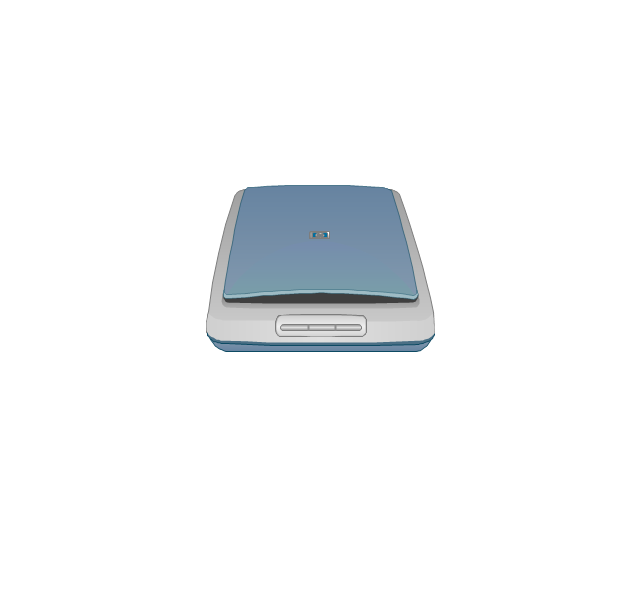
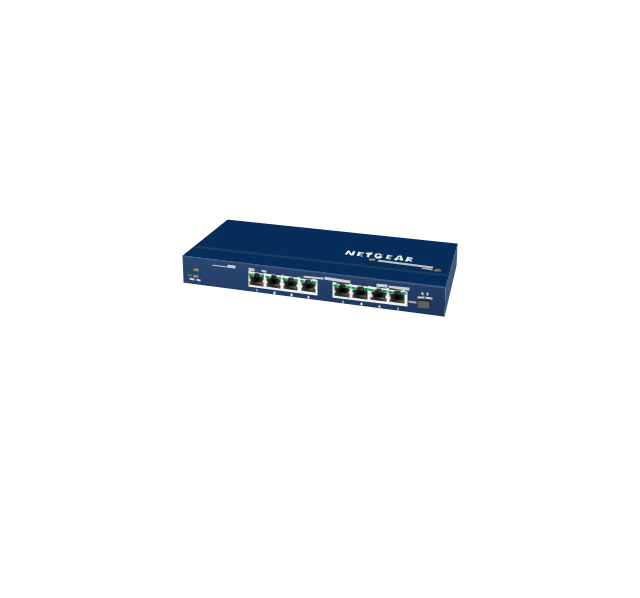
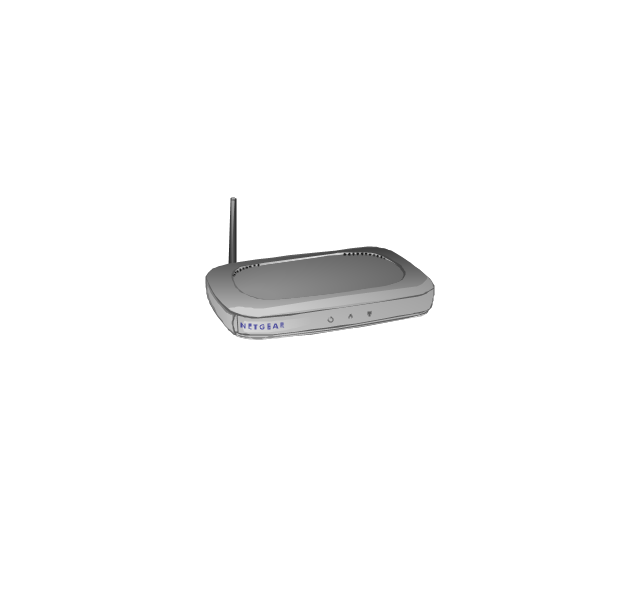
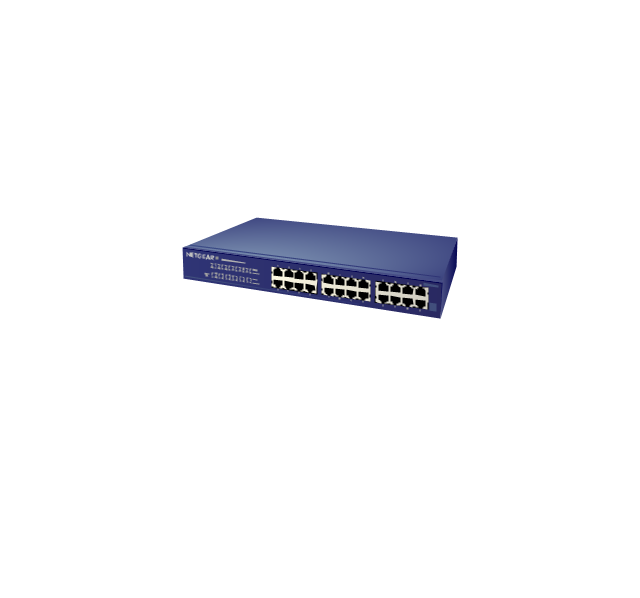
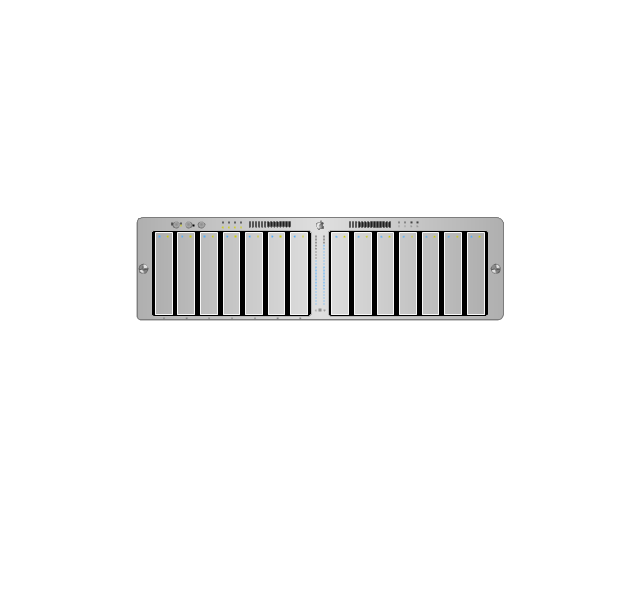
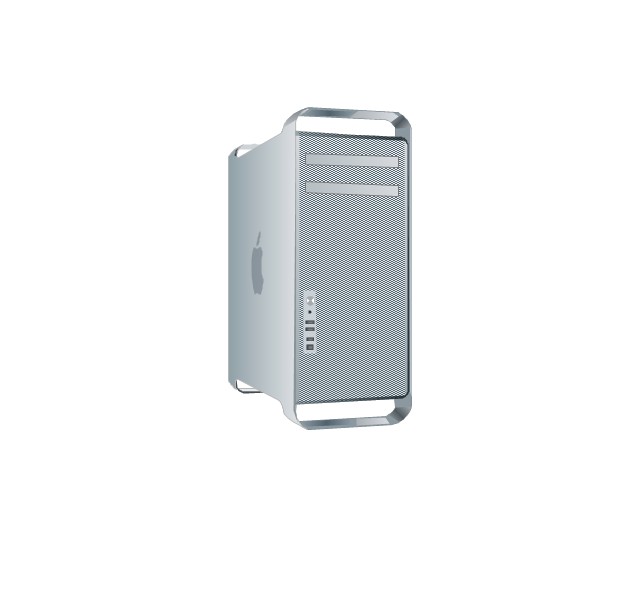
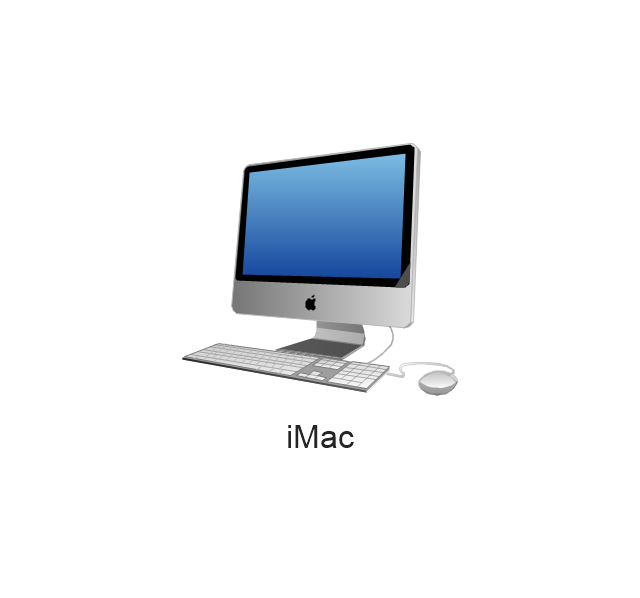
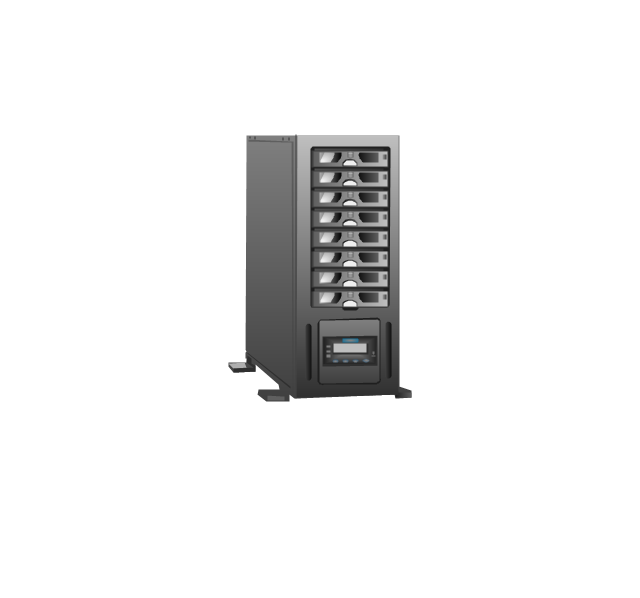
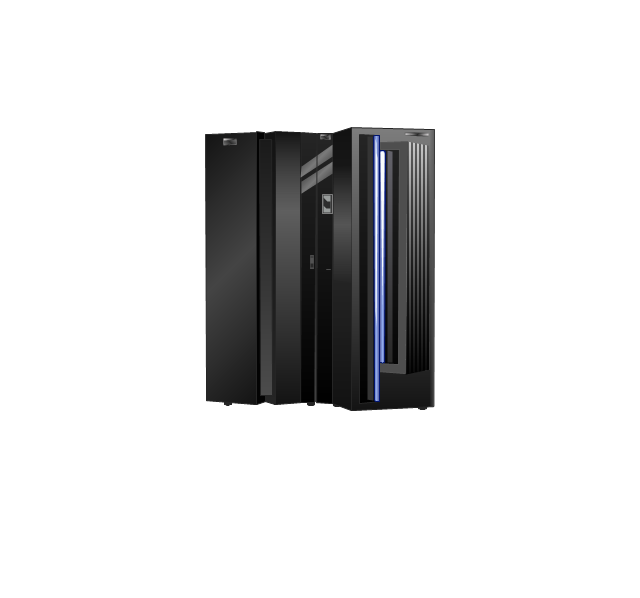
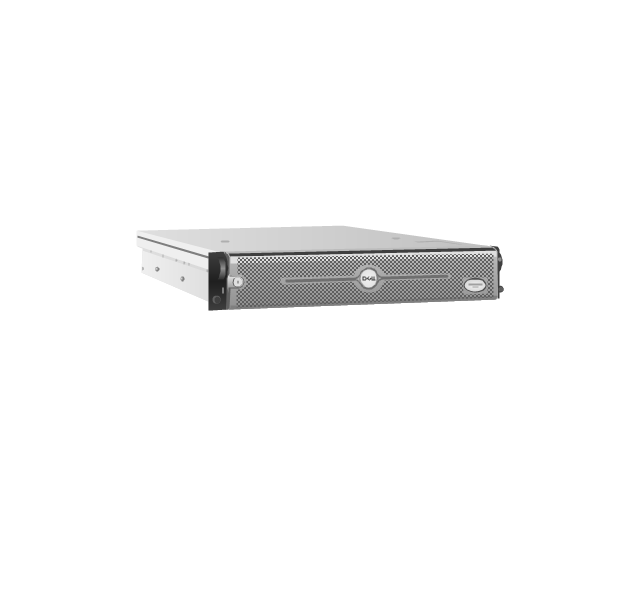
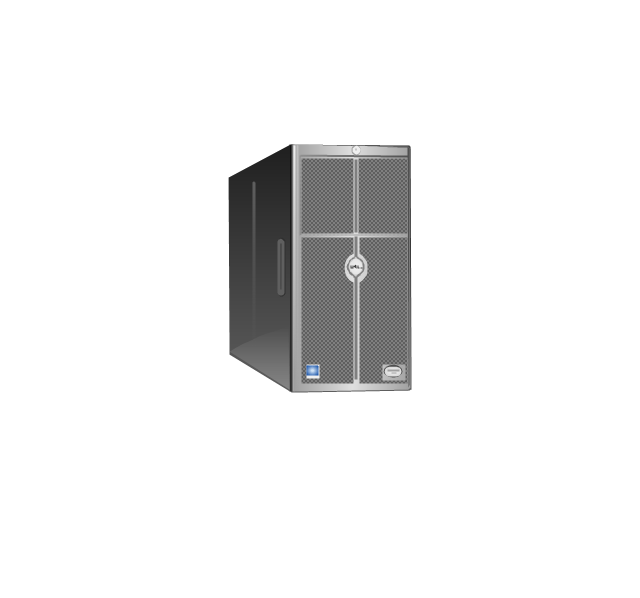
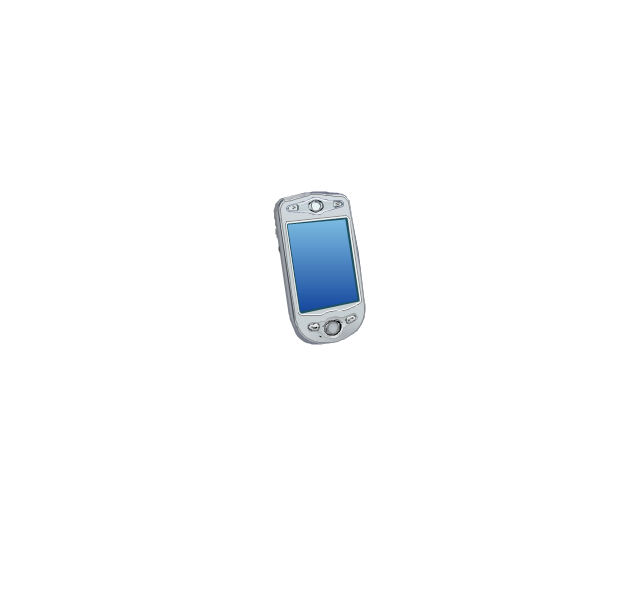
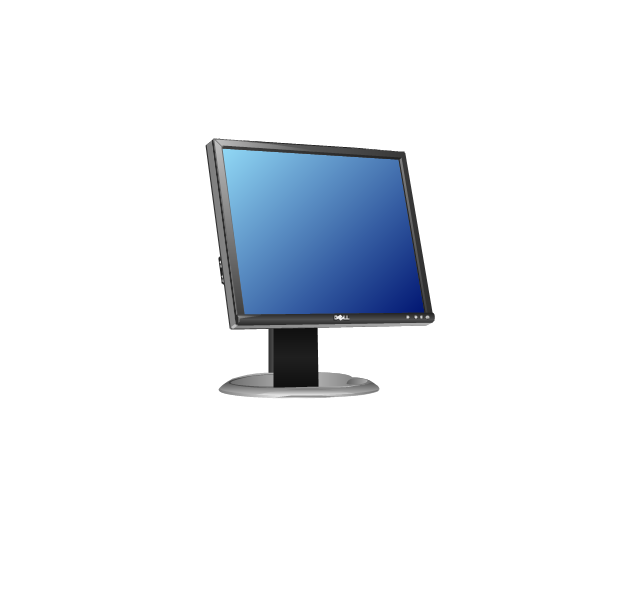
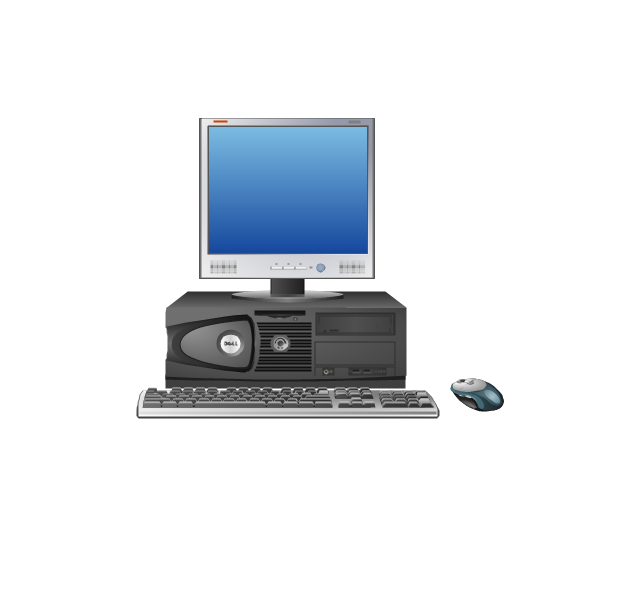
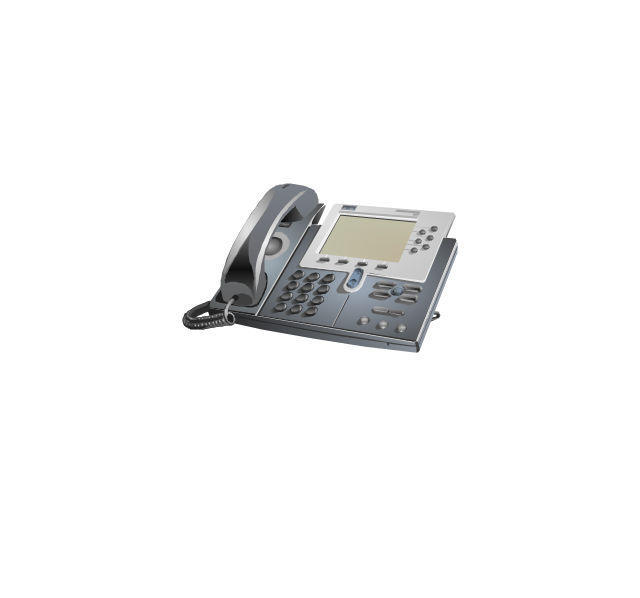
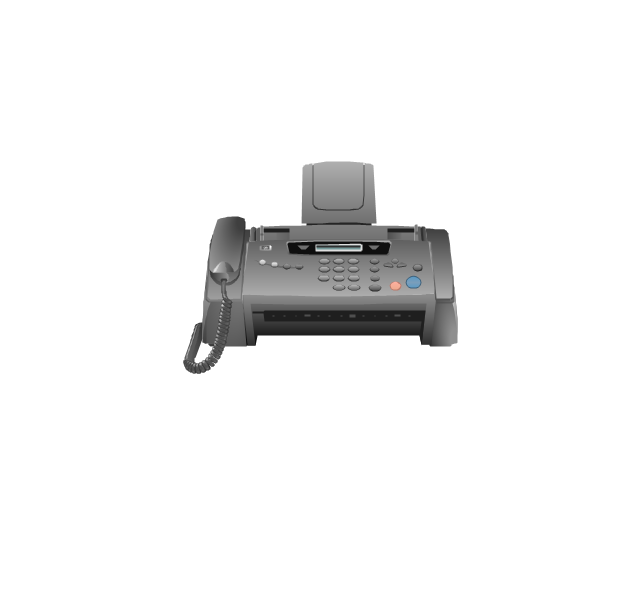
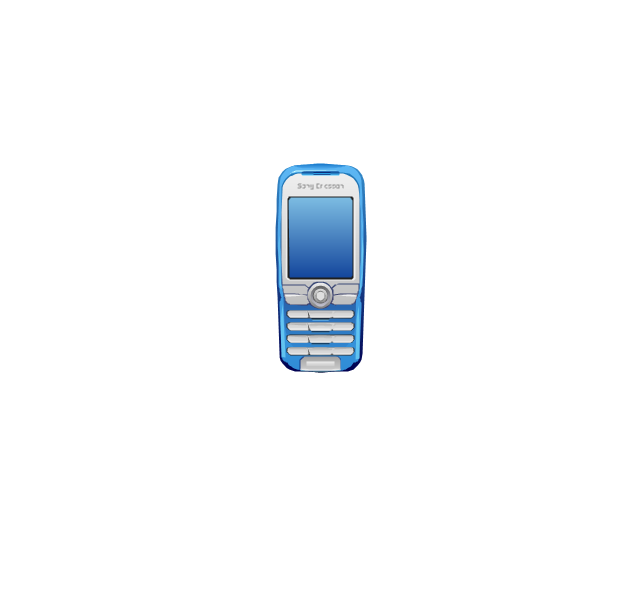
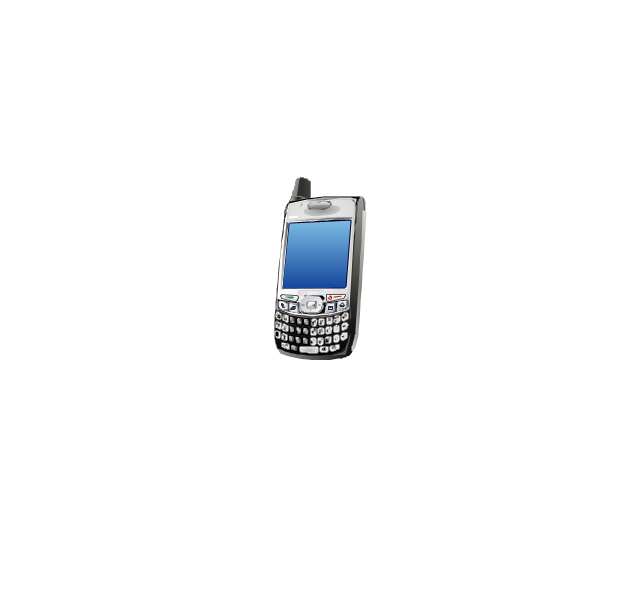
The vector stencils library "Computer network" contains 51 symbols of computer network devices and equipment for drawing computer network diagrams.
"Network Mapping Software.
A number of software tools exist to design computer network diagrams / or generate visual maps of networks, servers, storage, services, data centers, and other peripherals. Broadly, there are two types of software tools - those that help create diagrams manually and those that generate them using automated / semi-automated approaches.
Type of Software.
(1) Manual - allows users to design and draw logical and physical topology diagrams by manually placing icons and connections.
(2) Automated - generate topology diagrams / maps by traversing the network and automatically discovering resident devices or by importing network data." [Comparison of network diagram software. Wikipedia]
ConceptDraw PRO is the software for manual design of computer network diagrams. The solutions of the Computer and Networks area in ConceptDraw Solution Park extend ConceptDraw PRO with vector stencils libraries, templates and examples for creating the computer network diagrams.
The symbols example "Computer network - Vector stencils library" was created using the ConceptDraw PRO diagramming and vector drawing software extended with the Computer and Networks solution from the Computer and Networks area of ConceptDraw Solution Park.
www.conceptdraw.com/ solution-park/ computer-and-networks
This vector stencils library contains 195 cloud computing icons.
Use it to design cloud computing infographic and diagrams with ConceptDraw PRO software.
"Cloud computing, also on-demand computing, is a kind of Internet-based computing that provides shared processing resources and data to computers and other devices on demand. It is a model for enabling ubiquitous, on-demand access to a shared pool of configurable computing resources (e.g., networks, servers, storage, applications and services), which can be rapidly provisioned and released with minimal management effort. Cloud computing and storage solutions provide users and enterprises with various capabilities to store and process their data in third-party data centers.
Cloud computing has become a highly demanded service or utility due to the advantages of high computing power, cheap cost of services, high performance, scalability, accessibility as well as availability." [Cloud computing. Wikipedia]
The vector stencils library "Cloud clipart" is included in the Cloud Computing Diagrams solution from the Computer and Networks area of ConceptDraw Solution Park.
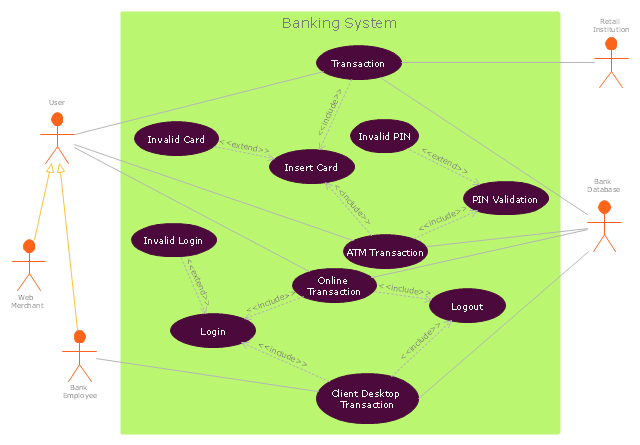
"Banks offer many different channels to access their banking and other services:
(1) Automated Teller Machines.
(2) A branch is a retail location.
(3) Call center.
(4) Mail: most banks accept cheque deposits via mail and use mail to communicate to their customers, e.g. by sending out statements.
(5) Mobile banking is a method of using one's mobile phone to conduct banking transactions.
(6) Online banking is a term used for performing multiple transactions, payments etc. over the Internet.
(7) Relationship Managers, mostly for private banking or business banking, often visiting customers at their homes or businesses.
(8) Telephone banking is a service which allows its customers to conduct transactions over the telephone with automated attendant or when requested with telephone operator.
(9) Video banking is a term used for performing banking transactions or professional banking consultations via a remote video and audio connection. Video banking can be performed via purpose built banking transaction machines (similar to an Automated teller machine), or via a video conference enabled bank branch clarification.
(10) DSA is a Direct Selling Agent, who works for the bank based on a contract. Its main job is to increase the customer base for the bank." [Bank. Wikipedia]
The UML use case diagram example "Banking system" was created using the ConceptDraw PRO diagramming and vector drawing software extended with the Rapid UML solution from the Software Development area of ConceptDraw Solution Park.
- Data Flow Diagram Level 0 1 2 For Library Management System
- Draw 0 Level 1level 2 Level Dfds For A Library Management System
- Data Flow Diagram Symbols. DFD Library | DFD Library System ...
- Draw Dfd For Book Issue In Library For Library Management From 0
- Data Flow Diagram Symbols. DFD Library
- Level O Level 1dfd For Library Management System
- Draw A Level 0 And Level 1 Dfd For A Banking Information System
- Data Flow Diagram Of Atm System At 0 Level
- Library Management System For Dfd In 0 Level 1 Level
- Data Flow Diagrams ( DFD ) | Dfd For Library Automation System
- Draw First Two Dfd Level Of Library Management System
- Data Flow Diagrams ( DFD ) | Business Process Diagrams | Fishbone ...
- IDEF0 Diagrams | IDEF0 Visio | UML Component Diagram Example ...
- DFD Library System | Database Flowchart Symbols | Data Flow ...
- Example of DFD for Online Store ( Data Flow Diagram ) DFD ...
- Example of DFD for Online Store ( Data Flow Diagram ) DFD ...
- Draw A 0 Level And 1 Level Dfd Of A Online Admission System
- 1 Level Data Flow Diagram Of Library Management In Software
- Cross Functional Flowchart for Business Process Mapping | Classic ...
- 0th Level Dfd Of Library Management System



-cisco-network-topology---vector-stencils-library.png--diagram-flowchart-example.png)
-cisco-network-topology---vector-stencils-library.png--diagram-flowchart-example.png)

-cisco-network-topology---vector-stencils-library.png--diagram-flowchart-example.png)

-cisco-network-topology---vector-stencils-library.png--diagram-flowchart-example.png)









-cisco-network-topology---vector-stencils-library.png--diagram-flowchart-example.png)


























-cloud-clipart---vector-stencils-library.png--diagram-flowchart-example.png)
-cloud-clipart---vector-stencils-library.png--diagram-flowchart-example.png)


-cloud-clipart---vector-stencils-library.png--diagram-flowchart-example.png)


-cloud-clipart---vector-stencils-library.png--diagram-flowchart-example.png)
-cloud-clipart---vector-stencils-library.png--diagram-flowchart-example.png)


