Examples of Flowcharts, Org Charts and More
ConceptDraw DIAGRAM covers a broad spectrum of business graphics categories and offers at ConceptDraw STORE enormous online collection of pictorial examples and samples for different thematics and application areas. It is a plentiful source of inspiration and wonderful examples of professionally designed diagrams, flowcharts, UML diagrams, organizational charts, databases, ERDs, network diagrams, business charts, different thematic charts, schematics, infographics and plans developed specially for knowledge workers, engineers, managers, businessmen, marketing specialists, analytics, scientists, students, professors, journalists and also for a large number of other people that every day use various diagrams and drawings in their work and life activity. Each of these examples is a real art, all they are well thought-out and designed without efforts with help of powerful tools of ConceptDraw DIAGRAM software. ConceptDraw examples display all variety of tasks, possibilities and results that ConceptDraw Product Line lets achieve fast and easy. ConceptDraw is one of the best Visio alternatives for Mac. It open all Visio formats like.vsdx,.vss,.vdx files and allows you to export files to Visio formats.
Entity Relationship Diagram Examples
Creation of Entity-Relationship (ER) model is a visual representation the structure of a business database, where data equates to entities or objects, which are linked by defined relationships expressing dependencies and requirements. By the nature, the ER model is an abstract visualization, a first step in design process towards creating a logical and functional database. ConceptDraw DIAGRAM professional software gives the ability to effectively describe a database using the Entity-Relationship model. Included to ConceptDraw Solution Park, the Entity-Relationship Diagram (ERD) solution contains the set of predesigned vector icons advocated by Chen's and Crow’s Foot notations that both can be used for data modeling and describing a database. Entity-Relationship Diagram (ERD) solution includes also helpful templates and incredibly large collection of varied Entity Relationship Diagram examples and samples offered at ConceptDraw STORE. Each of them can be used to develop your own model of a database of arbitrary complexity.
Workflow Diagram Data
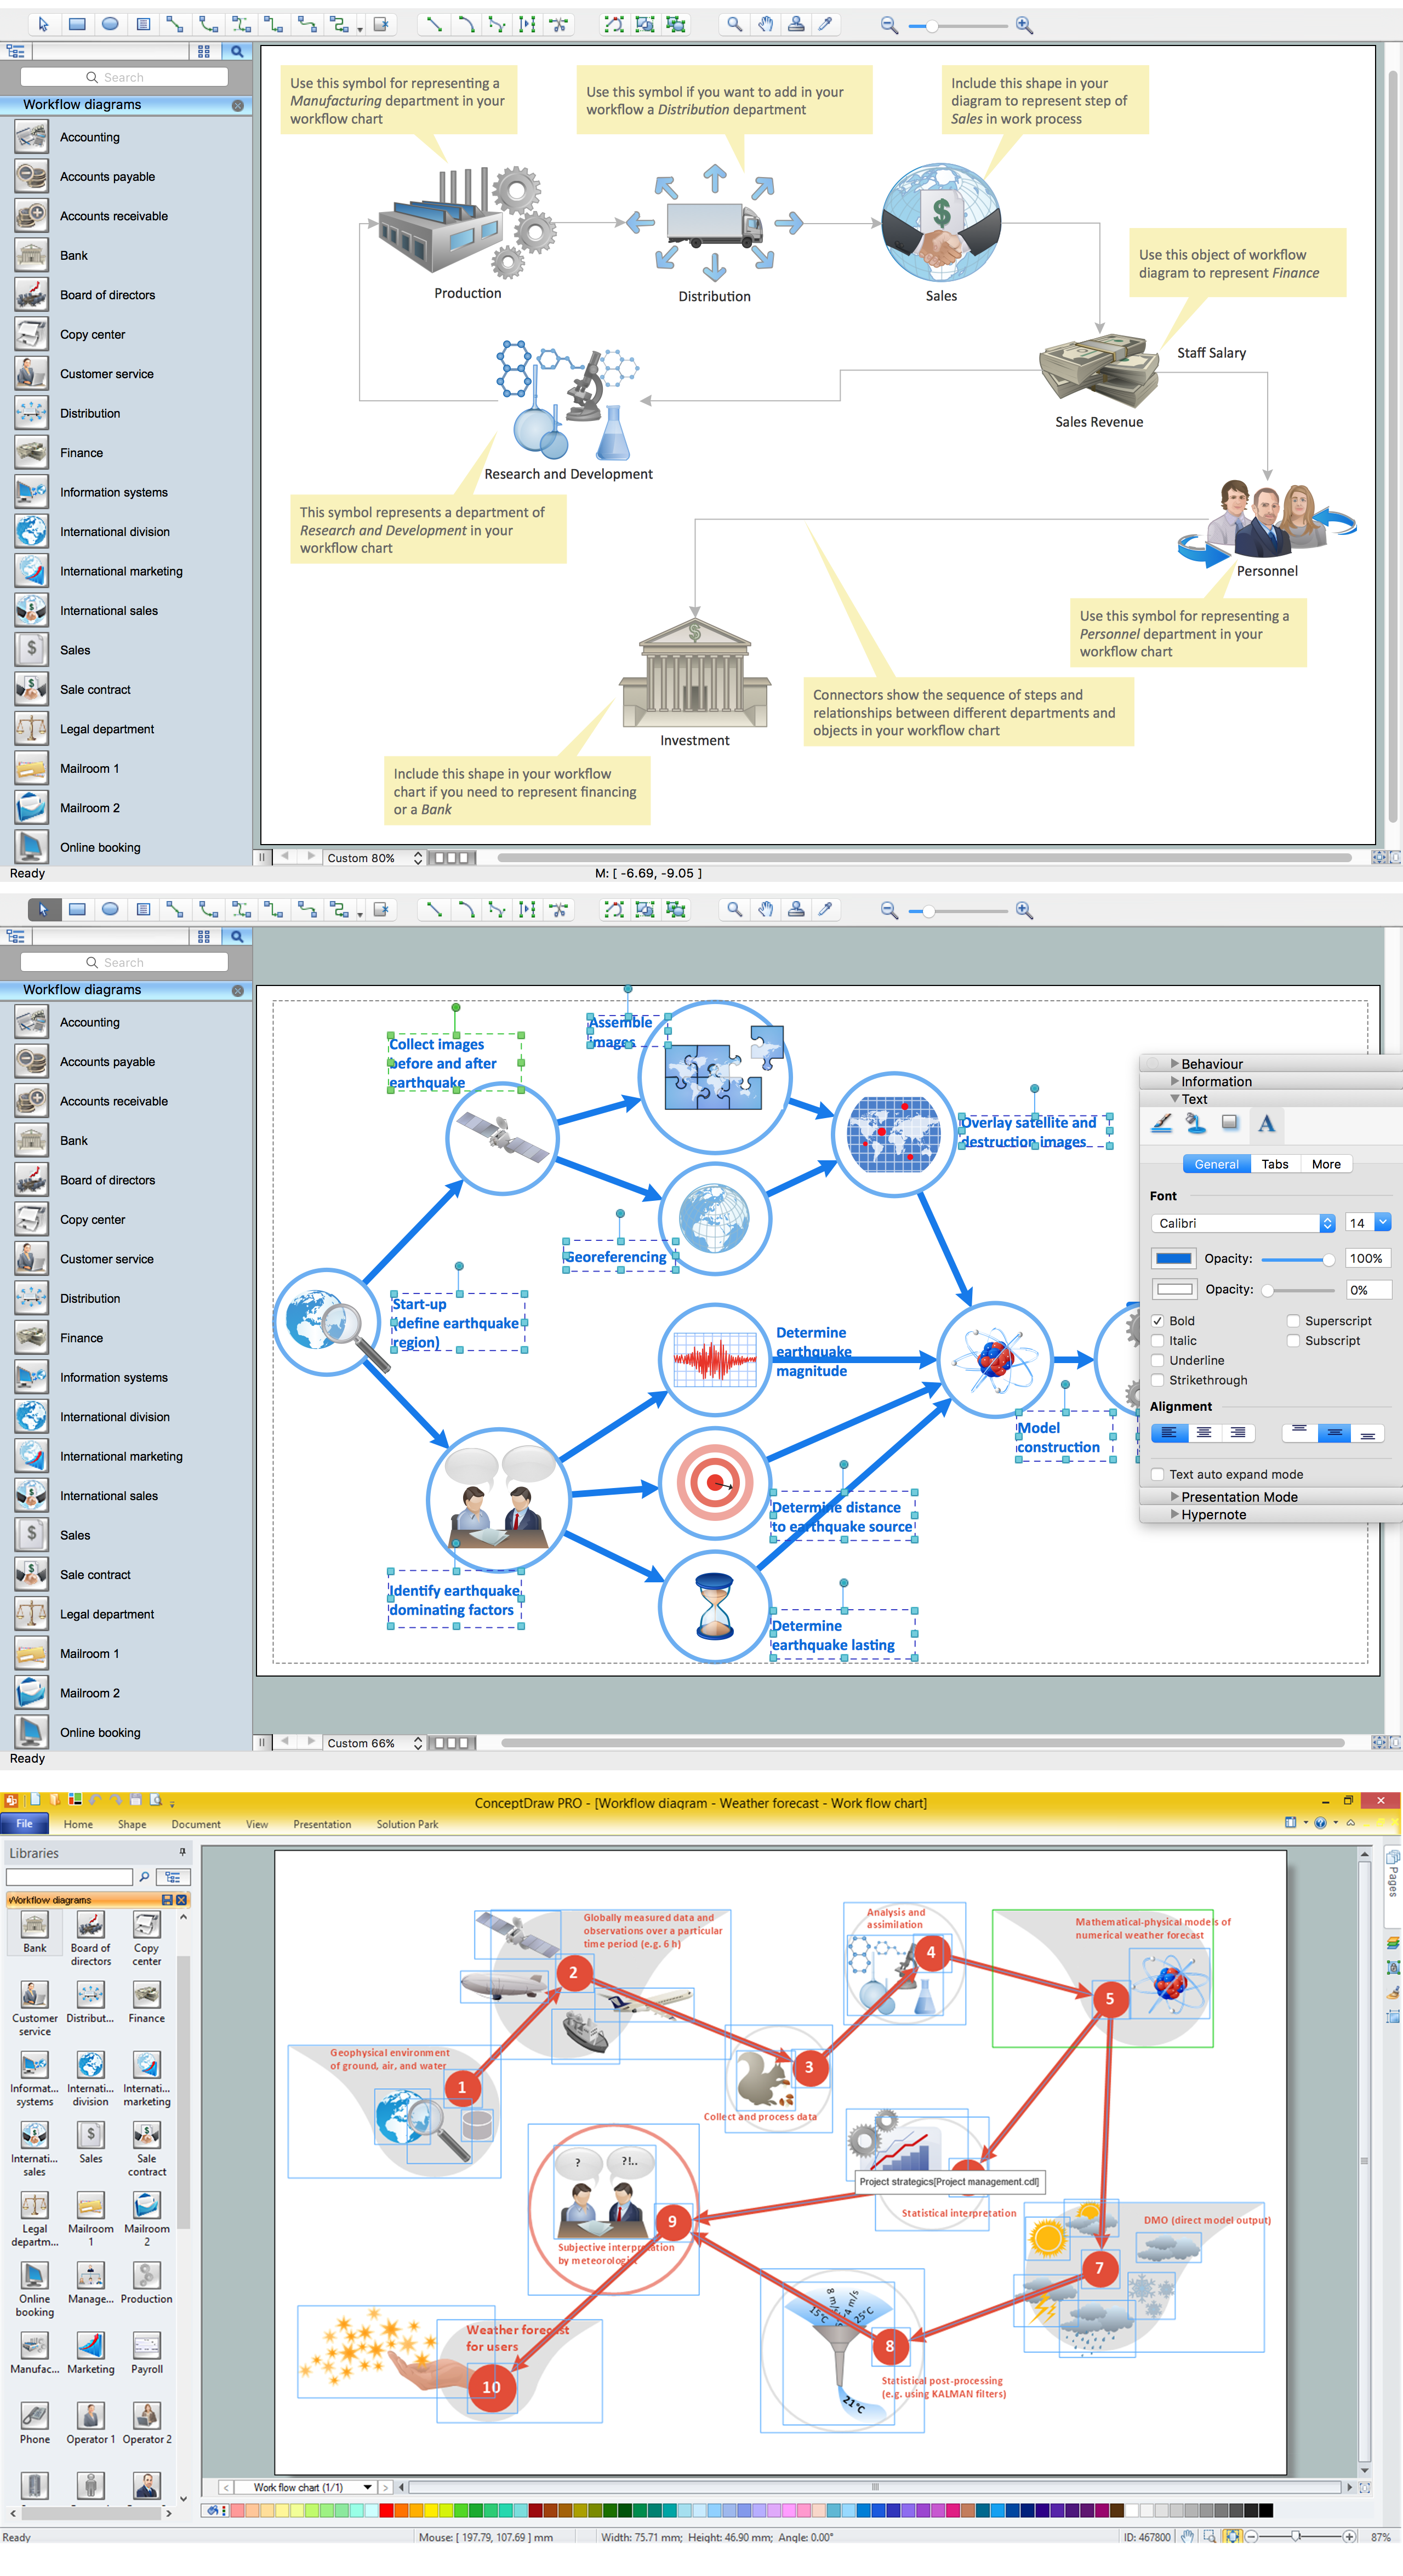
Workflow Diagram created by using special software based on graphic mastering technology Arrows10. Its automatics follows the global concept of business graphics and diagramming. The practical effectiveness of Arrows10 technology used in ConceptDraw DIAGRAM are around the quick auto-arrows behaving as expected and connecting boxes of workflow diagram from workflow symbol to process flow symbol. ConceptDraw DIAGRAM is a workflow diagram software contains specific features help you to draw diagrams faster, such as RapidDraw, or Arrows10. There is also a rich set of samples and templates to give you an example of data may be visualized as workflow diagram.Entity-Relationship Diagram
Entity Relationship Diagram (ERD) is the world-known way to show the logical structure of databases in visual manner. The best software tool for drawing Entity-Relationship Diagram is ConceptDraw DIAGRAM ector graphics software with Entity-Relationship Diagram (ERD) solution from Software Development area which gives the ability to describe a database using the Entity-Relationship model. The vector graphic diagrams produced using this solution can be successfully used in whitepapers, presentations, datasheets, posters, or any technical materials.Notation & Symbols for ERD
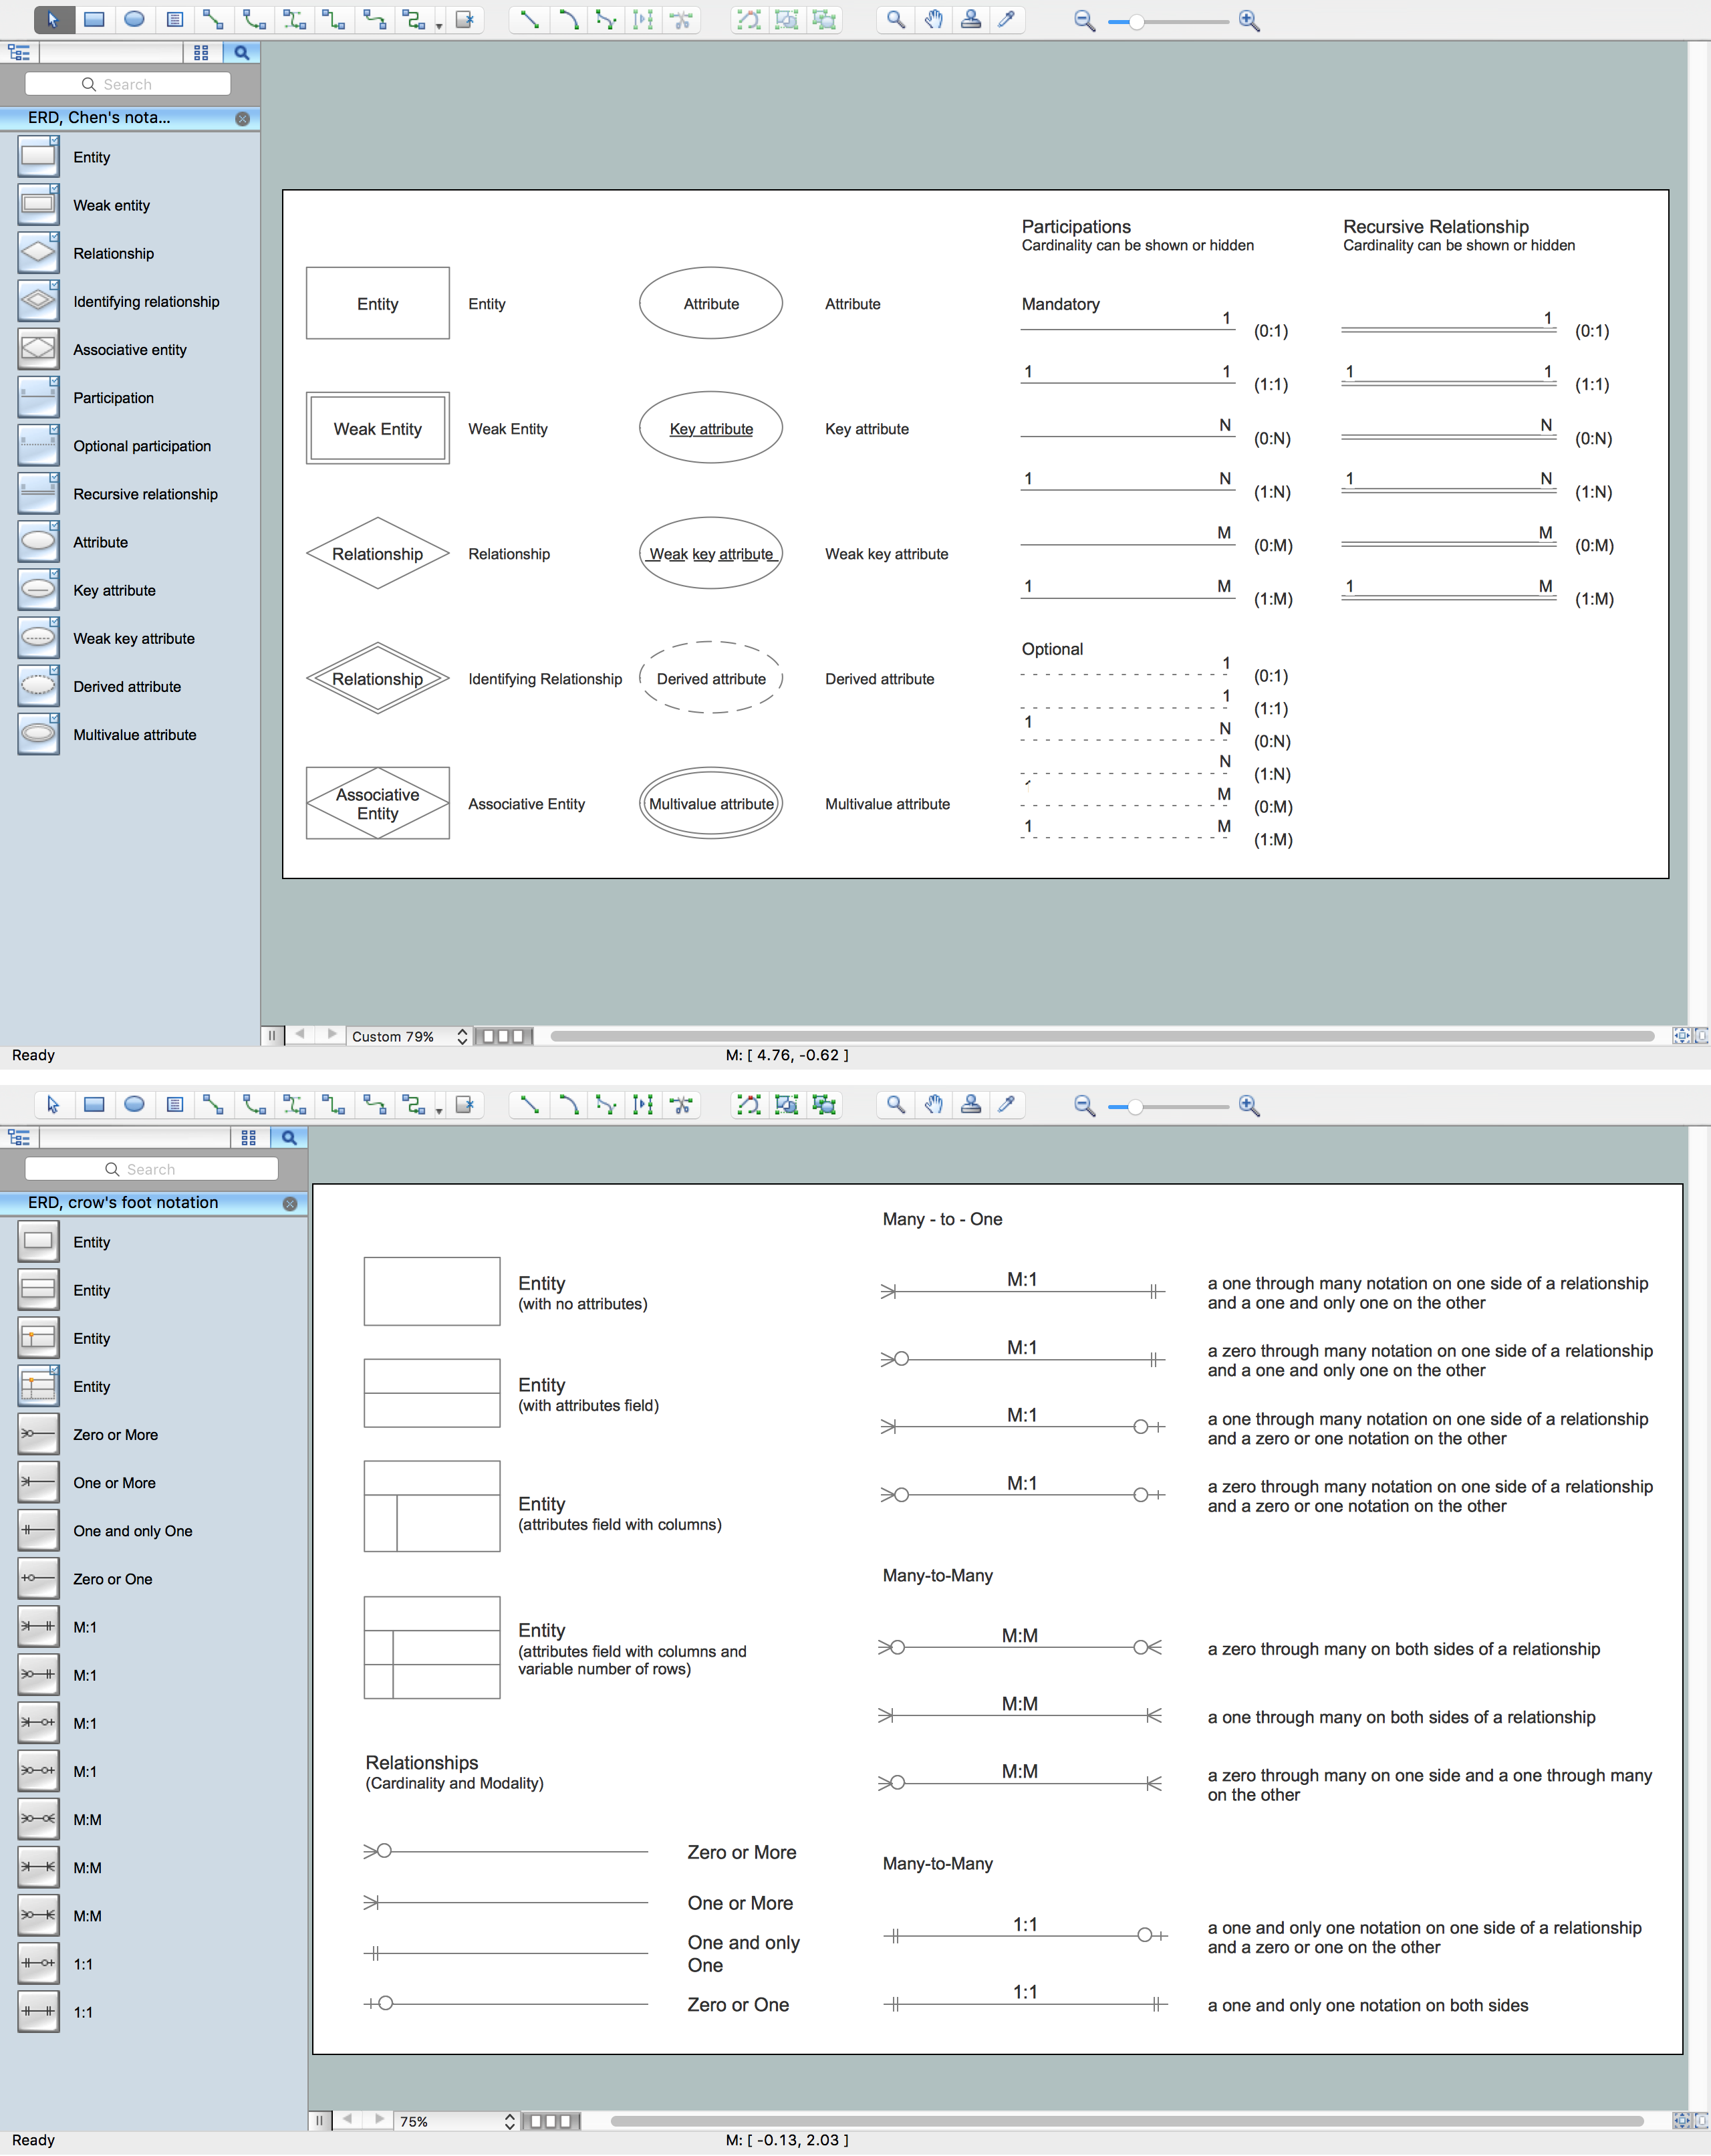
The ER diagram is constructed from the specific ERD graphic elements. There are used 2 types of ERD notations: Chen and Crow's Foot. A complete set of work flow shapes, notation & symbols for ERD, entity relationship stencils, included in Entity-Relationship Diagram (ERD) solution for ConceptDraw DIAGRAM software, makes drawing diagrams based on ERD notation as smooth as possible.Entity Relationship Diagram Software Engineering
Entity Relationship Diagram (aka ER Diagram, E-R Diagram, ERD) is a time-tested and widespread software development and software engineering method for data modeling, illustrating the logical structure of databases and system design. For ERDs construction are used three basic elements: entities, attributes, and relationships. Chen's notation for ERD supposes the use of rectangles (boxes) to represent entities and diamonds to depict relationships between first-class objects. This notation is popular when creating conceptual data models of information systems. Another standardized notation for ER diagrams is Crow's foot notation. ConceptDraw DIAGRAM as a powerful Entity Relationship Diagram software engineering provides the tools of Entity-Relationship Diagram (ERD) solution from Software Development area of ConceptDraw Solution Park for instantly describing databases using ERDs of Crow’s Foot and Chen’s notations. Use the predesigned vector elements for both these notations from 2 libraries included to Entity-Relationship Diagram (ERD) solution.Accounting Data Flow from the Accounting Flowcharts Solution
Accounting Data Flow from the Accounting Flowcharts Solution visually describes the financial accounting process, shows the accumulated information about transactions and events for creating the balance sheet and the final income statement. Accounting Flowcharts Solution contains also a wide variety of templates and samples that you can use as the base for your own Accounting Flowcharts of any complexity.Entity Relationship Software
Entity Relationship Diagram (ERD) is a leading data modeling tool that is used to illustrate the logical structure of database, helps to organize and represent your project's data in terms of entities, attributes and relationships. To describe the database structure usually is used the ERD Chen's or Crow's Foot notation. Chen's notation supposes the representation of entities by rectangles with the entities names inside, relationships by diamonds and attributes by ovals connected with a line to exactly one entity. In Crow's Foot notation the boxes are used to depict the entities and their attributes, the lines between them - to depict relationships. ConceptDraw DIAGRAM software extended with Entity-Relationship Diagram (ERD) Solution is convenient and useful for designing the ER Diagrams, and supports the use of Chen's or Crow’s Foot notation according to your needs and desires. The ERD diagrams produced with ConceptDraw DIAGRAM Entity Relationship Diagram software can be successfully used in whitepapers, presentations, posters, datasheets, technical materials, etc.Components of ER Diagram
Entity-Relationship model gives the possibility to visually describe a database using the components of ER Diagram, entity relationship stencils, relationship symbols, work flow shapes. ER-diagram lets represent the data or entities, attributes of these entities and relationships between them, using standardized Crow’s Foot notation icons or Chen’s notation icons. An entity is an object of the real world, it can exist independently and has the instances which differ in attribute values (properties). The attributes give an unambiguous (uniquely) identification for the instance and are called the primary key, this key can be composite and combine several attributes. ConceptDraw DIAGRAM is a professional software available with Entity-Relationship Diagram (ERD) solution from Software Development area that lets create ERDs for various database systems, using Crow’s Foot and Chen’s notations. It is invaluable tool for software engineers and developers, it supports ODBC-compatible databases (Oracle, MySQL, MS Access, MS SQL, InterBase, Firebird and others).Business Process Mapping — How to Map a Work Process
ConceptDraw DIAGRAM is a world-class diagramming platform that lets you display, communicate, and present dynamically. It′s powerful enough to draw everything from basic flowcharts to complex engineering schematics. Video tutorials on ConceptDraw products. Try it today!- Draw An E R Diagram For A Small Marketing Company Database
- Database Design | Draw Er Diagram For Small Marketing Company ...
- Example of DFD for Online Store ( Data Flow Diagram) | Entity ...
- Er Diagram For Small Marketing Company Database
- Database Design For Transport Management System
- Draw ER Model Of Finance Company
- Process Flowchart | Business Process Diagrams | Entity ...
- Er Diagram For Construction Company
- Entity Relationship Diagram Examples
- How To Design An ER For Manufacturing Company


