 Marketing
This solution extends ConceptDraw DIAGRAM and ConceptDraw MINDMAP with Marketing Diagrams and Mind Maps (brainstorming, preparing and holding meetings and presentations, sales calls).
SWOT Analysis
Most of the data needed for market analysis (demand, prices, volume of sales, etc.) are undefined, and in future are possible their changes as in the worst and the best side. SWOT analysis is effective method for prediction these processes and decision making for organizations that function in a competitive environment. It allows you to see the whole situation, to identify the strengths and weaknesses of organization (advantages and disadvantages), as well as opportunities and threats of external environment. The results of SWOT analysis are the basis for optimization the business processes, for development by the leading specialists in organization of interrelated complex of strategies and competitive activities. ConceptDraw DIAGRAM software enhanced with SWOT and TOWS Matrix Diagrams Solution will effectively help you in strategic planning for your company, department, project, in development marketing campaign, in identification of four categories of factors of internal and external environment of organization, and construction professional-looking SWOT and TOWS matrices.ConceptDraw DIAGRAM : Able to Leap Tall Buildings in a Single Bound
ConceptDraw DIAGRAM is the world’s premier cross-platform business-diagramming tool. Many, who are looking for an alternative to Visio, are pleasantly surprised with how well they can integrate ConceptDraw DIAGRAM into their existing processes. With tens of thousands of template objects, and an easy method for importing vital custom objects from existing Visio documents, ConceptDraw DIAGRAM is a powerful tool for making extremely detailed diagrams, quickly and easily.
 Target and Circular Diagrams
This solution extends ConceptDraw DIAGRAM software with samples, templates and library of design elements for drawing the Target and Circular Diagrams.
Ishikawa Diagram
In almost every sphere of life and work the people time to time are faced with the fact that on their way there are certain obstacles and problems. But it is not always possible to identify the true cause of particular problem. To understand the basic causes of problems and eliminate them, it is convenient to use the chart of Kaoru Ishikawa - the technique specially designed for this. ConceptDraw DIAGRAM diagramming and vector drawing software extended with Fishbone Diagrams solution from the Management area can help you with construction the Fishbone Diagram also known as Ishikawa Diagram. Ishikawa Diagram shows factors of Equipment, Process, People, Materials, Environment and Management, all affecting the overall problem in one drawing for the further analysis. It is a well effective way to analyze the business problems you must identify and solve.In searching of alternative to MS Visio for MAC and PC with ConceptDraw DIAGRAM
Undoubtedly MS Visio is a powerful and multifunctional tool, but however at times occur the instances, when it turns unable of meeting certain users' requirements. At this cases you may need to use an alternative program software, preferably it will be simple, convenient, and at the same time powerful and professional. In searching the alternative to MS Visio for MAC and PC we recommend you to pay attention for ConceptDraw DIAGRAM software, which was developed to satisfy all your drawing needs and requirements. It is a fully-functioned alternative product to MS Visio for both platforms. ConceptDraw DIAGRAM software has many advantages, the main among them are the cross-platform compatibility, a reasonable price, widespread ConceptDraw Solution Park with huge variety of different solutions that offer numerous libraries of specialized vector objects, useful examples, samples, and quick-start templates, extensive import / export capabilities, built-in script language, MS Visio support and certainly free technical support.
 Project Management Area
Project Management area provides Toolbox solutions to support solving issues related to planning, tracking, milestones, events, resource usage, and other typical project management functions.
Fishbone Diagram Template
A causal model is an abstract concept, that describes the causal mechanisms of a system, by noting certain variables and their influence on each other, in an effort to discover the cause of a certain problem or flaw. This model is presented in diagram form by using a fishbone diagram. ConceptDraw DIAGRAM diagramming and vector drawing software enhanced with Fishbone Diagrams solution helps you create business productivity diagrams from Fishbone diagram templates and examples, that provide to start using of the graphic method for the analysis of problem causes. Each predesigned Fishbone Diagram template is ready to use and useful for instantly drawing your own Fishbone Diagram.Cause and Effect Diagram
ConceptDraw DIAGRAM software extended with Fishbone Diagrams solution from the Management area of ConceptDraw Solution Park is perfect for Cause and Effect Diagram creating. It gives the ability to draw fishbone diagram that identifies many possible causes for an effect or a problem. Causes and Effects are usually grouped into major categories to identify these sources of variation. Causes and Effects in the diagram show relationships among various factor. Fishbone diagram shows factors of Equipment, Process, People, Materials, Environment and Management, all affecting the overall problem.
 Wireless Networks
The Wireless Networks Solution extends ConceptDraw DIAGRAM software with professional diagramming tools, set of wireless network diagram templates and samples, comprehensive library of wireless communications and WLAN objects to help network engineers and designers efficiently design and create Wireless network diagrams that illustrate wireless networks of any speed and complexity, and help to identify all required equipment for construction and updating wireless networks, and calculating their costs.
HelpDesk
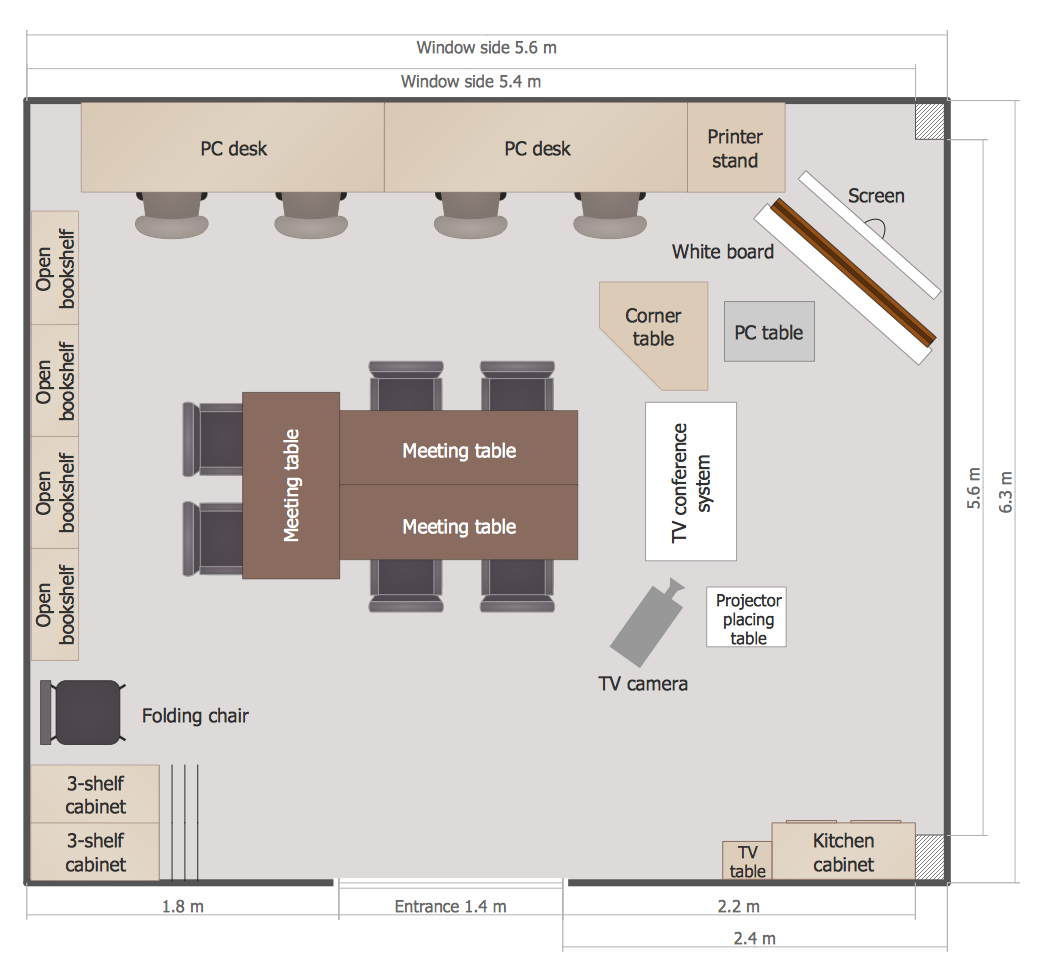
How to Create a Floor Plan for the Classroom
The classroom environment is very important for students. Classroom layout has a big influence on the learning process. The size of the classroom and interior areas, the type of furniture the lightning, and the desk arrangement all influence how students learn. ConceptDraw enables you to build an effective classroom arrangement. Using ConceptDraw School and Training Plans solution you can quickly sketch the Floor Plan for your classroom. It provides you with a special library that contains the set of vector objects that represent desks, tables, storage and more. You can even change your classroom size and print your layout.Matrix Organization Structure
Matrix organizational structure is one of the main forms of structures which is actively used by organizations to carry forth the functions of a company visually and effectively. Now we have ConceptDraw DIAGRAM diagramming and vector drawing software extended with 25 Typical Orgcharts solution from the Management area of ConceptDraw Solution Park which will help easy represent matrix organizational structure of any degree of complexity.
 Collaboration Area
The solutions from Collaboration area of ConceptDraw Solution Park extend ConceptDraw DIAGRAM and ConceptDraw MINDMAP software with features, samples, templates and vector stencils libraries for drawing diagrams and mindmaps useful for collaboration.
HelpDesk
How to Work with Multiple Licenses in a Cross-Platform Environment
ConceptDraw multiuser license is used for installation on both macOS and Window. Our Licensing policy concerning Multi-user licensing allows for each named user to install ConceptDraw software on one Macintosh and one Windows computer.
 Office Layout Plans
Office layouts and office plans are a special category of building plans and are often an obligatory requirement for precise and correct construction, design and exploitation office premises and business buildings. Designers and architects strive to make office plans and office floor plans simple and accurate, but at the same time unique, elegant, creative, and even extraordinary to easily increase the effectiveness of the work while attracting a large number of clients.
 Stakeholder Onion Diagrams
The Stakeholder Onion Diagram is often used as a way to view the relationships of stakeholders to a project goal. A basic Onion Diagram contains a rich information. It shows significance of stakeholders that will have has influence to the success achieve
 PM Response
The PM Response solution extends the functional abilities in project management for all three ConceptDraw products by helping to improve the response time to project changes, to plan on how to effectively respond on issues and events impacting the project. It supplies the project managers, team leaders, and all other project participants with wide abilities of iteration planning, creative collaboration, effective decision-making, discussions of the project layout approaches and solving the project challenges, lets them use mind mapping technique for iteration planning and applying the project changes, to represent the projects data as Mind Maps and use them to construct the clear plans, to convert project maps to project implementations, to use different kinds of Visual diagrams to solve the current project problems and to make correct decisions, to plan resources usage and to respond to changes in the project environment.
Material Requisition Flowchart. Flowchart Examples
Material requisition is a request generated by internal or external organization with a goal to inform the purchase department about the needed items and materials. The requisition can be represented as a written document on a pre-printed form or online request in form of electronic document. The electronic inquisition occupies a leading position in a modern world, now the paper forms are replaced by electronic ordering processes and workflows. The requisition is actively used in business as an internal document for notification the store about the needed goods, in medicine for making the orders on medical equipment and medicaments, in industry for creation request for purchasing some items and materials, and so on. ConceptDraw DIAGRAM ector graphics software extended with Flowcharts solution from the Diagrams area is powerful and useful tool for drawing various types of Flowcharts, including without doubt the Material Requisition Flowchart of any degree of detailing. Succeed in drawing using the large quantity of predesigned flowchart specific shapes, symbols and icons.- Marketing | Target and Circular Diagrams | What is SWOT Analysis ...
- Marketing | Types of Flowcharts | Material Requisition Flowchart ...
- Target Diagram
- Example Mind Map Of Marketing Environment
- Schematic Diagram Of Marketing Environment
- Flow Chart Of Marketing Environment
- Marketing | What is SWOT Analysis? | Swot Analysis Strengths ...
- Circle-spoke diagram - Target market | Target and Circular ...
- 5 level pyramid model diagram of information systems types ...
- Draw The Diagram Of Micro Business Environment
- Marketing mix - Wheel diagram
- Marketing Strategy Block Diagram
- Diagrammatically Show Marketing Environment Types And ...
- Target and Circular Diagrams | Relative Circular Diagram | Circular ...
- Block diagram - Porter's five forces model | Marketing Diagrams ...
- Circular Arrows Diagrams | How to Draw a Circular Arrows Diagram ...
- Target and Circular Diagrams | Circular Arrows Diagrams | Circular ...
- Customer Marketing Diagram
- Marketing Diagrams | Marketing | Marketing mix - Wheel diagram ...


