 Chemical and Process Engineering
This chemical engineering solution extends ConceptDraw DIAGRAM.9.5 (or later) with process flow diagram symbols, samples, process diagrams templates and libraries of design elements for creating process and instrumentation diagrams, block flow diagrams (BFD
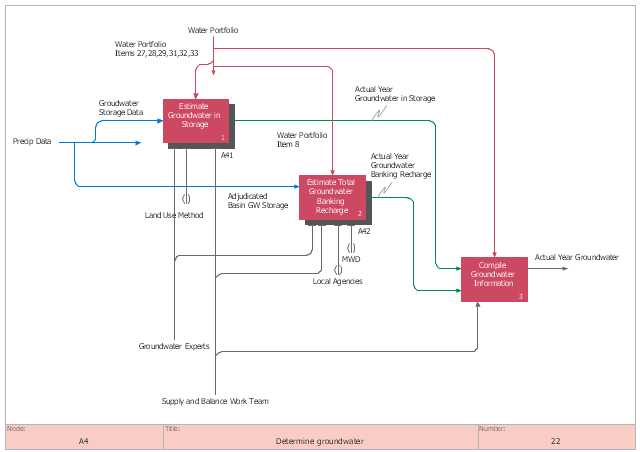
This IDEF0 diagram sample was created on the base of the figure from the California Water Plan website. [waterplan.water.ca.gov/ technical/ cwpu2009/ flowdiaghtml/ dgm18.htm]
"The California Water Plan provides a collaborative planning framework for elected officials, agencies, tribes, water and resource managers, businesses, academia, stakeholders, and the public to develop findings and recommendations and make informed decisions for California's water future. The plan, updated every five years, presents the status and trends of California's water-dependent natural resources; water supplies; and agricultural, urban, and environmental water demands for a range of plausible future scenarios. The California Water Plan also evaluates different combinations of regional and statewide resource management strategies to reduce water demand, increase water supply, reduce flood risk, improve water quality, and enhance environmental and resource stewardship. The evaluations and assessments performed for the plan help identify effective actions and policies for meeting California's resource management objectives in the near term and for several decades to come." [waterplan.water.ca.gov]
The IDEF0 diagram example "Determine groundwater" was created using the ConceptDraw PRO diagramming and vector drawing software extended with the IDEF0 Diagrams solution from the Software Development area of ConceptDraw Solution Park.
 Bar Graphs
The Bar Graphs solution enhances ConceptDraw DIAGRAM functionality with templates, numerous professional-looking samples, and a library of vector stencils for drawing different types of Bar Graphs, such as Simple Bar Graph, Double Bar Graph, Divided Bar Graph, Horizontal Bar Graph, Vertical Bar Graph, and Column Bar Chart.
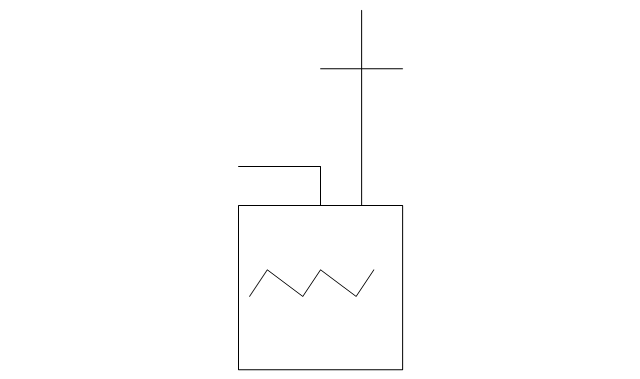
The vector stencils library "HVAC controls" contains 23 symbols of HVAC controls (sensors, actuators, timers, controllers, I/ O points). Use it for drawing HVAC system diagrams, controls drawings, and automated building control and environmental control systems design. The example "HVAC controls - Vector stencils library" was created using the ConceptDraw PRO diagramming and vector drawing software extended with the HVAC Plans solution from the Building Plans area of ConceptDraw Solution Park.
- Easy Diagram Of Water Pollution
- Water Pollution Chart Draw
- Bar Graphs | Diagram Of Water Pollution
- Example Of Fishbone Diagram Water Pollution
- Air And Water Pollution Drawing
- Draw A Chart On Water Pollution
- Water Pollution Drawing Chart
- Bar Graphs | Diagrams And Graphs On Water Pollution
- Drawings And Sketch Of Air And Water Pollution
- Bar Graphs | Water Pollution Diagram Chart
- Bar Graphs | Water Pollution Easy Drawing
- Bar Graphs | Simple Drawing Of Water Pollution
- Draw A Water Pollution
- Bar Graphs | Water Pollution Fishbone Diagram
- Fishbone Diagram Of Water Pollution
- Graph Sketch Of Water Pollution
- Chart Diagram Related To Water Pollution
- How to Draw a Natural Landscape | Water Polution Tree Diagram ...
- Sketches On Water Pollution
