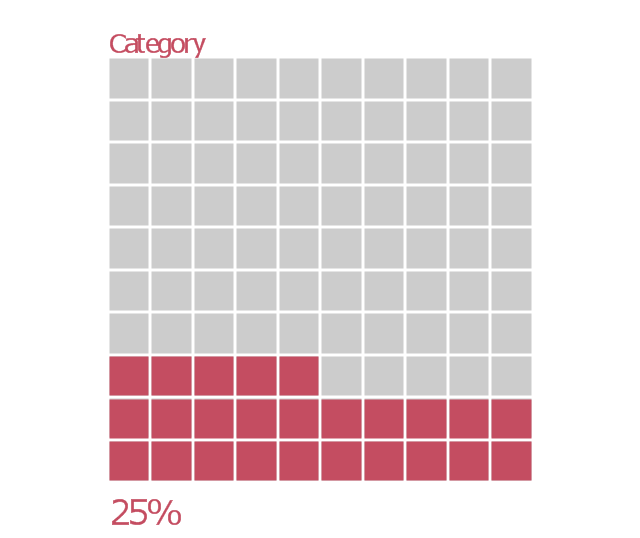
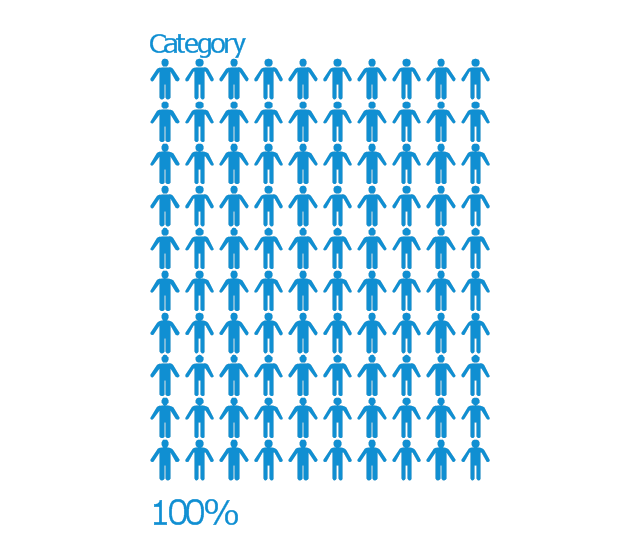
The vector stencils library "Sales KPIs and Metrics" contains 15 chart templates and graphic indicators of sales key performance indicators (KPIs) and metrics.
Use it for drawing sales dashboards in the ConceptDraw PRO diagramming and vector drawing software extended with the Sales Dashboard solution from the Marketing area of ConceptDraw Solution Park.
Use it for drawing sales dashboards in the ConceptDraw PRO diagramming and vector drawing software extended with the Sales Dashboard solution from the Marketing area of ConceptDraw Solution Park.
The vector stencils library "Management indicators" contains 14 visual indicators.
Use it to create your management infogram in the ConceptDraw PRO diagramming and vector drawing software.
The example "Management indicators - Vector stencils library" is included in the solution "Marketing infographics" from the "Business infographics" area of ConceptDraw Solution Park.
Use it to create your management infogram in the ConceptDraw PRO diagramming and vector drawing software.
The example "Management indicators - Vector stencils library" is included in the solution "Marketing infographics" from the "Business infographics" area of ConceptDraw Solution Park.
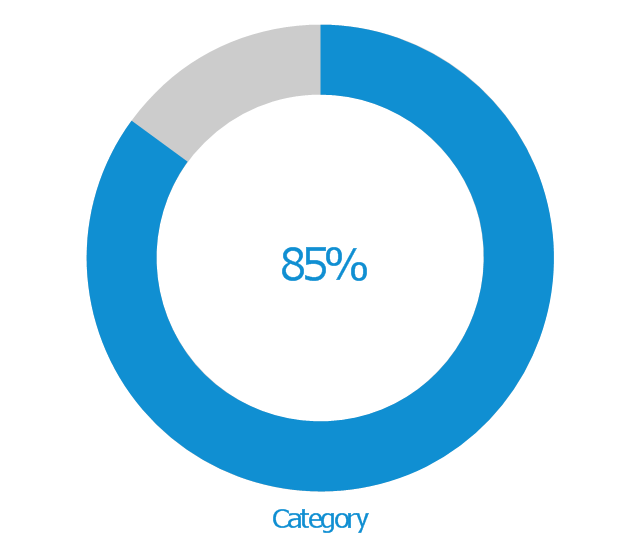
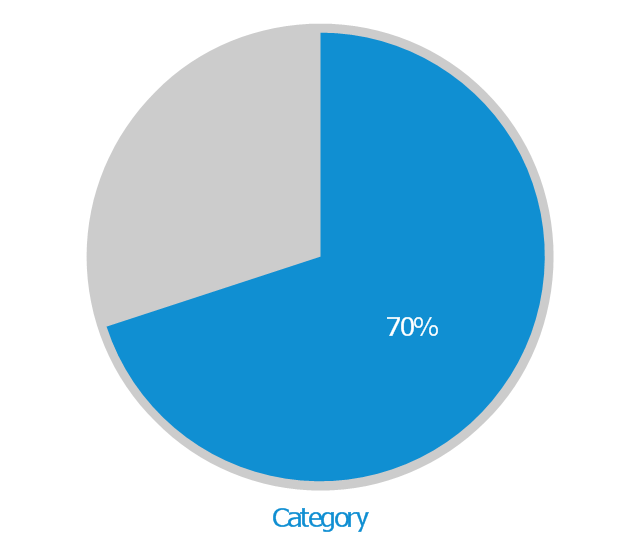
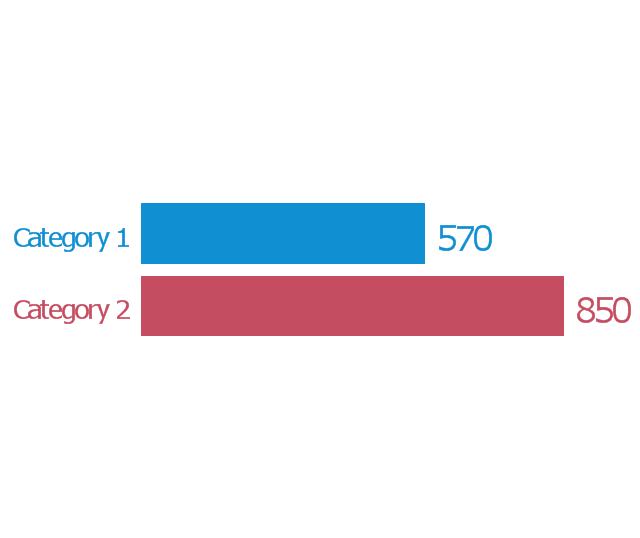
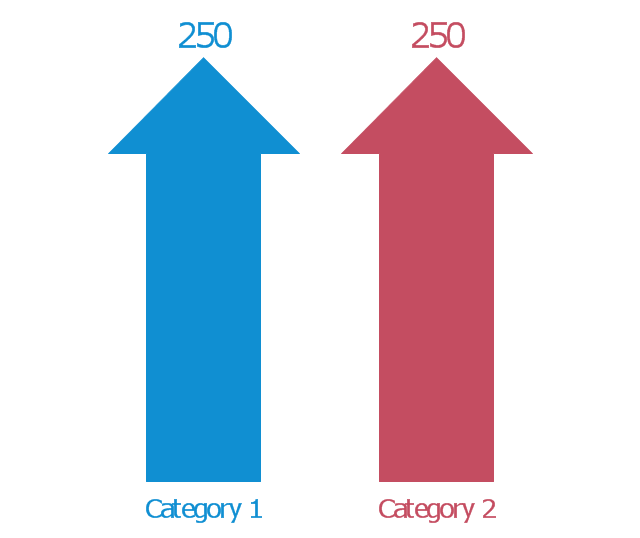
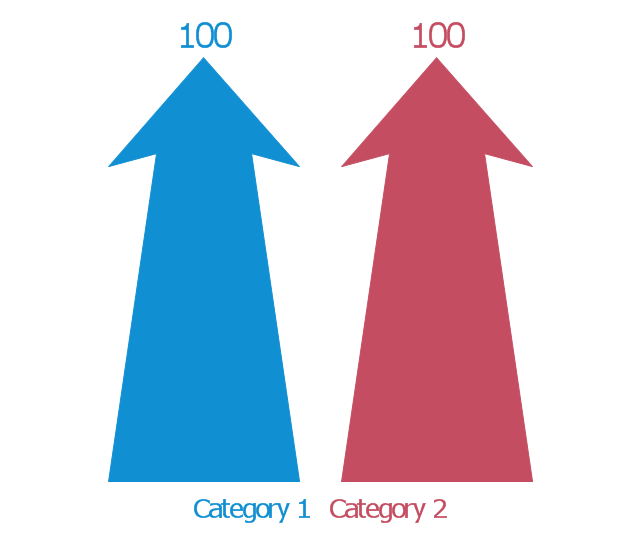
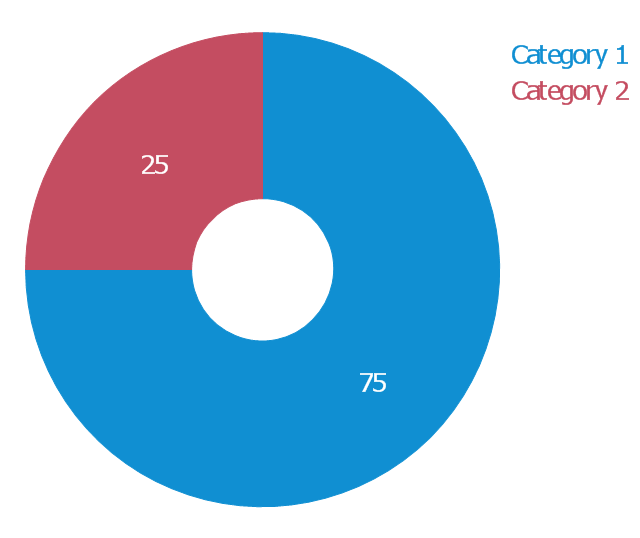
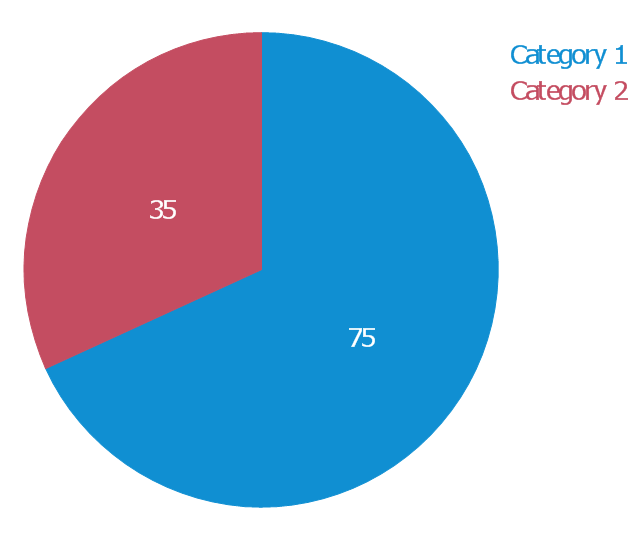
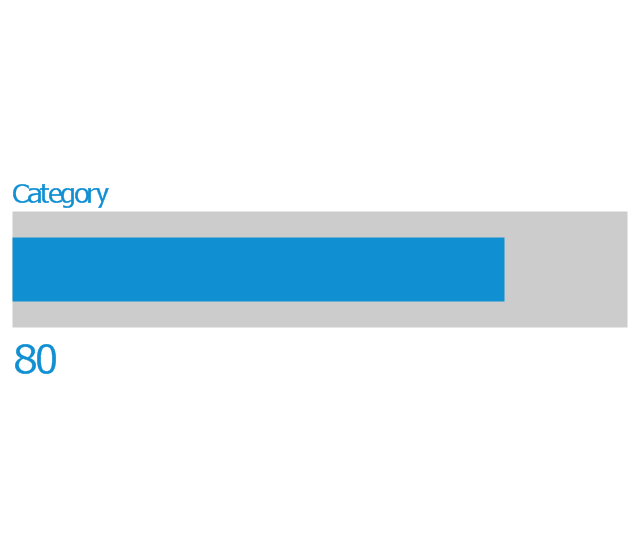
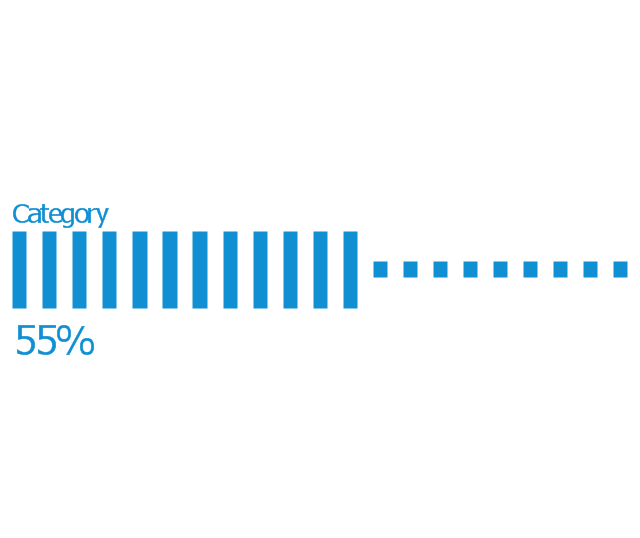
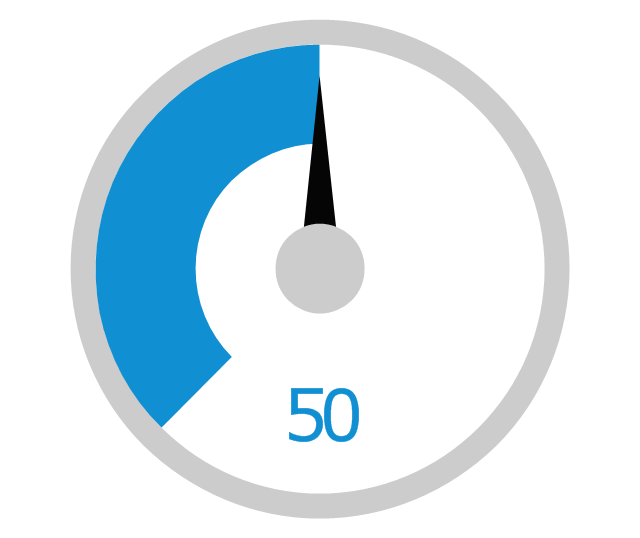
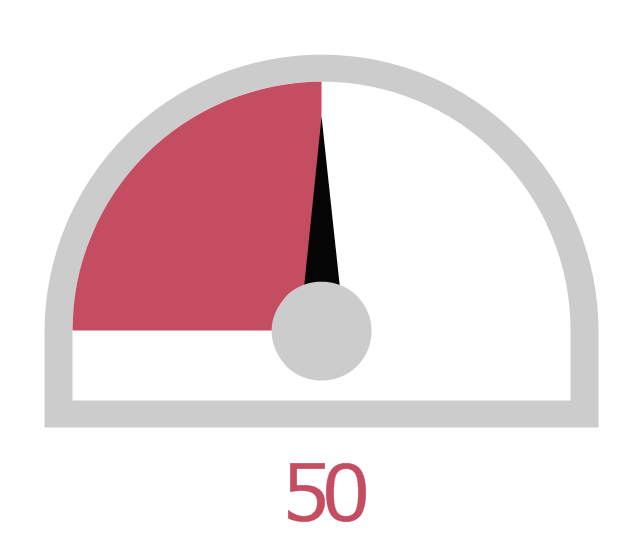
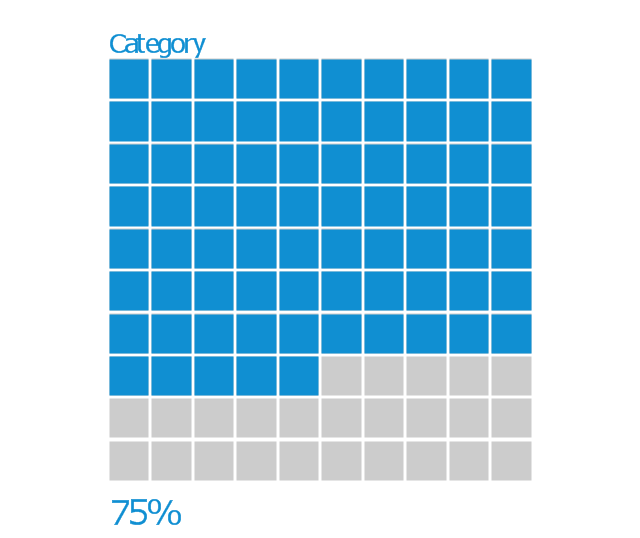
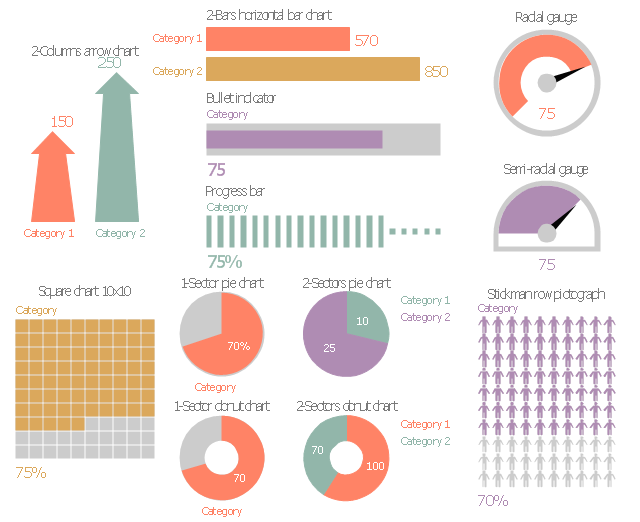
The vector stencils library "Marketing indicators" contains 12 graphic indicators: horizontal bar chart, pie chart, arrow chart, donut chart, square chart, stickman row pictograph, progress bar, bullet indicator, radial gauge, semi-radial gauge.
Use these visual indicators to design your marketing infograms.
The shapes example "Design elements - Marketing indicators" was created using the ConceptDraw PRO diagramming and vector drawing software extended with the Marketing Infographics solition from the area "Business Infographics" in ConceptDraw Solution Park.
- Business Graphics Software | Customer Relationship Management ...
- Concept Draw Speedometer How To Use
- Meter indicators 2 - Vector stencils library | Instruments - Vector ...
- Management indicators - Vector stencils library | Education ...
- Pie charts - Vector stencils library | Data-driven charts - Vector ...
- Circular arrows diagrams - Vector stencils library | How to Draw the ...
- Basic Flowchart Symbols and Meaning | Arrow circle chart ...
- Management indicators - Vector stencils library | Education ...
- Ring Network Topology | Design elements - Meter indicators | IP ...
- Performance Indicators | Design elements - Comparison charts and ...
- Performance Indicators | Composition indicators - Vector stencils ...
- KPIs and Metrics | Sales KPIs and Metrics - Vector stencils library ...
- Picture graphs - Vector stencils library | Management indicators ...
- Sales dashboard - Vector stencils library | Sales metrics and KPIs ...
- Instruments - Vector stencils library | Meter indicators 2 - Vector ...
- Education | Presentations in Educational Process | Design elements ...
- Mechanical Drawing Symbols | Design elements - Pneumatic pumps ...
- How to Create a Line Chart | How to Create a Column Chart ...
- How to Draw a Pie Chart Using ConceptDraw PRO | Content ...
- Design elements - Composition charts and indicators | Pie Charts ...


