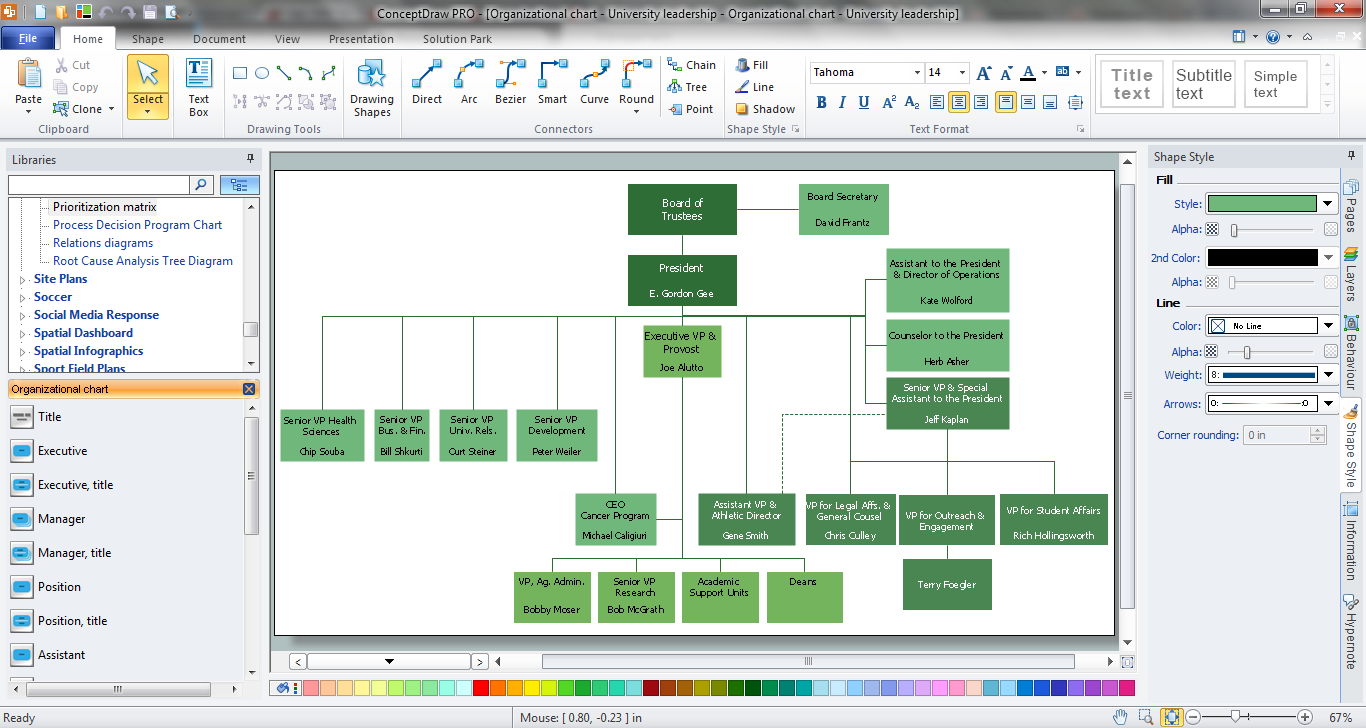
Example of Organizational Chart
Example of Organizational Chart - Lots of organization chart examples created by ConceptDraw Organizational Chart Software. Include company organizational chart, hospital organizational chart, hotel Organizational chart, corporate organizational chart samples etc
Organizational Structure Types
There are three main types of organizational structures which can be adopted by organizations depending on their objectives: functional structure, divisional structure, matrix structure. ConceptDraw DIAGRAM diagramming and vector drawing software enhanced with 25 Typical Orgcharts solution from the Management area of ConceptDraw Solution Park is ideal for designing diagrams and charts of any organizational structure types.Organization Structure
An organization structure reflects the composition and hierarchy of an organization, determines the distribution of authorities and responsibilities. ConceptDraw DIAGRAM diagramming and vector drawing software extended with 25 Typical Orgcharts solution from the Management area of ConceptDraw Solution Park allows effectively represent the organization structure of the company in the form of Organizational Chart.Functional Organizational Structure
A functional organizational structure is a structure that consists of activities such as coordination, supervision and task allocation. You want to draw a functional organizational structure and look for the helpful software for this? Pay attention for the ConceptDraw DIAGRAM software! Extended with Organizational Charts Solution from the Management Area, it is ideal for functional organizational structure development.Pyramid Diagram
The representation of data in a hierarchical or pyramid-like form is one of the most effective and illustrative ways of structuring the data, information, ideas in different fields, among them marketing, management, business, finances, sales, consulting, media, and some others. Pyramid Diagram perfectly suits for this goal, especially if we talk about the representing some marketing strategies, information systems, social strategies. Pyramid Diagram looks like a triangle or reversed triangle that is divided visually on several layers. Each layer can be colored with its own color, this lets visually highlight important moments. ConceptDraw DIAGRAM diagramming and vector graphics software extended with Pyramid Diagrams solution from the Marketing area provides powerful drawing tools, templates, samples, and built-in vector pyramid objects, thus all required tools for equally easy drawing Three level pyramid diagram, Four level pyramid model, Five level pyramid, etc., at this your Pyramid diagrams can have 2D or 3D view as you like.UML Composite Structure Diagram. Design Elements
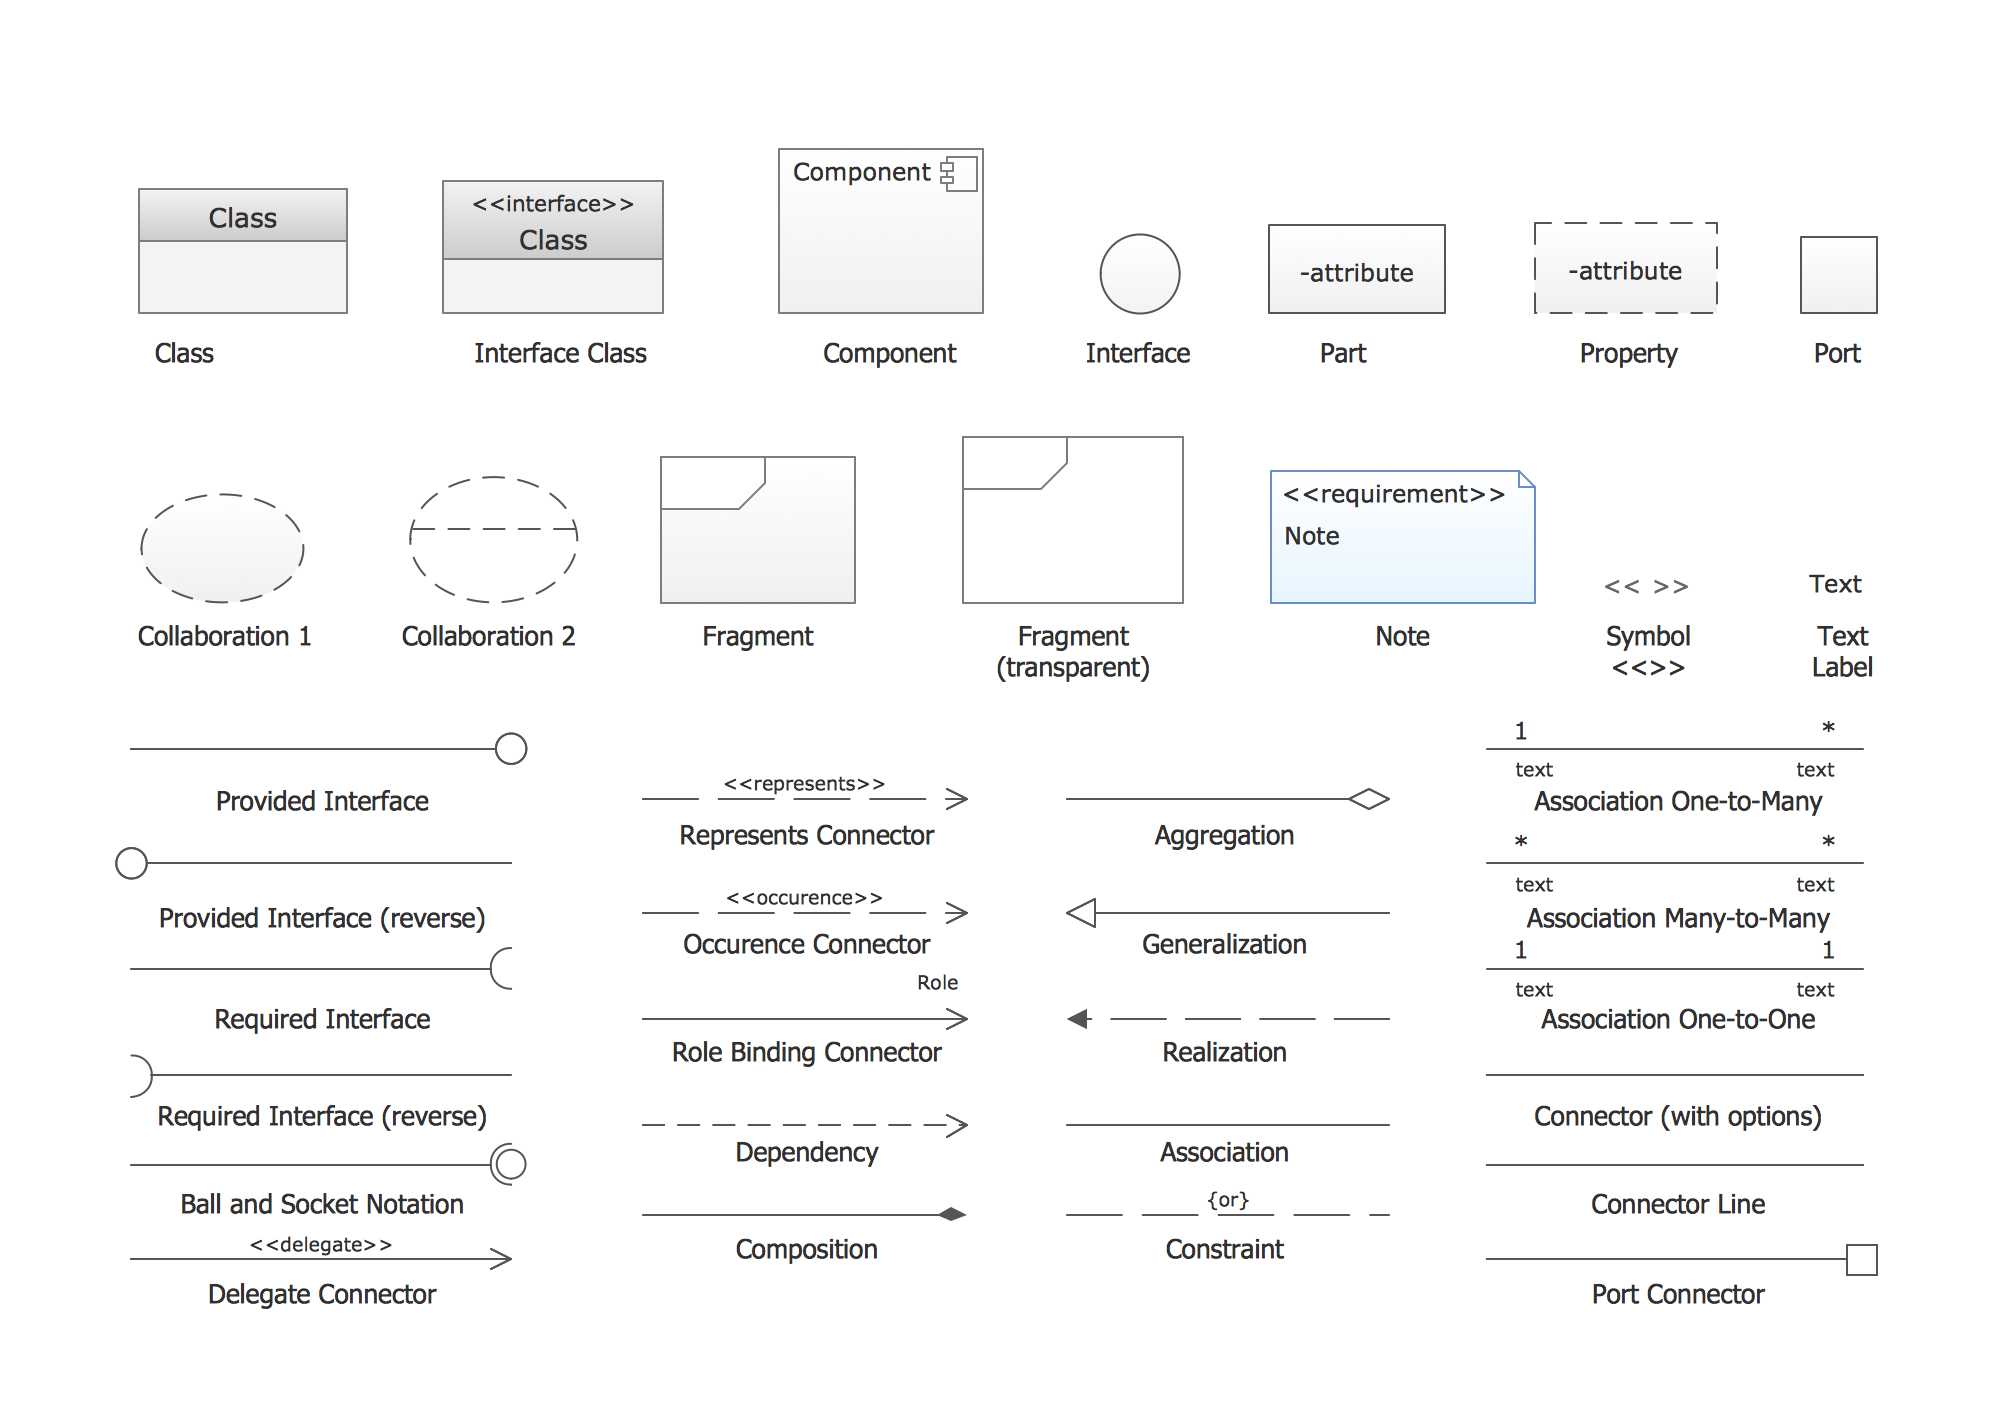
UML Composite Structure Diagram shows the internal structure of a class and the possible interactions at this structure. ConceptDraw has 393 vector stencils in the 13 libraries that helps you to start using software for designing your own UML Diagrams. You can use the appropriate stencils of UML notation from UML Composite Structure library.Bar Diagrams for Problem Solving. Create space science bar charts with Bar Graphs Solution
Bar charts represent data in different categories or groups. Create bar graphs for visual solving your scientific problems and data comparison using the ConceptDraw DIAGRAM diagramming and vector drawing software extended with the Bar Graphs Solution from the Graphs and Charts area of ConceptDraw Solition Park.Collaboration in a Project Team
Create with our data flow diagram software perfect data flow diagrams. Download data flow diagram software for FREE. Use hundreds of data flow diagram examples.Notation & Symbols for ERD
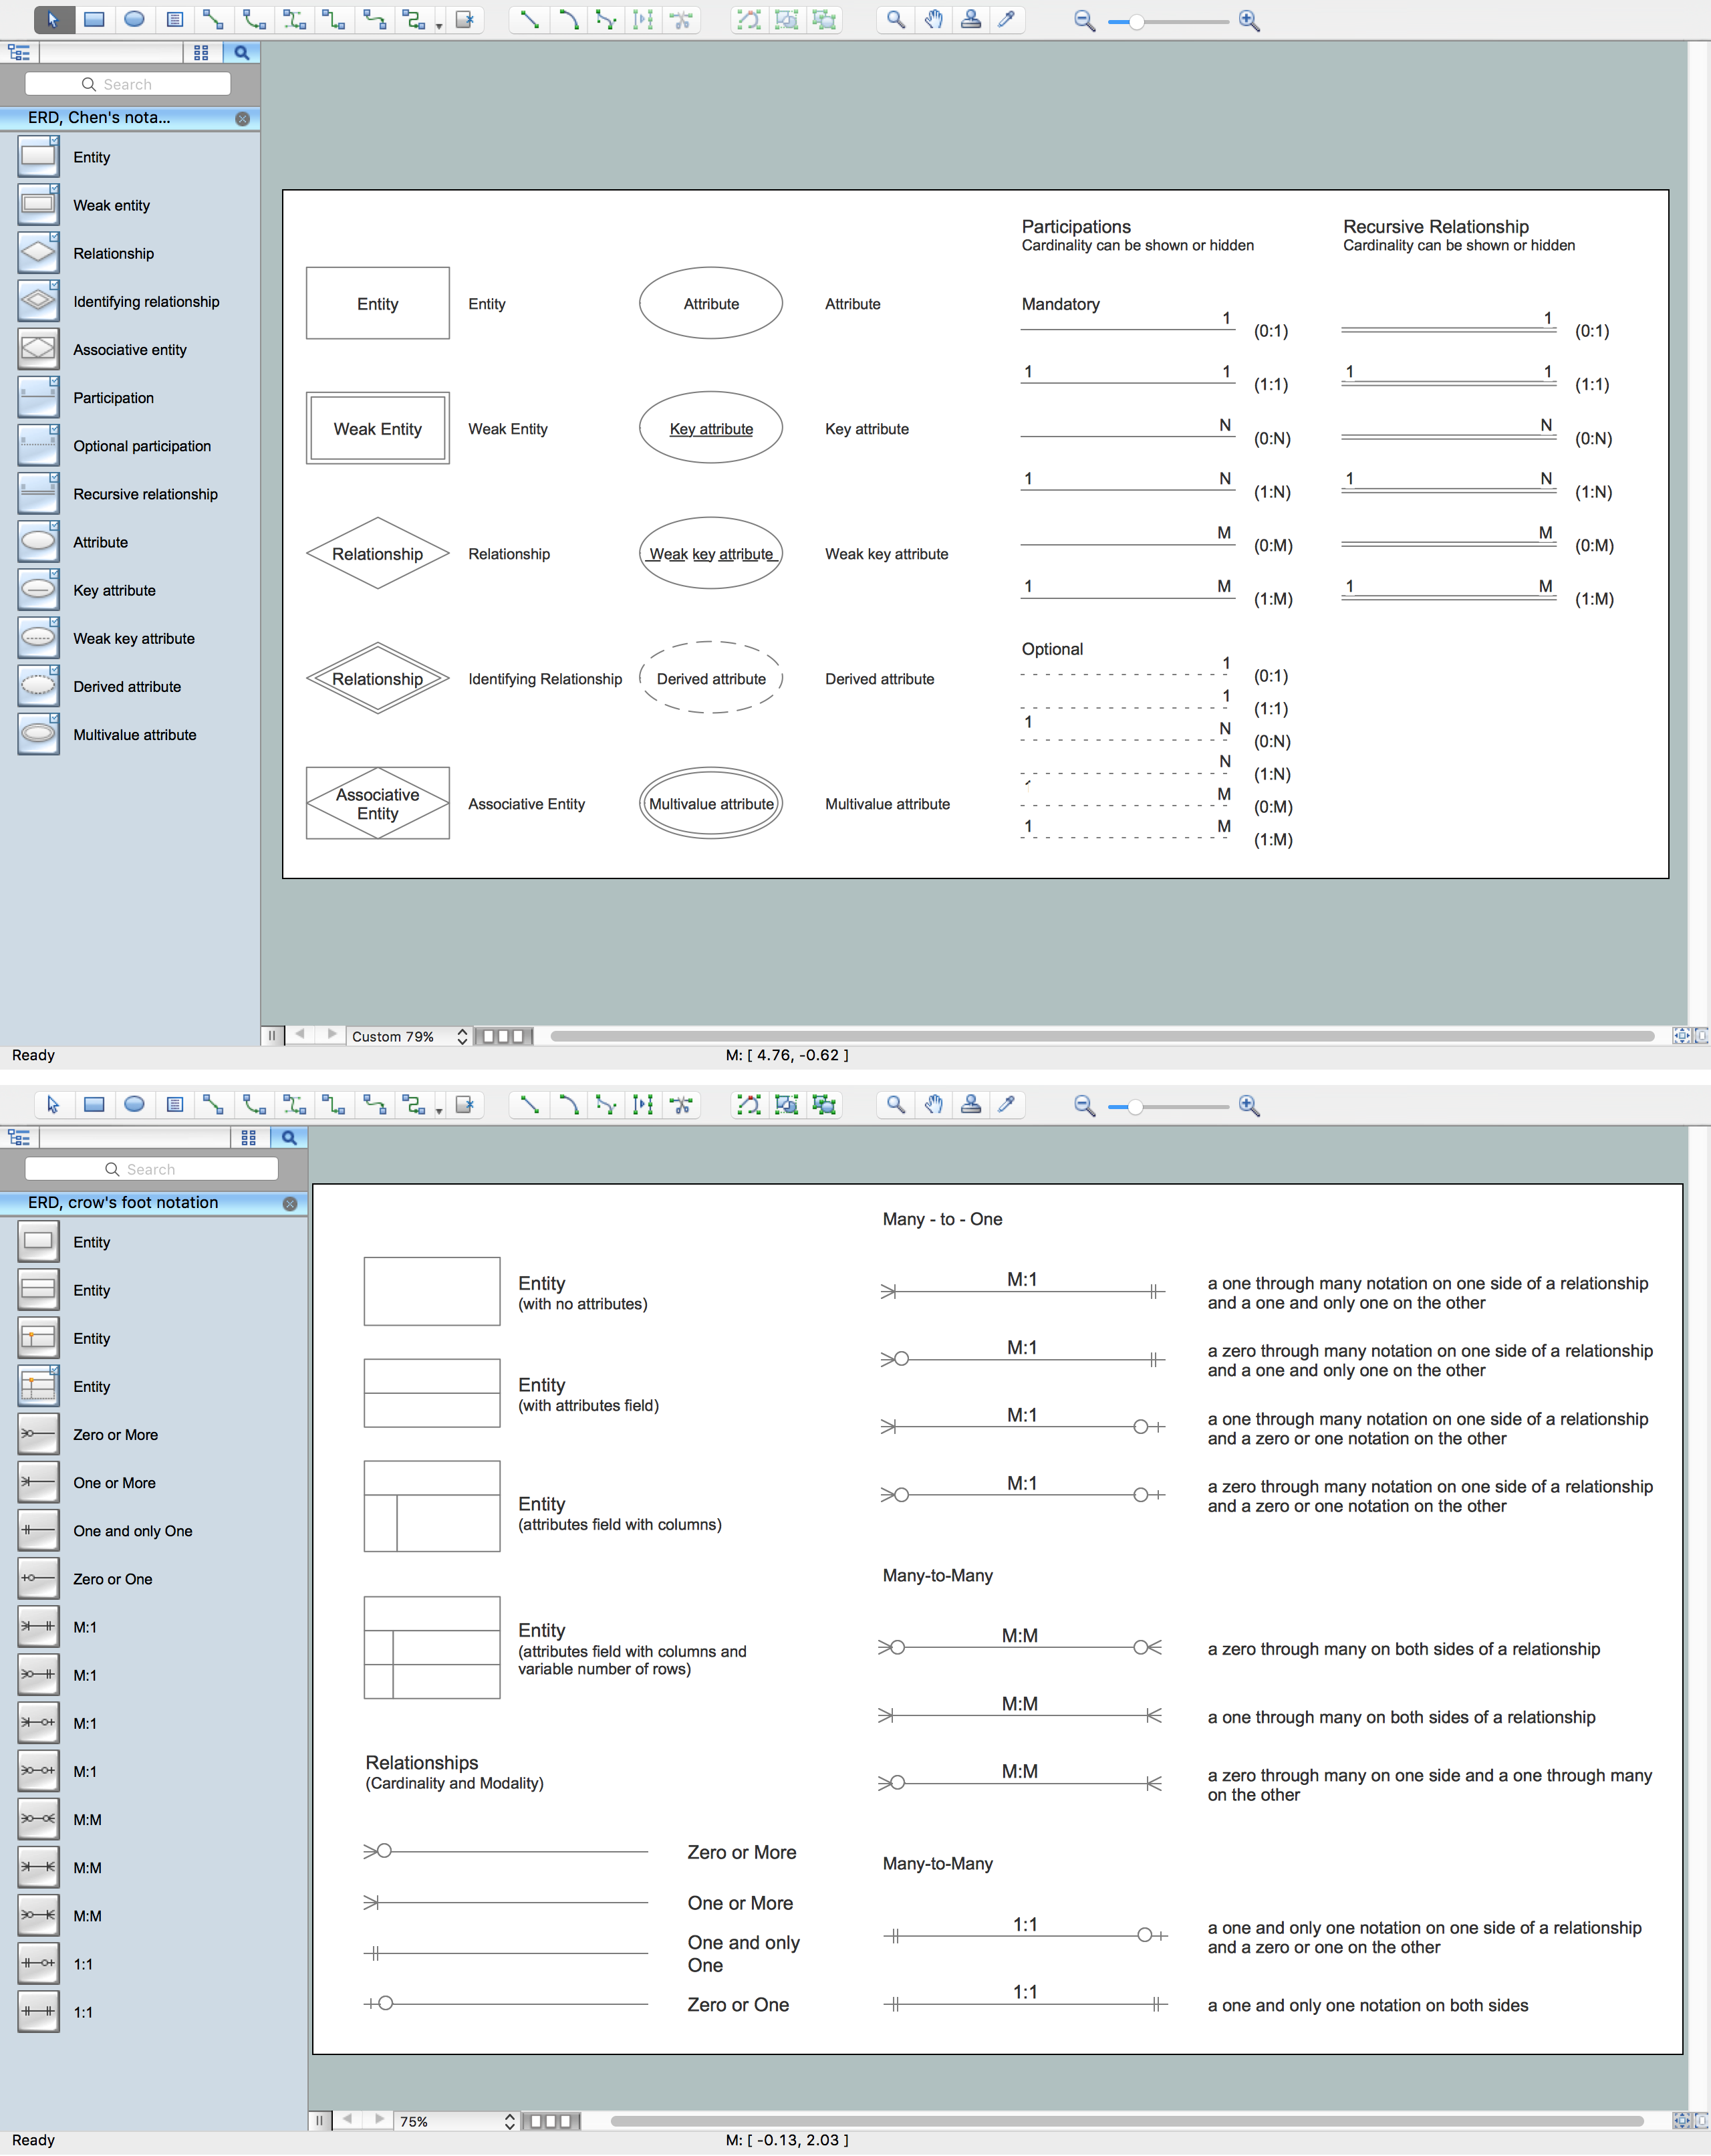
The ER diagram is constructed from the specific ERD graphic elements. There are used 2 types of ERD notations: Chen and Crow's Foot. A complete set of work flow shapes, notation & symbols for ERD, entity relationship stencils, included in Entity-Relationship Diagram (ERD) solution for ConceptDraw DIAGRAM software, makes drawing diagrams based on ERD notation as smooth as possible.IDEF9 Standard
Use Case Diagrams technology. An effective management of changes is significantly facilitated by way of definition and documenting of business-requirements.
 Cafe and Restaurant Floor Plans
Restaurants and cafes are popular places for recreation, relaxation, and are the scene for many impressions and memories, so their construction and design requires special attention. Restaurants must to be projected and constructed to be comfortable and e
- Organizational Structure | How to Draw an Organization Chart ...
- Organizational Structure | How to Draw an Organization Chart ...
- Examples of Flowcharts, Org Charts and More | Matrix Organization ...
- Organizational Structure | How to Draw an Organization Chart ...
- Examples of Flowcharts, Org Charts and More | How to Draw an ...
- How to Draw an Organization Chart | Matrix Organization Structure ...
- How to Draw an Organization Chart | Organizational chart - County ...
- Organizational Structure | How to Draw an Organization Chart ...
- Organizational Structure | Matrix Organization Structure | How to ...
- How to Draw an Organization Chart | Organizational Structure | How ...
- How to Draw an Organization Chart | 25 Typical Orgcharts ...
- Draw A Functional Organization Structure
- Organizational Structure | How to Draw an Organization Chart ...
- Organizational Structure | How to Draw an Organization Chart | Flow ...
- How to Draw an Organization Chart
- Organizational Structure Diagram Software | Organization Chart | 25 ...
- How to Draw an Organizational Chart Using ConceptDraw PRO ...
- How to Draw an Organization Chart | Functional Organizational ...
- Business Organization Structure Chart
- Organizational Structure | How to Draw an Organization Chart ...


