HelpDesk
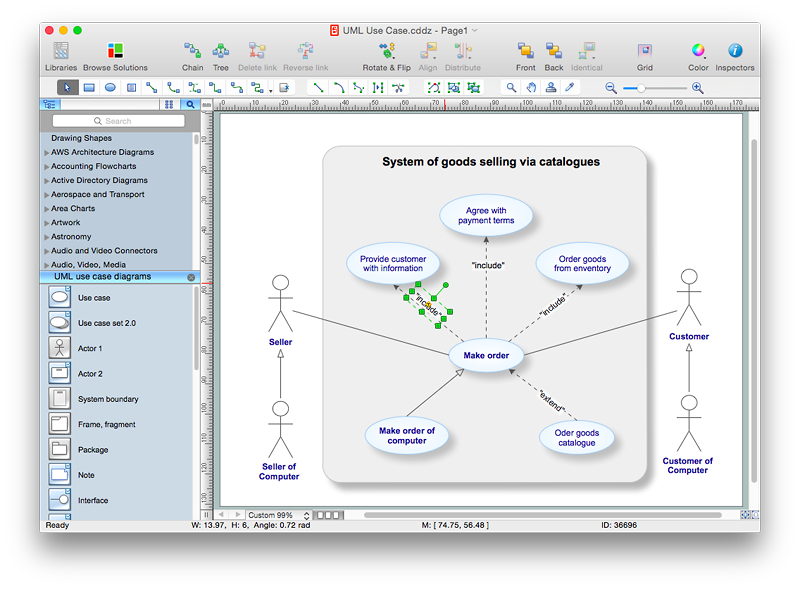
How to Add Text to a Connector in ConceptDraw PRO
The new ConceptDraw Arrows10 Technology is a powerful diagramming technique that powered the way business drawing created. ConceptDraw PRO gives you some tools for connecting shapes: Direct Connectors, Smart, Arc, Bezier, Curve and Round Connectors.Direct Connectors are direct lines from the point to the point. Smart , Arc, Bezier, Curve and Round Connectors are almost the same as Direct Connectors. However, they automatically move around other objects. You can use Chain, or Tree connection mode for connection of multiple objects with any type of connectors. ConceptDraw PRO allows you to add and move text on a connector the same way that you add and move text on other any object.
 Computer and Networks Area
The solutions from Computer and Networks Area of ConceptDraw Solution Park collect samples, templates and vector stencils libraries for drawing computer and network diagrams, schemes and technical drawings.
 Business Package for Management
Package intended for professional who designing and documenting business processes, preparing business reports, plan projects and manage projects, manage organizational changes, prepare operational instructions, supervising specific department of an organization, workout customer service processes and prepare trainings for customer service personal, carry out a variety of duties to organize business workflow.
 HR Flowcharts
Human resource management diagrams show recruitment models, the hiring process and human resource development of human resources.
 Fishbone Diagram
Fishbone Diagrams solution extends ConceptDraw PRO software with templates, samples and library of vector stencils for drawing the Ishikawa diagrams for cause and effect analysis.
 Project Management Area
Project Management area provides Toolbox solutions to support solving issues related to planning, tracking, milestones, events, resource usage, and other typical project management functions.
HelpDesk
How to Draw the Different Types of Pie Charts
Using the Pie Chart, you can visually estimate the relative contribution that different data categories contribute to a whole value. The pie chart displays the statistics in a visual format. The main use of pie charts to show comparisons. The larger piece of the pie, the more the value of this value compared to the rest. Various applications of pie charts can be found in business and education. For business, pie charts can be used to compare the success or failure of the goods or services. They may also be used to display the business market share.
 Network Layout Floor Plans
Network Layout Floor Plans solution extends ConceptDraw PRO software functionality with powerful tools for quick and efficient documentation the network equipment and displaying its location on the professionally designed Network Layout Floor Plans. Never before creation of Network Layout Floor Plans, Network Communication Plans, Network Topologies Plans and Network Topology Maps was not so easy, convenient and fast as with predesigned templates, samples, examples and comprehensive set of vector design elements included to the Network Layout Floor Plans solution. All listed types of plans will be a good support for the future correct cabling and installation of network equipment.
- Draw And Label The Circle Of Management
- Draw And Label The Computer Processing Circle
- Draw And Label The Communicators Period Pyramid
- Draw And Lable The Different Life Stages Or Circle
- Draw And Label The Diagram Of An Information Triangle
- Glycolysis overview | Biology | Biology Drawing | Draw And Label ...
- Draw And Label The Different Life Stages Or Circle
- Draw Water Cycle And Label
- Draw And Label A Product Life Cycle Diagram
- Chart Of Management Information System With Diagram
- Draw And Label Home Structure And Identify Components To A ...
- Draw The Organisation Of Chart Of Any Academic Label It Fully
- Area Chart Of Management And Draw And Label
- Draw The Organization Chart Of Any Academic Library And Label It
- Purchasing Circle Drawing
- Image Of Balance Diet Chart For Drawing With Label
- Draw And Label The Steps Of Logical Procedures For Selection
- Biology | Nature | Plumbing and Piping Plans | Draw Water Circle In ...
- Draw And Label A Home Network Structure Identifying All
- Process Flowchart | Draw A Well Labelled Diagram Of Water Cycle

