HelpDesk
Event-driven Process Chain (EPC) Diagram Software
An EPC diagram is a type of flowchart used in business process analysis. It shows different business processes through various work flows. The workflows are shown as processes and events that are related to different executes and tasks that allow business workflow to be completed. An EPC diagram shows different business processes through various workflows. The workflows are seen as functions and events that are connected by different teams or people, as well as tasks that allow business processes to be executed. The best thing about this type of enterprise modelling is that creating an EPC diagram is quick and simple as long as you have the proper tool. One of the main usages of the EPC diagrams is in the modelling, analyzing and re-engineering of business processes. With the use of the flowchart, businesses are able to see inefficiencies in the processes and modify to make them more productive. Event-driven process chain diagrams are also used to configure an enterprise resource plaHelpDesk
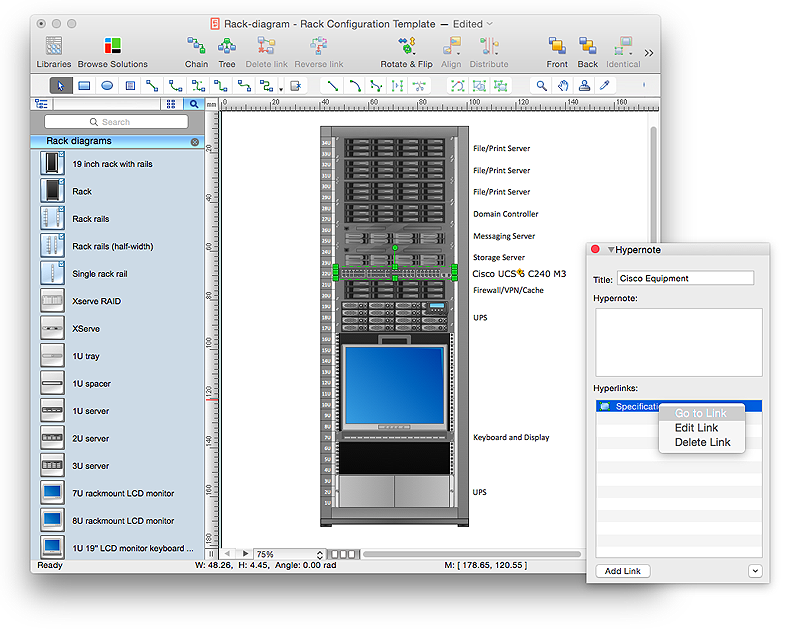
How to Create a Rack Diagram in ConceptDraw PRO
A Rack Diagram represents the rack mounting of network and computer equipment that is installed as a server. Rack diagrams are used by system administrators and network architectors when making a decision regarding the purchase of network equipment. It is used to show how a particular server configuration can be composed, without making its physical installation. ConceptDraw PRO enhanced with the Rack Diagrams Solution can be successfully used for making various rack diagrams. It's important that the solution used to create a rack diagram contains templates that stick to industry standards, and supplies a big selection of device icons to cover multiple types of equipment for a number of network configurations.Control and Information Architecture Diagrams (CIAD) with ConceptDraw PRO
One of the three main constituents of any enterprise is the Control and Information Architecture. The rest two are Production facilities and People and Organization.- Draw And Label The Diagram Of An Information Triangle
- 4 Level pyramid model diagram - Information systems types | 5 Level ...
- Draw And Label A Product Life Cycle Diagram
- Information Wisdom Diagram
- Pyramid Diagram | Process Flowchart | Pyramid Diagram | Draw ...
- Draw A Well Labelled Diagram Of A Flow Chart
- Management Information System Triangle Diagram
- Information Knowledge Wisdom Pyramid
- DFD Library System | Data Flow Diagram Symbols. DFD Library ...
- Well Labelled Diagram Of Product Life Cycle
- Draw A Triangle With Five Levels
- Chart Of Management Information System With Diagram
- Telecommunication Network Diagrams | Design elements ...
- Process Flowchart | ConceptDraw Solution Park | Databases Access ...
- Pyramid Diagram | Basic Flowchart Symbols and Meaning | Pyramid ...
- Draw Up A Hierarchy Of Information Technology Department
- Draw Up A Hierarchy Of The Information System Department
- Data Flow Diagram
- Entity Relationship Diagram Symbols and Meaning ERD Symbols ...
- Use the Best FlowChart Tool for the Job | Draw Flowcharts with ...


