Flowchart Components
The ConceptDraw Flowchart component includes a set of samples and templates. This geathered as flowchart maker toolbox which focused on drawing flowcharts of any industry standards.How to Draw a Good Diagram of a Business Workflow?
To draw a good diagram of a business workflow you should have a ready-to-use set of pre-designed objects you may drag-and-drop to your document focusing on the workflow structure and meaning, not drawing tools. ConceptDraw DIAGRAM with Workflow Diagrams solution provides complete set of design element you may use to draw a good diagram of a business workflow.Process Flowchart
The main reason of using Process Flowchart or PFD is to show relations between major parts of the system. Process Flowcharts are used in process engineering and chemical industry where there is a requirement of depicting relationships between major components only and not include minor parts. Process Flowcharts for single unit or multiple units differ in their structure and implementation. ConceptDraw DIAGRAM is Professional business process mapping software for making Process flowcharts, Process flow diagram, Workflow diagram, flowcharts and technical illustrations for business documents and also comprehensive visio for mac application. Easier define and document basic work and data flows, financial, production and quality management processes to increase efficiency of your business with ConcepDraw DIAGRAM. Business process mapping software with Flowchart Maker ConceptDraw DIAGRAM includes extensive drawing tools, rich examples and templates, process flowchart symbols and shape libraries, smart connectors that allow you create the flowcharts of complex processes, process flow diagrams, procedures and information exchange. Process Flowchart Solution is project management workflow tools which is part ConceptDraw Project marketing project management software. Drawing charts, diagrams, and network layouts has long been the monopoly of Microsoft Visio, making Mac users to struggle when needing such visio alternative like visio for mac, it requires only to view features, make a minor edit to, or print a diagram or chart. Thankfully to MS Visio alternative like ConceptDraw DIAGRAM software, this is cross-platform charting and business process management tool, now visio alternative for making sort of visio diagram is not a problem anymore however many people still name it business process visio tools.
Diagramming Software for Design UML Component Diagrams
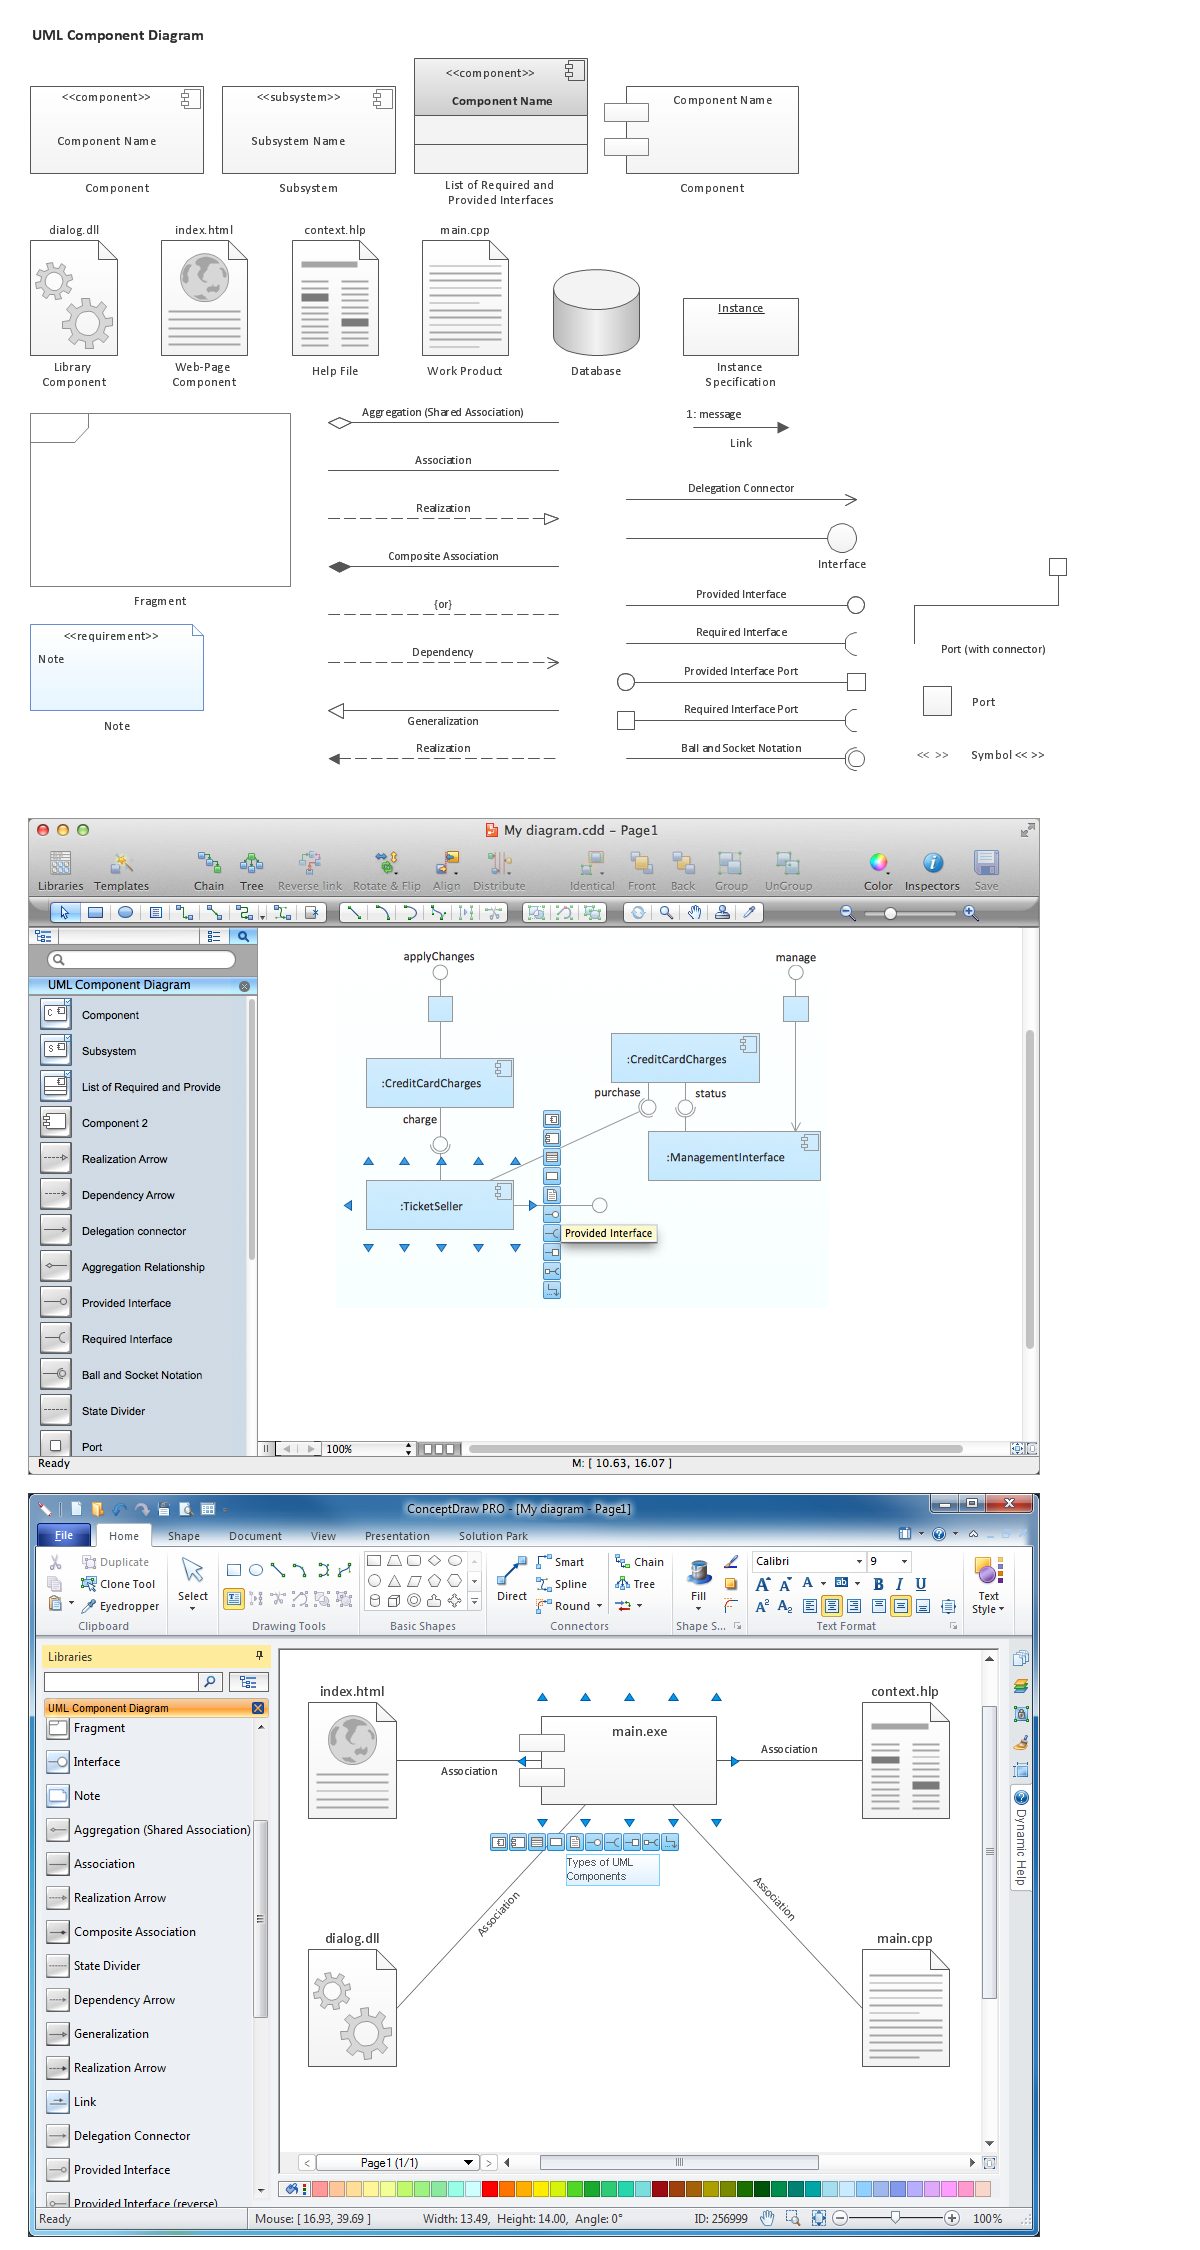
UML Component Diagram illustrate how components are wired together to larger components and software systems that shows the structure of arbitrarily complex systems. ConceptDraw Rapid UML solution delivers libraries contain pre-designed objects fit UML notation, and ready to draw professional UML Component Diagram.
UML Component Diagram
UML Component Diagrams are used to illustrate the structure of arbitrarily complex systems and illustrates the service consumer - service provider relationship between components.
Software for Drawing EPC Diagrams
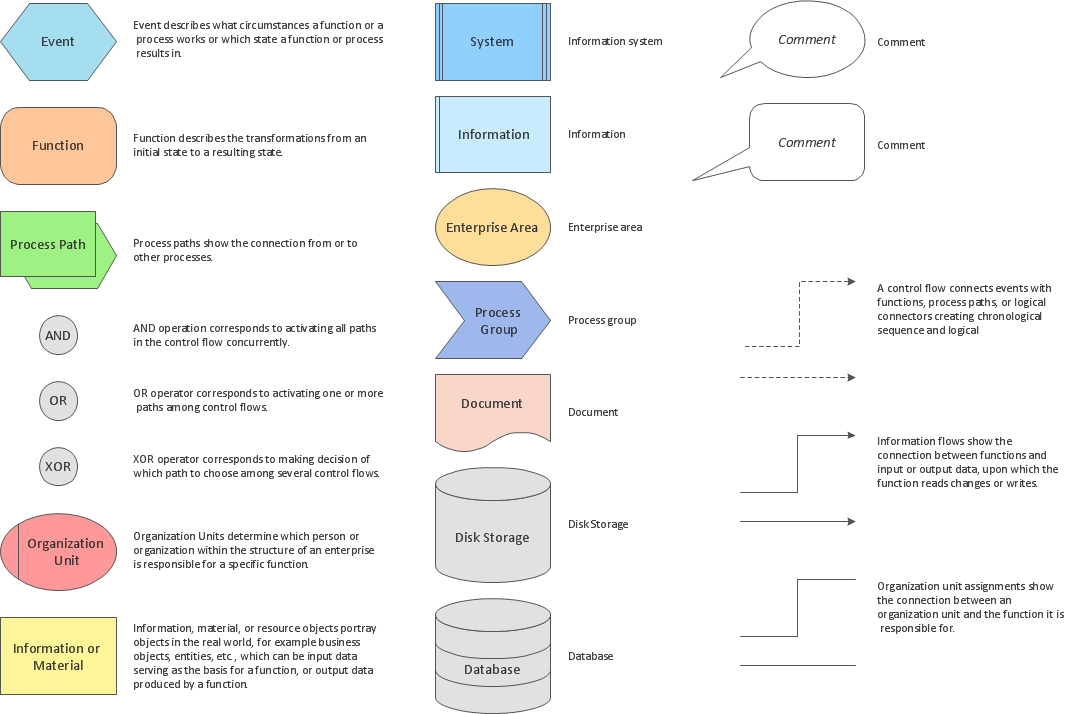
Event-Driven Process chain Diagrams for improvement throughout an organisation. ConceptDraw DIAGRAM - software that reduces the time needed to create a business process model.Business Process Elements: Swimlanes
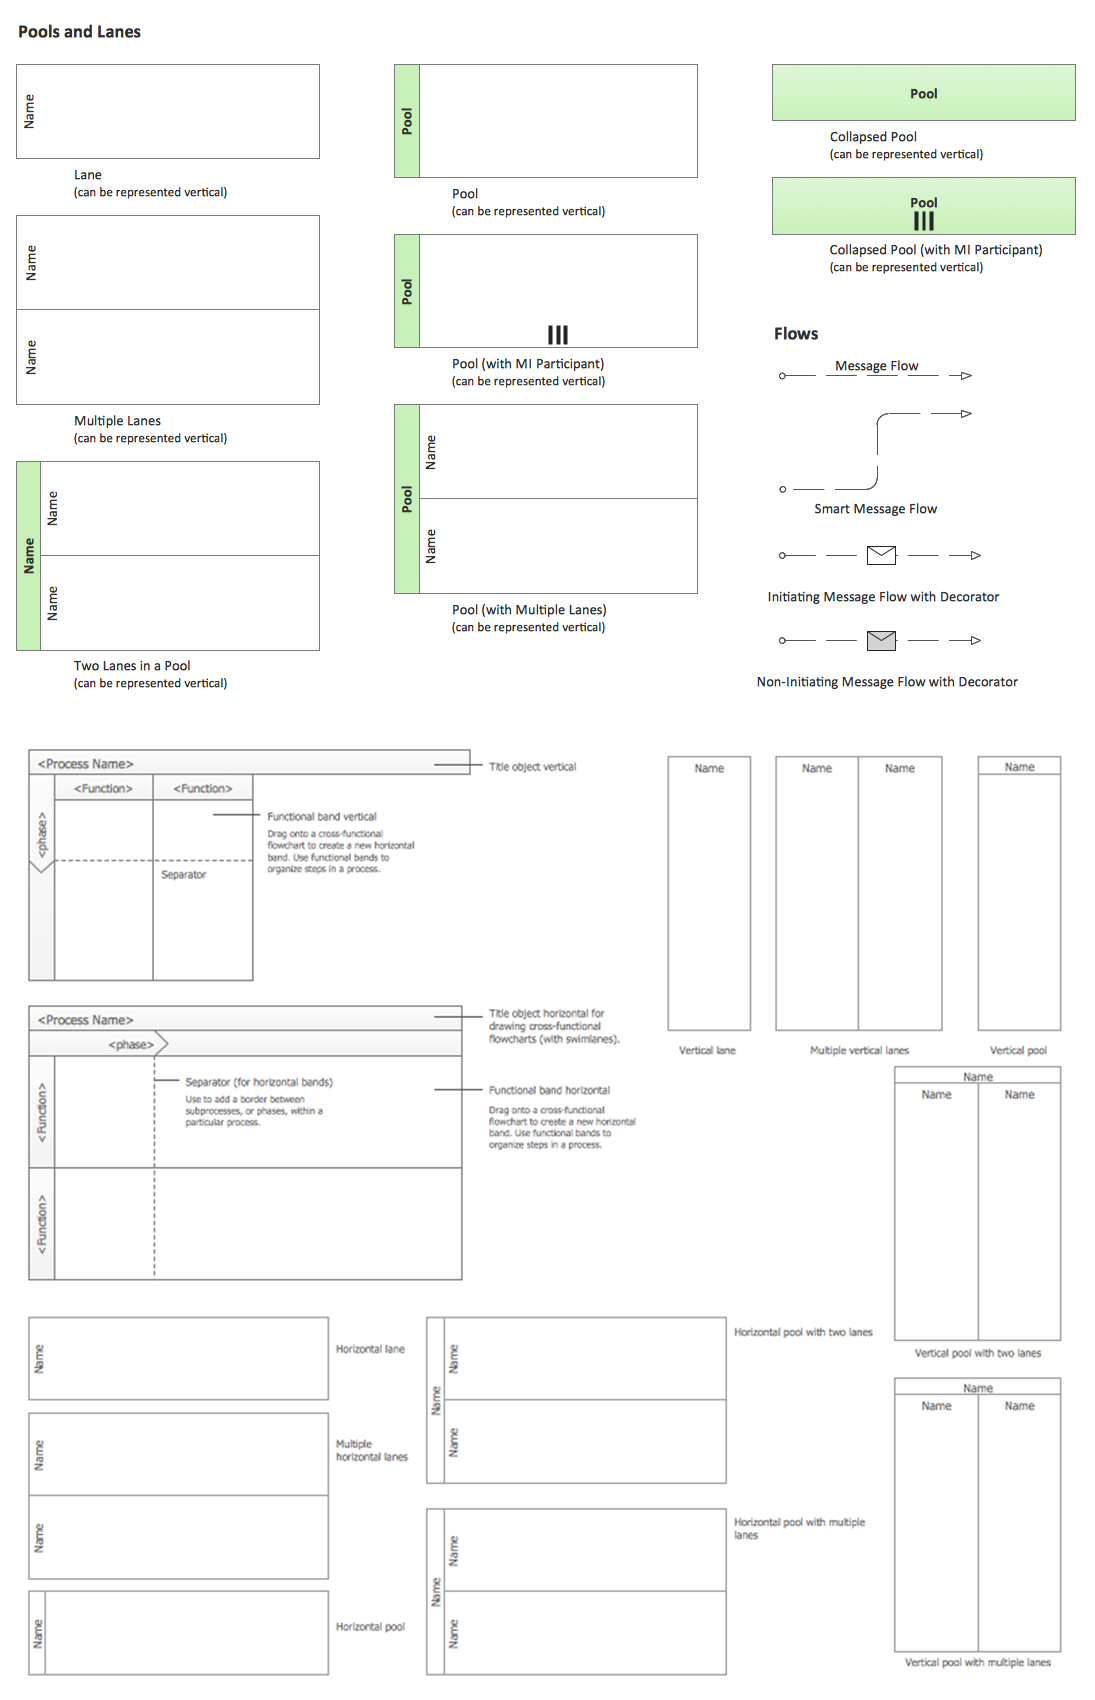
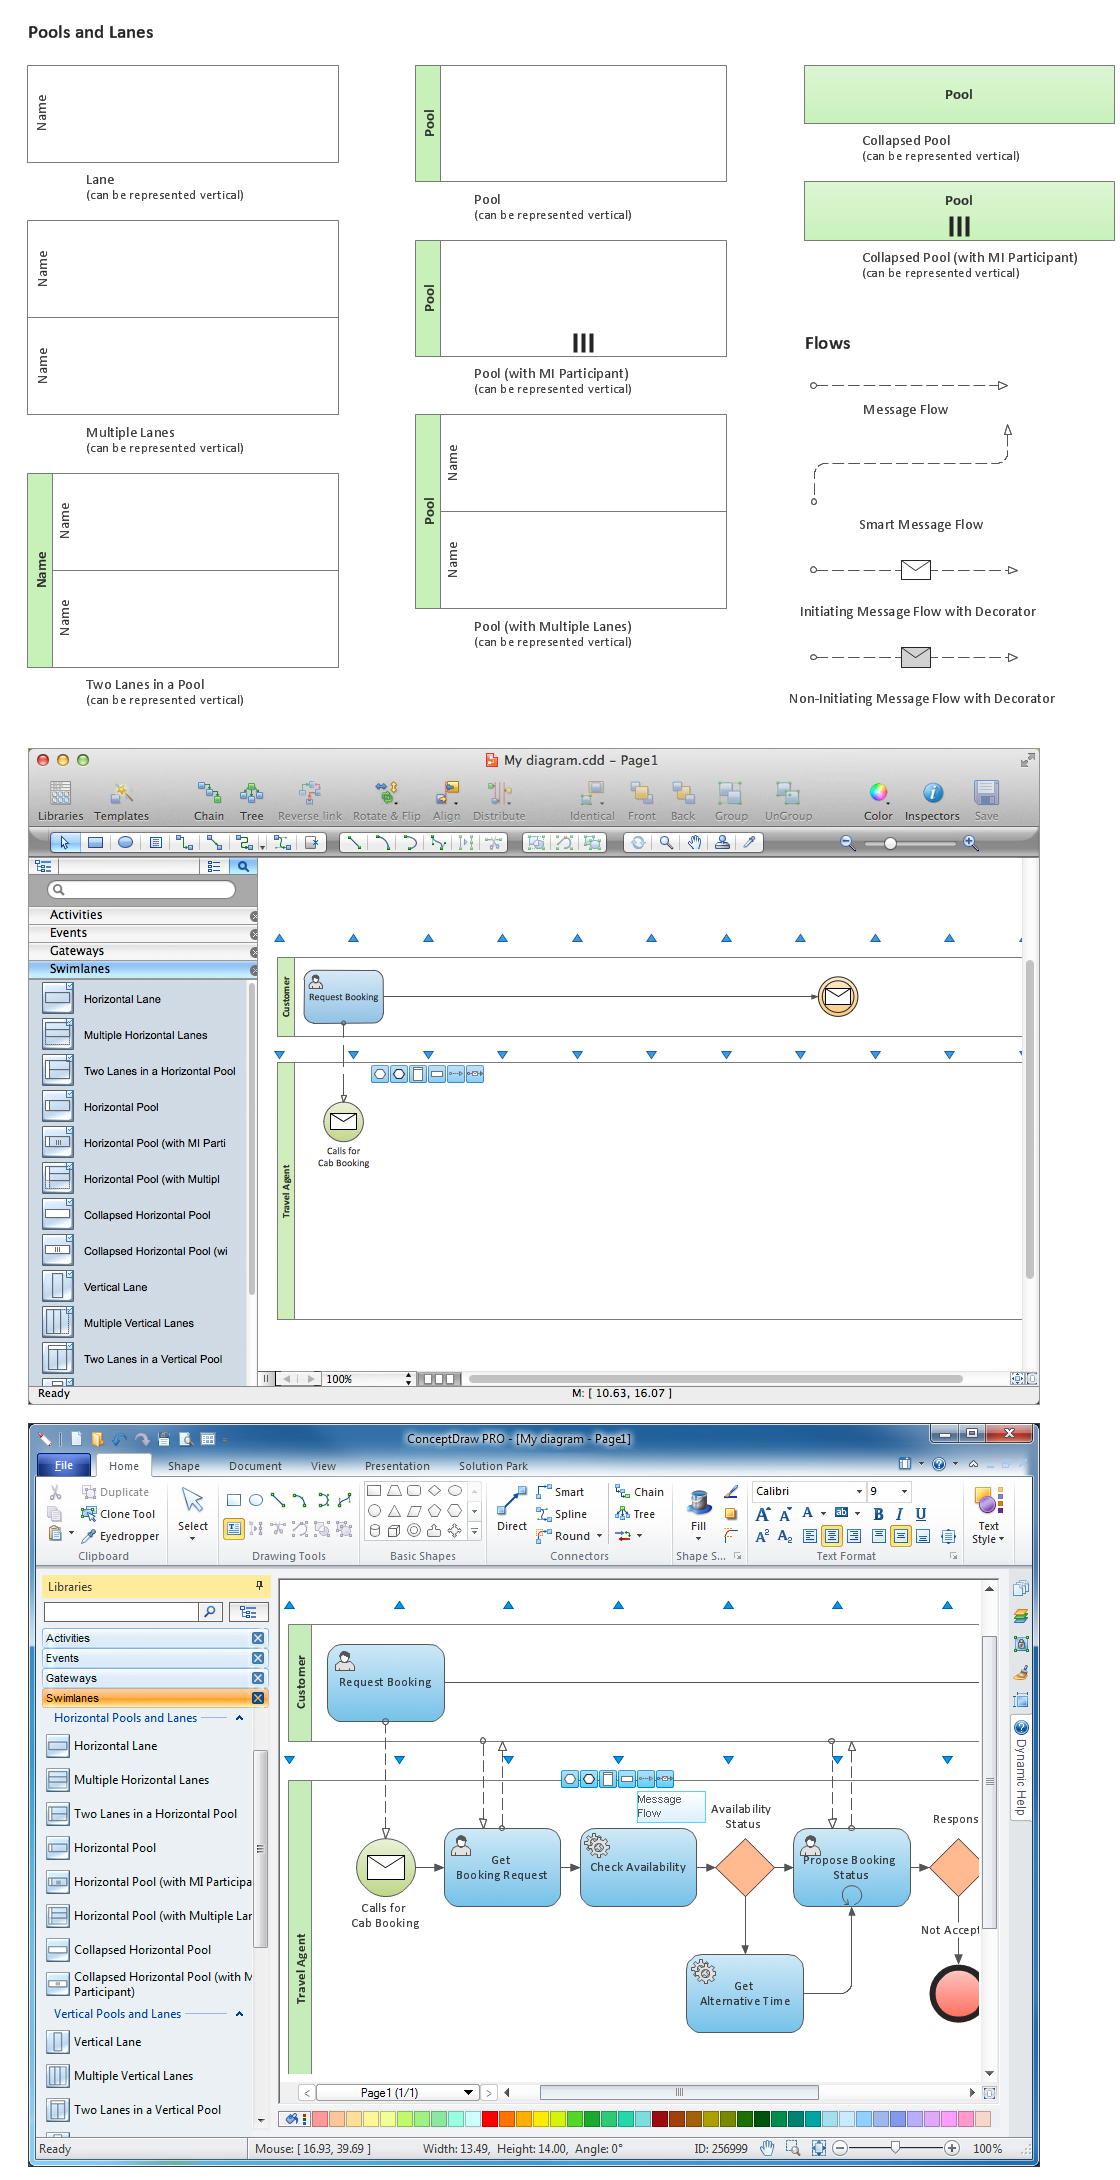
ConceptDraw has 142 vector stencils in the 8 libraries that helps you to start using software for designing own Business Process Diagrams. Use Swimlanes library with 20 objects from BPMN.
The Best Business Process Modeling Software
ConceptDraw DIAGRAM is a best business processes modeling software for graphical documenting processes of the company. ConceptDraw has 142 vector stencils in the 8 libraries that helps you to start using Diagramming Software for designing own Business Process Diagrams.
Diagramming Software for Design Business Process Diagrams
Swimlanes are a visual mechanism of organizing and categorizing activities, in BPMN consist of two types: Pool, Lane. Use ConceptDraw Swimlanes library with 20 objects from BPMN.
Business - Design Elements
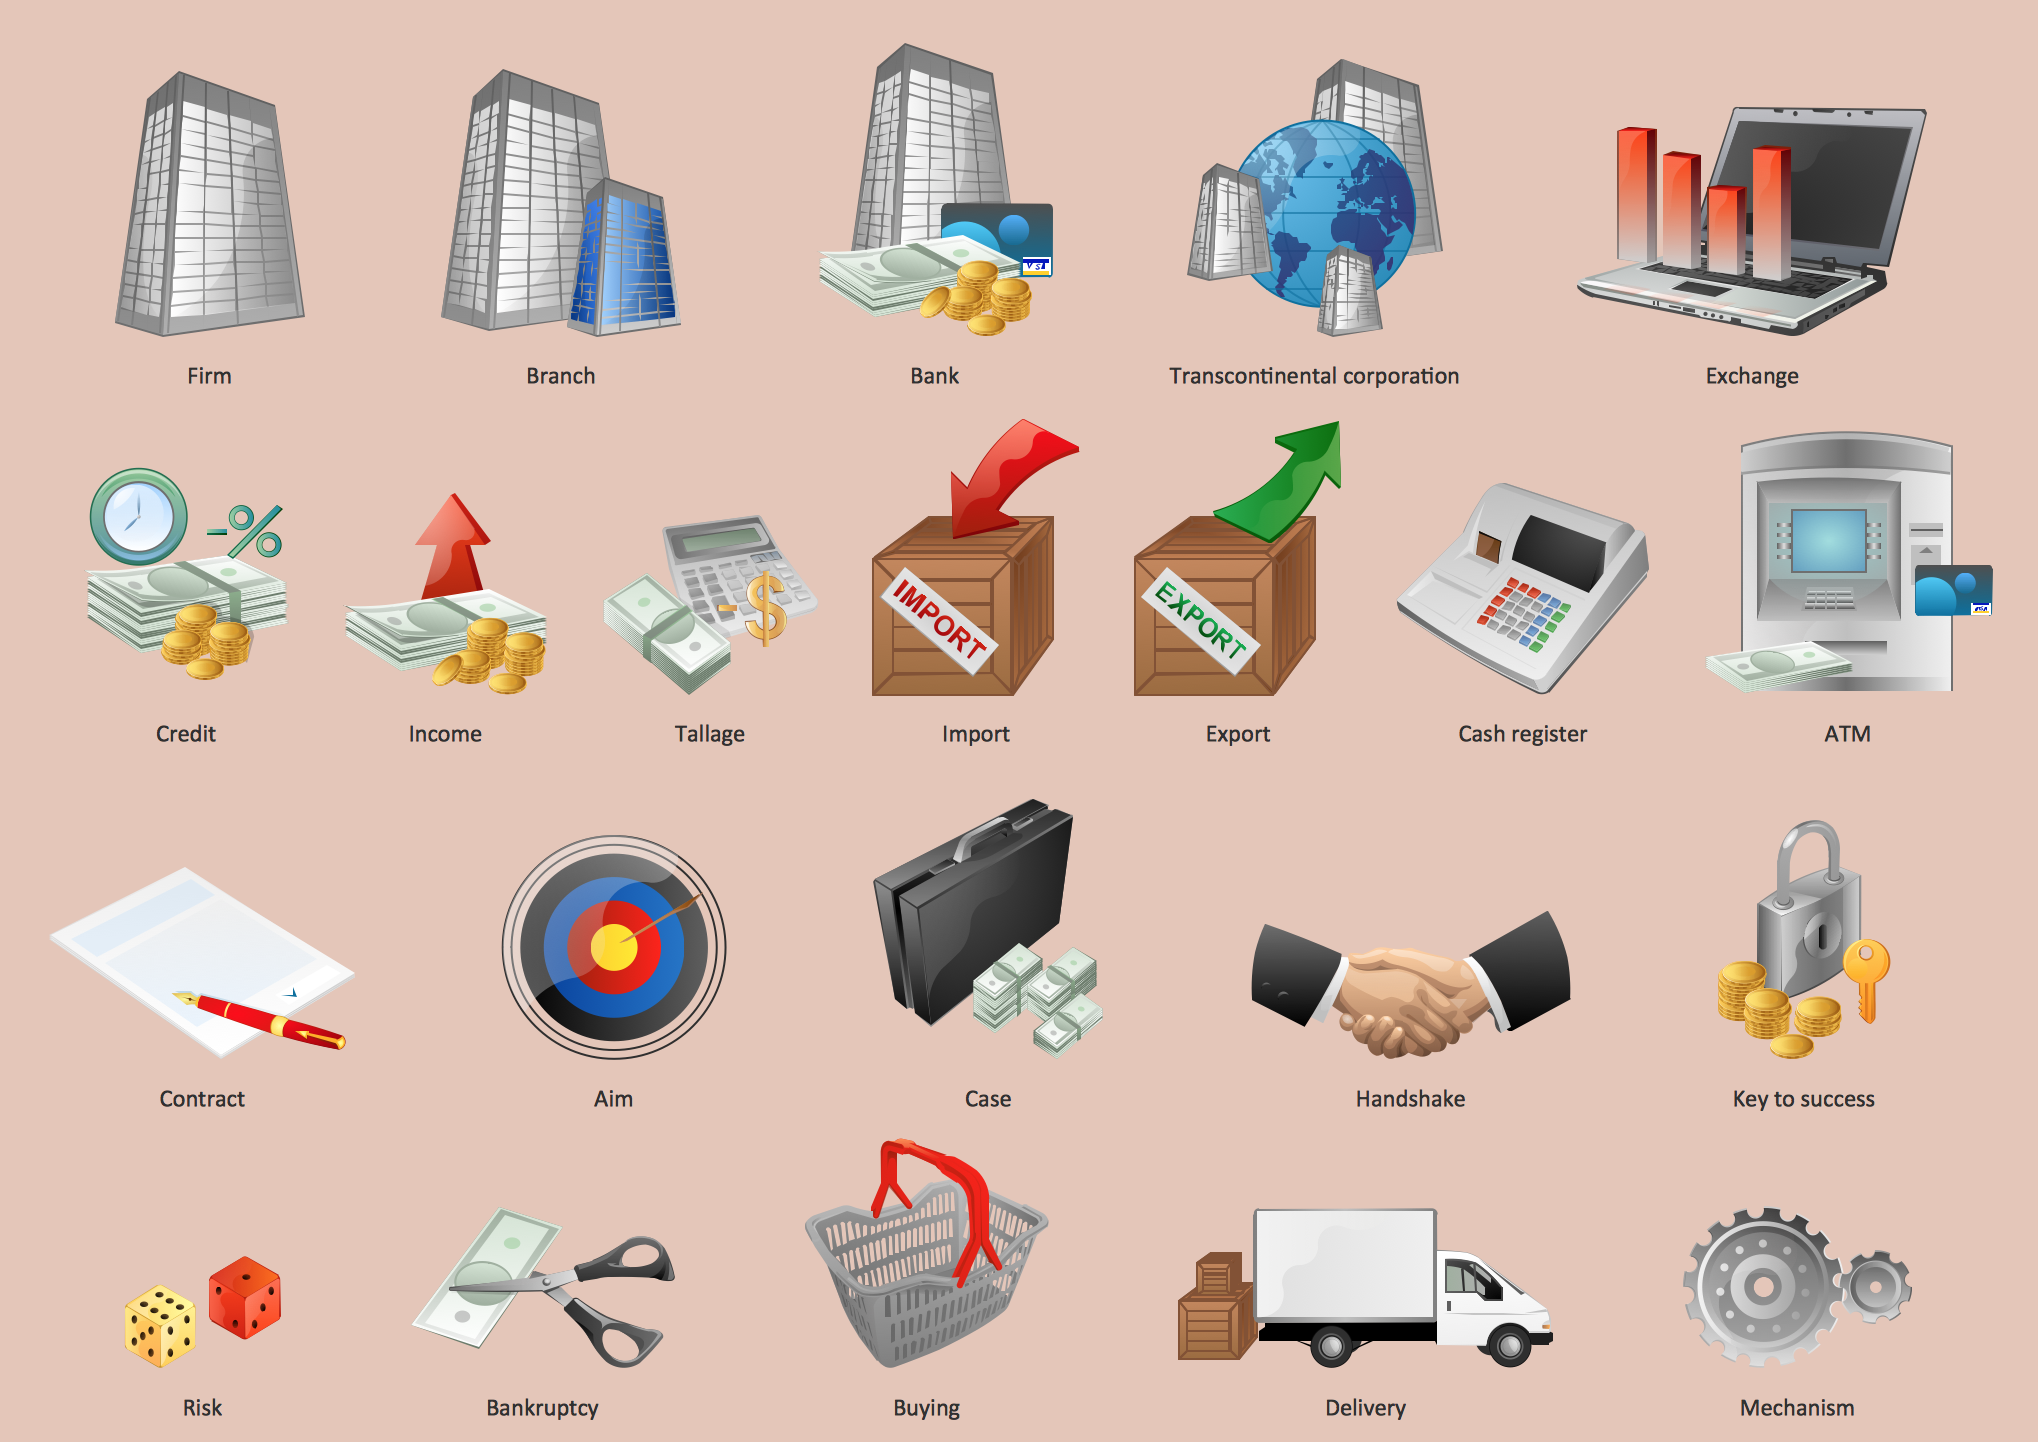
Choose which of business design elements you love best. Design your own style with Business and Finance Solutions from ConceptDraw DIAGRAM. We created a full set of elements, business samples, templates and libraries with vector clip art for drawing the Business Illustrations. Mark your report or presentation, pay an attention of audience on your drawings with vector business design elements.Interaction Overview Diagram
UML Interaction Overview Diagram schematically shows a control flow with nodes and a sequence of activities that can contain interaction or sequence diagrams.
UML Deployment Diagram
UML Deployment Diagram depicts the physical deployment of artifacts on nodes (nodes are the existing hardware components, artifacts are the software components running on each node); and how the different pieces are connected. Use ConceptDraw DIAGRAM with UML deployment diagram templates, samples and stencil library from Rapid UML solution to model the physical deployment of artifacts on nodes of your software system.
Flow Chart Creator
ConceptDraw DIAGRAM is a flowchart design software. There are large collections of professional flowchart symbols for process flow diagrams, standard flowchart symbols and colored basic flowchart symbols. Built-in examples and video lessons allow users to get started immediately and do drawing of virtually any type of flowchart or process flow diagramsHow to Draw Business Process Diagrams with RapidDraw Interface
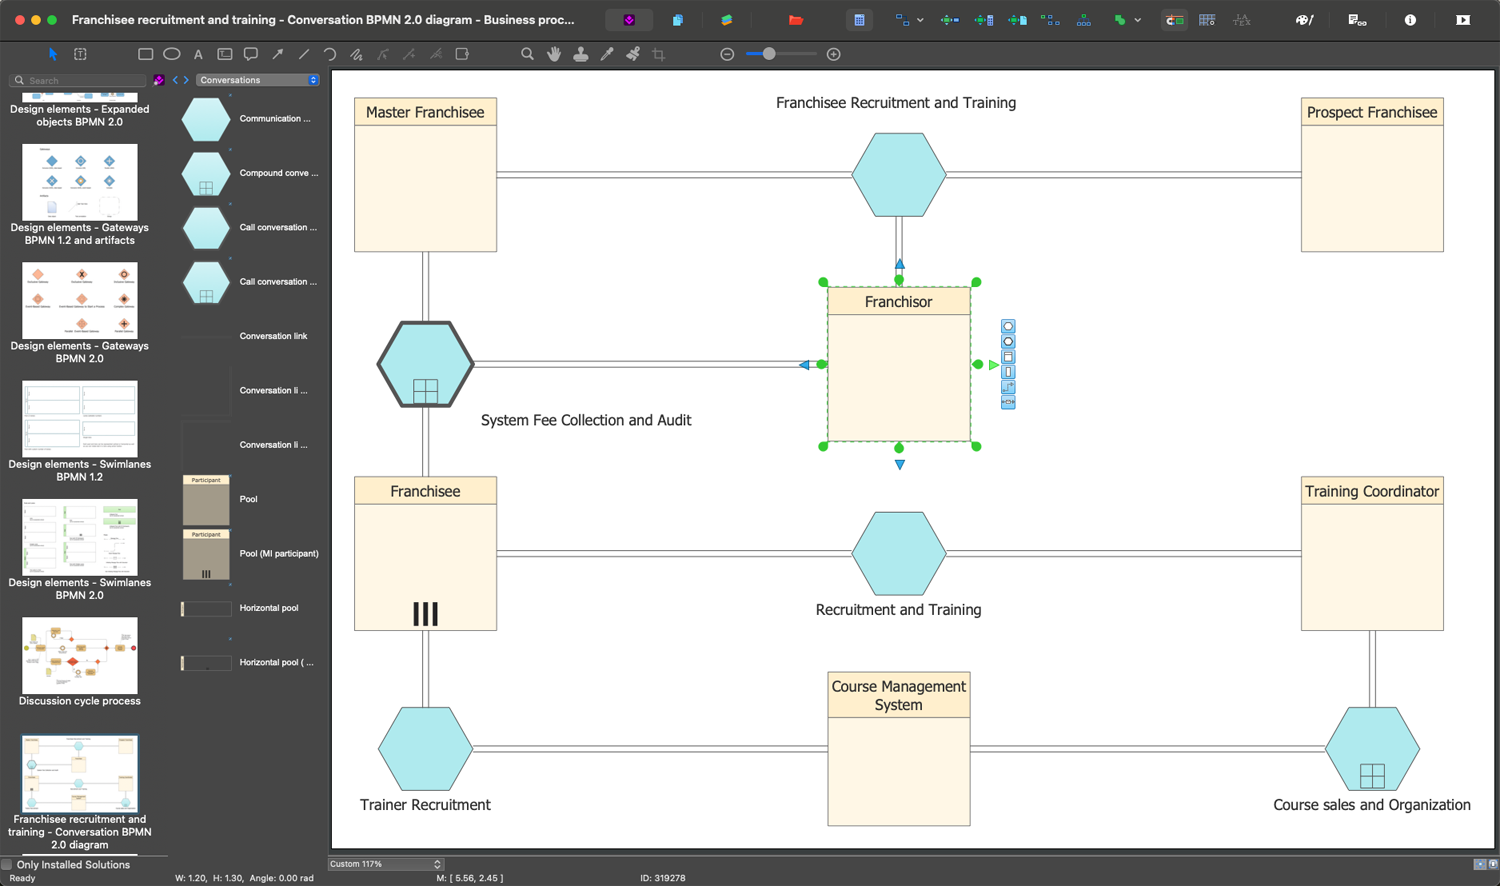
Business Process Modeling Notation (BPMN) is a set of standard symbols that allow you to create a graphical view of a business process. The symbols were developed to help users develop standard, unified structure of processes, and any messages shared between these processes.Business Process Elements: Activities
Create professional business process diagrams using ConceptDraw Activities library with 34 objects from BPMN.
UML Deployment Diagram. Diagramming Software for Design UML Diagrams
Deployment diagram describes the hardware used in system implementations and the execution environments and artifacts deployed on the hardware.
An Event-driven Process Chain (EPC) - flowchart used for business process modelling
Event-Driven Process Chain flowcharts for improvement throughout an organisation. ConceptDraw DIAGRAM is a business process mapping software for making EPC flowcharts to provide business process modelling. Its excellent business process improvement tools.Technical Flow Chart
Flow chart is a diagrammatic representation of an algorithm and essential part of planning the system. Flow charts are widely used in technical analysis and programming for easy writing programs and explaining them to others. So, one of the most popular type of flow charts is Technical Flow Chart. Technical Flow Chart can be drawn by pencil on the paper, but it will be easier to use for designing a special software. ConceptDraw DIAGRAM diagramming and vector drawing software extended with Flowcharts Solution from the "Diagrams" Area of ConceptDraw Solution Park will be useful for this goal.HelpDesk
How to Draw a Divided Bar Chart
A divided bar graph is a rectangle divided into smaller rectangles along its length in proportion to the data. Segments in a divided bar represent a set of quantities according to the different proportion of the total amount. A divided bar diagram is created using rectangular bars to depict proportionally the size of each category. The bars in a divided bar graph can be vertical or horizontal. The size of each rectangle displays the part that each category represents. The value of the exact size of the whole must be known because each section of the bar displays a piece of that value. A divided bar diagram is rather similar to a sector diagram in that the bar shows the entire data amount and the bar is divided into several parts to represent the proportional size of each category. ConceptDraw DIAGRAM in conjunction with Divided Bar Diagrams solution provides tools to create stylish divided bar charts for your presentations.Local area network (LAN). Computer and Network Examples
Local Area Network (LAN) is a network which consists of computers and peripheral devices connected each other and to the local domain server, and covers a little territory or small number of buildings, such as home, school, laboratory, office, etc. LAN serves for few hundreds of users. It includes many cables and wires, and demands to design previously a Network diagram. All local area network devices can use the shared printers and disk storage. ConceptDraw DIAGRAM is a perfect network diagramming software with examples of LAN Diagrams, templates and predesigned vector objects. ConceptDraw DIAGRAM is the ideal choice for network engineers and network designers who need to draw fast and easy Local Area Network Diagrams, for IT specialists, developers and other IT professionals which need to visualize the communication schemes of LAN and visually document the LAN's physical structure and arrangement in houses, offices and other buildings. Ready-to-use vector objects from Computer Network Diagrams solution will help you design LAN diagrams in minutes.
- Draw The Components Of Environment
- How to Draw Business Process Diagrams with RapidDraw Interface ...
- Draw A Flowchart Of Component Of Environment
- Draw A Diagram For Business Component
- Flowchart Components | Business Process Modeling Notation ...
- Draw A Diagram Of The Major Components Of Environment
- UML Component Diagram | Process Flowchart | UML Deployment ...
- Draw Flow Chart Representing The Components Of Computer System
- Design elements - Swimlanes BPMN1.2 | Business process BPMN ...
- Draw A Component Diagram For Library Information System
- Design elements - Workflow diagram | Design elements - Scrum ...
- Process Flowchart | Basic Flowchart Symbols and Meaning ...
- Flowchart Components | Example of Flowchart Diagram | Watercraft ...
- Swim Lane Flowchart Symbols | Swim Lane Diagrams | Swim Lanes ...
- UML Deployment Diagram. Design Elements | Business Process ...
- Process Flowchart | JSD - Jackson system development | Systems ...
- Process Flow Diagram Symbols | How to Create a Mechanical ...
- Professional Diagram and Flowchart Software | Components of ER ...
- Business Process Elements : Activities | UML Business Process ...
- How to Add a Block Diagram to a PowerPoint Presentation | How to ...


