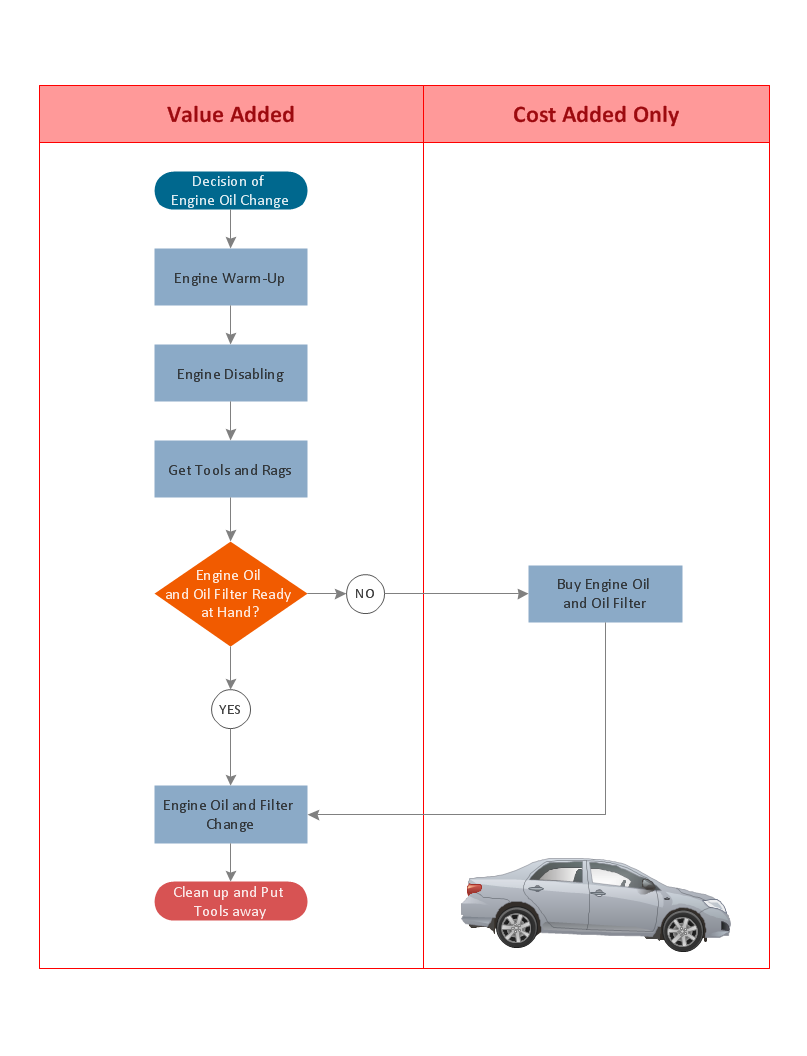
How to Draw a Good Diagram of a Business Workflow?
To draw a good diagram of a business workflow you should have a ready-to-use set of pre-designed objects you may drag-and-drop to your document focusing on the workflow structure and meaning, not drawing tools. ConceptDraw DIAGRAM with Workflow Diagrams solution provides complete set of design element you may use to draw a good diagram of a business workflow.Fishbone Software Tools for Design Element
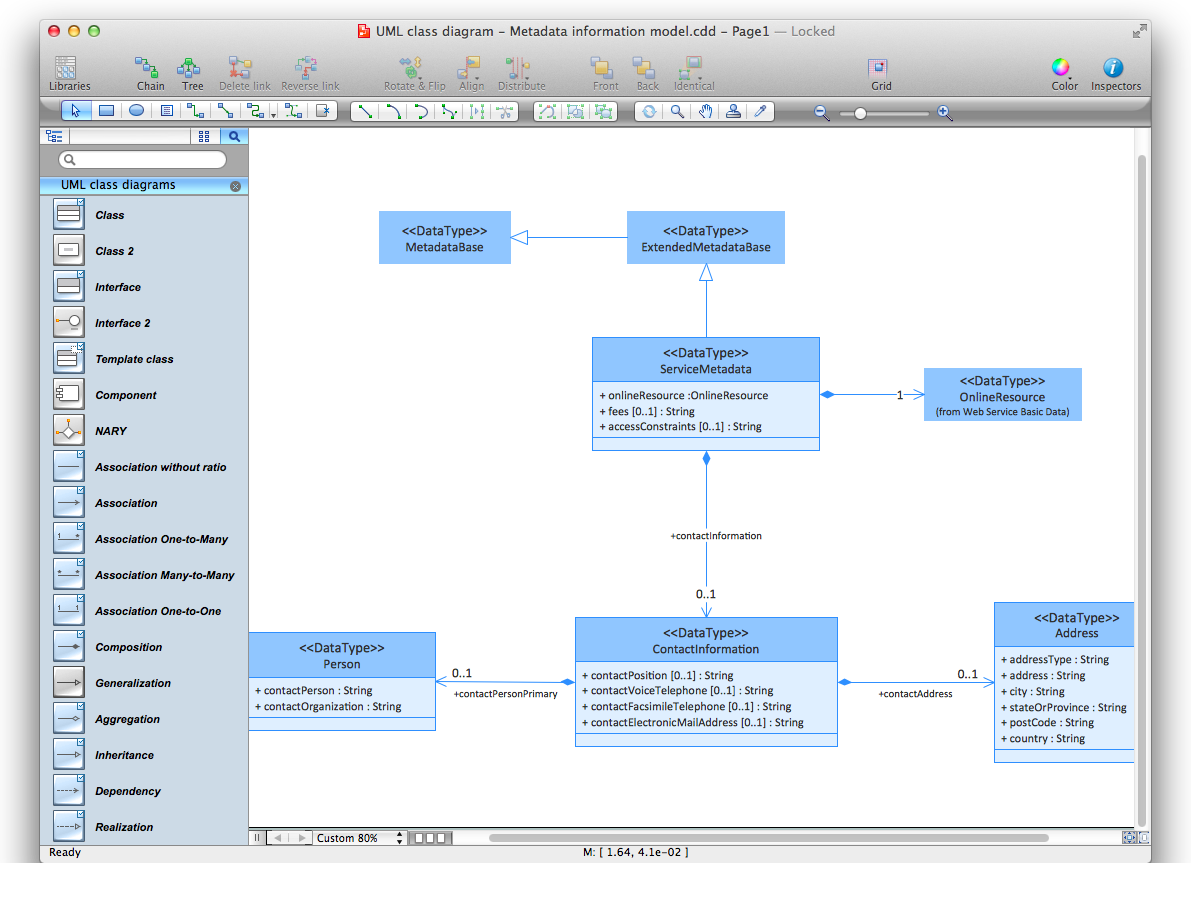
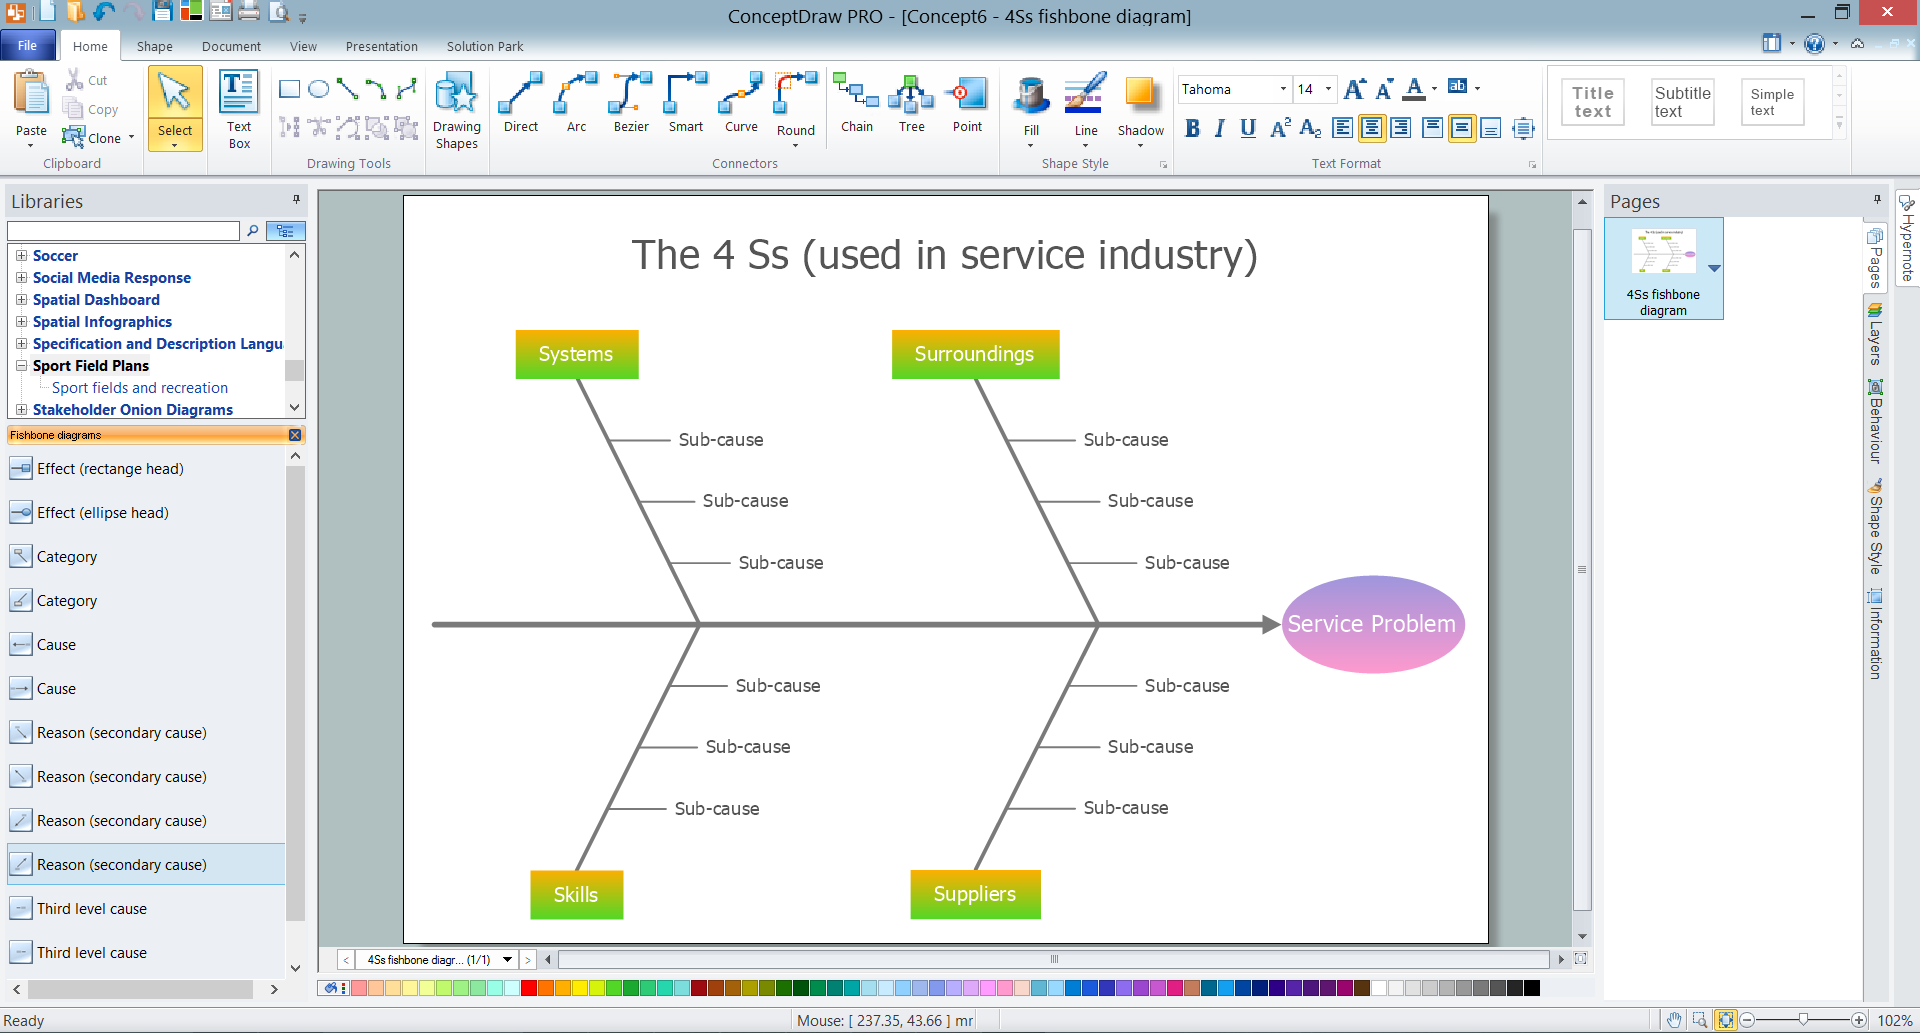
Cause and Effect diagram (Ishikawa diagram or Fishbone diagram) software helps you to show in one diagram the factors of Equipment, People, Process, Environment, Management and Materials, which all in general affect the overall problem and gives the base for the further analysis. ConceptDraw DIAGRAM is perfect software for designers and software developers who need to create Fishbone diagrams. You will get a simple problem-analysis tool - Fishbone software tools for design element to easy construct specific diagrams and identify many possible causes for an effect to attack complex problem solving.UML Class Diagrams. Diagramming Software for Design UML Diagrams
In software engineering, a UML Class Diagrams is a type of static structure diagram that is used both for general conceptual modeling of the systematics of the application, and for detailed modeling translating the models into programming code. Use ConceptDraw DIAGRAM with UML class diagram templates, samples and stencil library from Rapid UML solution to show the classes of system, their attributes, operations or methods, and the relationships among the classes.
Venn Diagram Examples for Problem Solving. Environmental Social Science. Human Sustainability Confluence
The Venn diagram example below shows sustainable development at the confluence of three constituent parts. Create your Venn diagrams for problem solving in environmental social science using the ConceptDraw DIAGRAM diagramming and vector drawing software extended with the Venn Diagrams solution from the area "Diagrams" of ConceptDraw Solution Park.Ishikawa Diagram
In almost every sphere of life and work the people time to time are faced with the fact that on their way there are certain obstacles and problems. But it is not always possible to identify the true cause of particular problem. To understand the basic causes of problems and eliminate them, it is convenient to use the chart of Kaoru Ishikawa - the technique specially designed for this. ConceptDraw DIAGRAM diagramming and vector drawing software extended with Fishbone Diagrams solution from the Management area can help you with construction the Fishbone Diagram also known as Ishikawa Diagram. Ishikawa Diagram shows factors of Equipment, Process, People, Materials, Environment and Management, all affecting the overall problem in one drawing for the further analysis. It is a well effective way to analyze the business problems you must identify and solve.Fishbone Problem Solving Tool
Fishbone diagram, often reffered as Cause and Effect diagram or Ishikawa diagram, is one of the basic and the most effective tools for problems solving. It is a way of graphical identifying, structuring and exploration the root causes of a problem for determining effective decision. ConceptDraw DIAGRAM enhanced with Fishbone Diagrams solution is a professional fishbone problem solving tool which helps you draw Business Productivity diagram, Cause and Effect, Fishbone, Ishikawa Diagrams to solve problems at your business.Business Process Elements: Activities
Create professional business process diagrams using ConceptDraw Activities library with 34 objects from BPMN.
Cause and Effect Diagram
ConceptDraw DIAGRAM software extended with Fishbone Diagrams solution from the Management area of ConceptDraw Solution Park is perfect for Cause and Effect Diagram creating. It gives the ability to draw fishbone diagram that identifies many possible causes for an effect or a problem. Causes and Effects are usually grouped into major categories to identify these sources of variation. Causes and Effects in the diagram show relationships among various factor. Fishbone diagram shows factors of Equipment, Process, People, Materials, Environment and Management, all affecting the overall problem.UML Deployment Diagram. Design Elements
UML Deployment diagram describes the hardware used in system implementations and the execution environments and artifacts deployed on the hardware. ConceptDraw has 393 vector stencils in the 13 libraries that helps you to start using software for designing your own UML Diagrams. You can use the appropriate stencils of UML notation from UML Deployment library.Fishbone Diagram Design Element
ConceptDraw DIAGRAM diagramming and vector drawing software extended with Fishbone Diagrams solution is a perfect tool for software designers and software developers. If you need to create Cause and Effect diagram, Fishbone diagram, Ishikawa diagram from templates and examples, or using the predesigned elements, ConceptDraw DIAGRAM can do this easily. ConceptDraw DIAGRAM software gives ability to design Fishbone diagrams that identify many possible causes for an effect for problem. Each Fishbone diagram design element included to Fishbone Diagrams library is vector and ready-to-use.
 Business Diagrams
The Business Diagrams Solution extends ConceptDraw DIAGRAM with an extensive collection of professionally designed illustrative samples and a wide variety of vector stencils libraries, which are the real help for all business-related people, business analysts, business managers, business advisers, marketing experts, PR managers, knowledge workers, scientists, and other stakeholders allowing them to design the bright, neat, expressive and attractive Bubble Diagrams, Circle-Spoke Diagrams, Circular Arrows Diagrams, and Venn Diagrams with different quantity of sets in just minutes; and then successfully use them in documents, reports, statistical summaries, and presentations of any style.
ConceptDraw DIAGRAM : Able to Leap Tall Buildings in a Single Bound
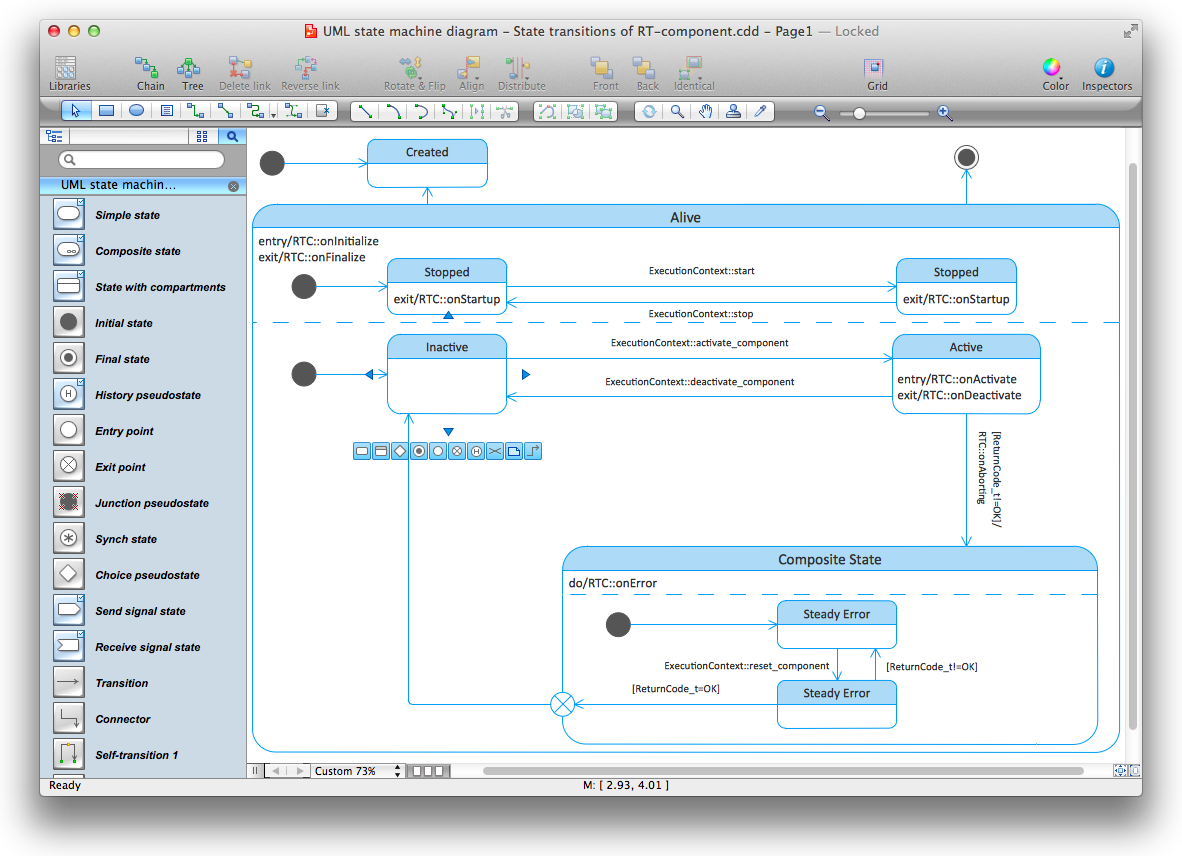
ConceptDraw DIAGRAM is the world’s premier cross-platform business-diagramming tool. Many, who are looking for an alternative to Visio, are pleasantly surprised with how well they can integrate ConceptDraw DIAGRAM into their existing processes. With tens of thousands of template objects, and an easy method for importing vital custom objects from existing Visio documents, ConceptDraw DIAGRAM is a powerful tool for making extremely detailed diagrams, quickly and easily.Diagramming Software for Design UML State Machine Diagrams
UML state machine's goal is to overcome the main limitations of traditional finite-state machines while retaining their main benefits.
Drawing Workflow Diagrams
Drawing workflow diagrams combines both creative and analytic practice. To be the most effective in this process you should find a software that suites this kind of practice. Using ConceptDraw DIAGRAM software for drawing workflow diagrams you get support of features, libraries, templates and samples boosts you creativity and keep you focus on analytic practice, not drawing specifics.UML Deployment Diagram. Diagramming Software for Design UML Diagrams
Deployment diagram describes the hardware used in system implementations and the execution environments and artifacts deployed on the hardware.
Business process Flow Chart — Event-Driven Process chain (EPC) diagrams
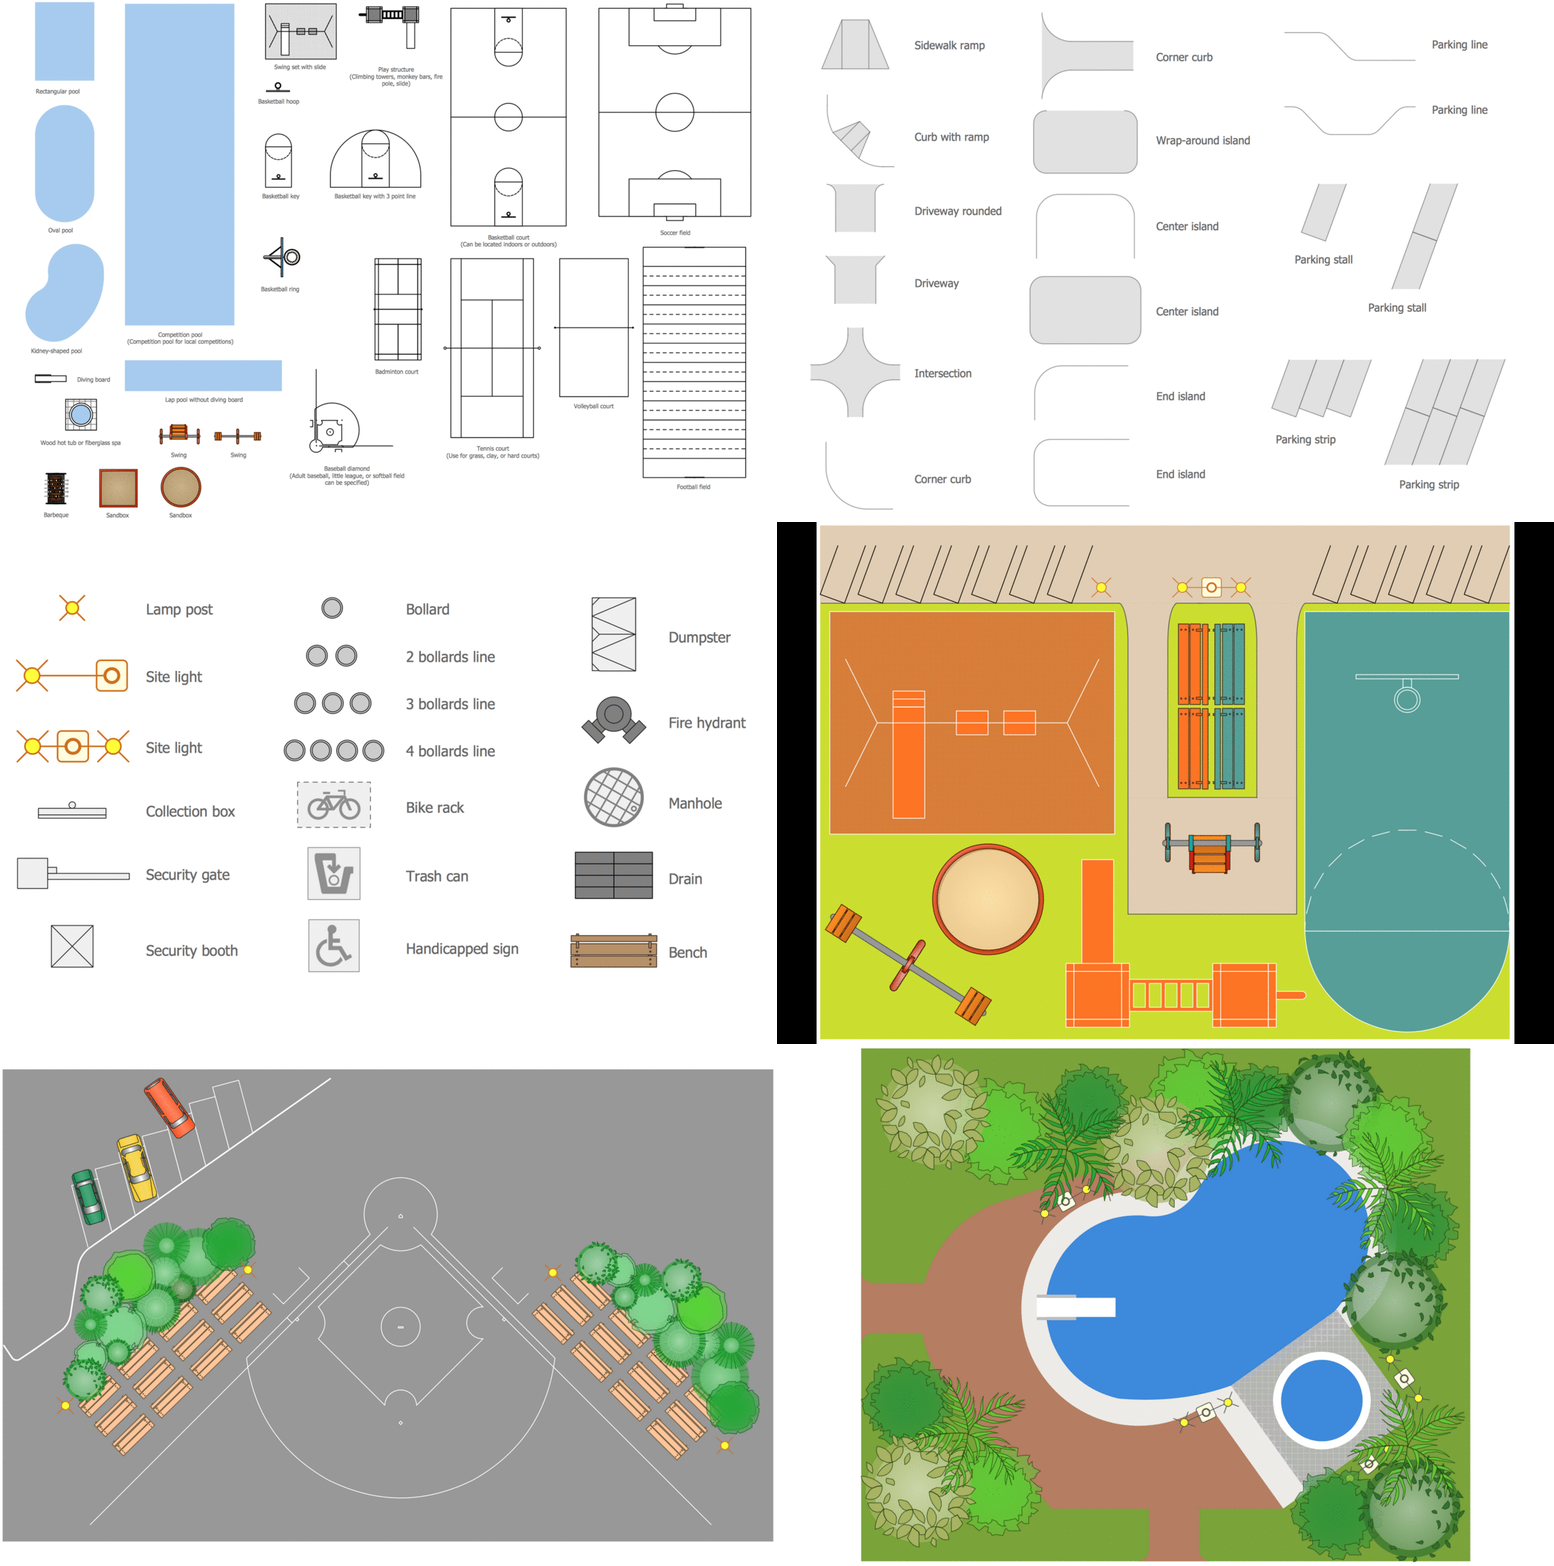
Event-Driven Process chain Diagrams for improvement throughout an organisation. Best software for Process Flow Diagram. The Event-driven Process Chain (EPC) Diagrams allows managers to plan processes and resources.Building Drawing Software for Design Sport Fields
The sport fields, sport complexes, and sport grounds are popular places for all, but especially for children and teenagers who spend there a large amount of their time. So the sport fields must to be safe and carefully thought-out. Where to start and what things to consider when planning and building sport fields? First and foremost you need to take into account is that the fields for football, basketball, volleyball, tennis and other active sports differ by their dimensions, surface and design, and must to be constructed according to the rules for a given game. If the sport field assumes the presence of children of different age, you need organize the comfort staying them together. All installed elements and constructions should bring the maximum benefit and enjoyment from training. That's why the planning and construction the sport field cannot to be realized without a plan. ConceptDraw DIAGRAM building drawing software tools are perfect for design Sport Fields using the ready vector elements from the libraries of Sport Fields Plans solution from Building Plans area.
Venn Diagram
Venn diagrams are illustrations used in the branch of mathematics known as set theory. They show the mathematical or logical relationship between different groups of things (sets). A Venn diagram shows all the possible logical relations between the sets.Cause and Effect Analysis
When you have some problems you need first to explore the reasons which caused them. Cause and Effect Analysis is a perfect way to do this. ConceptDraw DIAGRAM software enhanced with Fishbone Diagrams solution from the Management area of ConceptDraw Solution Park gives the ability to draw fast and easy Fishbone diagram that identifies many possible causes for an effect.Professional Diagrams - No need for any special drawing skills for you
No need for any special drawing skills to create professional looking diagrams outside of your knowledge base. ConceptDraw DIAGRAM takes care of the technical side. Use templates, samples and special libraries for your needs.- UML Deployment Diagram . Design Elements | Business Process ...
- Draw The Diagram Of Business Environment
- Diagram For Business Environment
- Draw A Chart Of Business Environment
- Business Environment Drawing
- Diagram Showing Business Environment
- Draw A Chart Showing Business Environment
- Draw The Diagram Of Micro Business Environment
- Block diagram - Porter's five forces model | Cisco Network ...
- Flow Chart Of The Components Of Business Environment
- Draw A Chart On Components Of Environment
- Bar Diagram Showing Diffrent Components Of Environment
- Windows 8 apps - Vector stencils library | Enviroment Chart
- Ideal Environment Diagram
- Venn Diagram Examples for Problem Solving. Environmental Social ...
- Flowchart Components | HR Flowchart Symbols | UML Deployment ...
- Draw A Diagram Of The Ideal Environment
- Components of ER Diagram | Design elements - Bank UML ...
- Draw A Flowchart Of Component Of Environment
- Diagram Of Business Environment Showing The Links Between

_Win_Mac.png)




.png)

