Daily Schedule Chart
ConceptDraw PRO diagramming and vector drawing software extended with Target and Circular Diagrams solution from the Marketing area of ConceptDraw Solution Park is a powerful tool for Daily Schedule Chart design."Time management is the .. process of planning and exercising conscious control over the amount of time spent on specific activities, especially to increase effectiveness, efficiency or productivity. Time management may be aided by a range of skills, tools, and techniques used to manage time when accomplishing specific tasks, projects, and goals complying with a due date. Initially, time management referred to just business or work activities, but eventually the term broadened to include personal activities as well. A time management system is a designed combination of processes, tools, techniques, and methods. Time management is usually a necessity in any project development as it determines the project completion time and scope." [Time management. Wikipedia]
This timetable pie chart shows the plan of daily actions and its durations in minutes.
It is useful visual tool of personal time management.
This schedule pie chart example was created using the ConceptDraw PRO diagramming and vector drawing software extended with the Target and Circular Diagrams solution from the Marketing area of ConceptDraw Solution Park.
www.conceptdraw.com/ solution-park/ marketing-target-and-circular-diagrams
Business Process Modeling
ConceptDraw RapidDraw PRO helps create visually document and communicate Business Process (BPMN 2.0) information.UML Component Diagram
UML Component Diagrams are used to illustrate the structure of arbitrarily complex systems and illustrates the service consumer - service provider relationship between components.
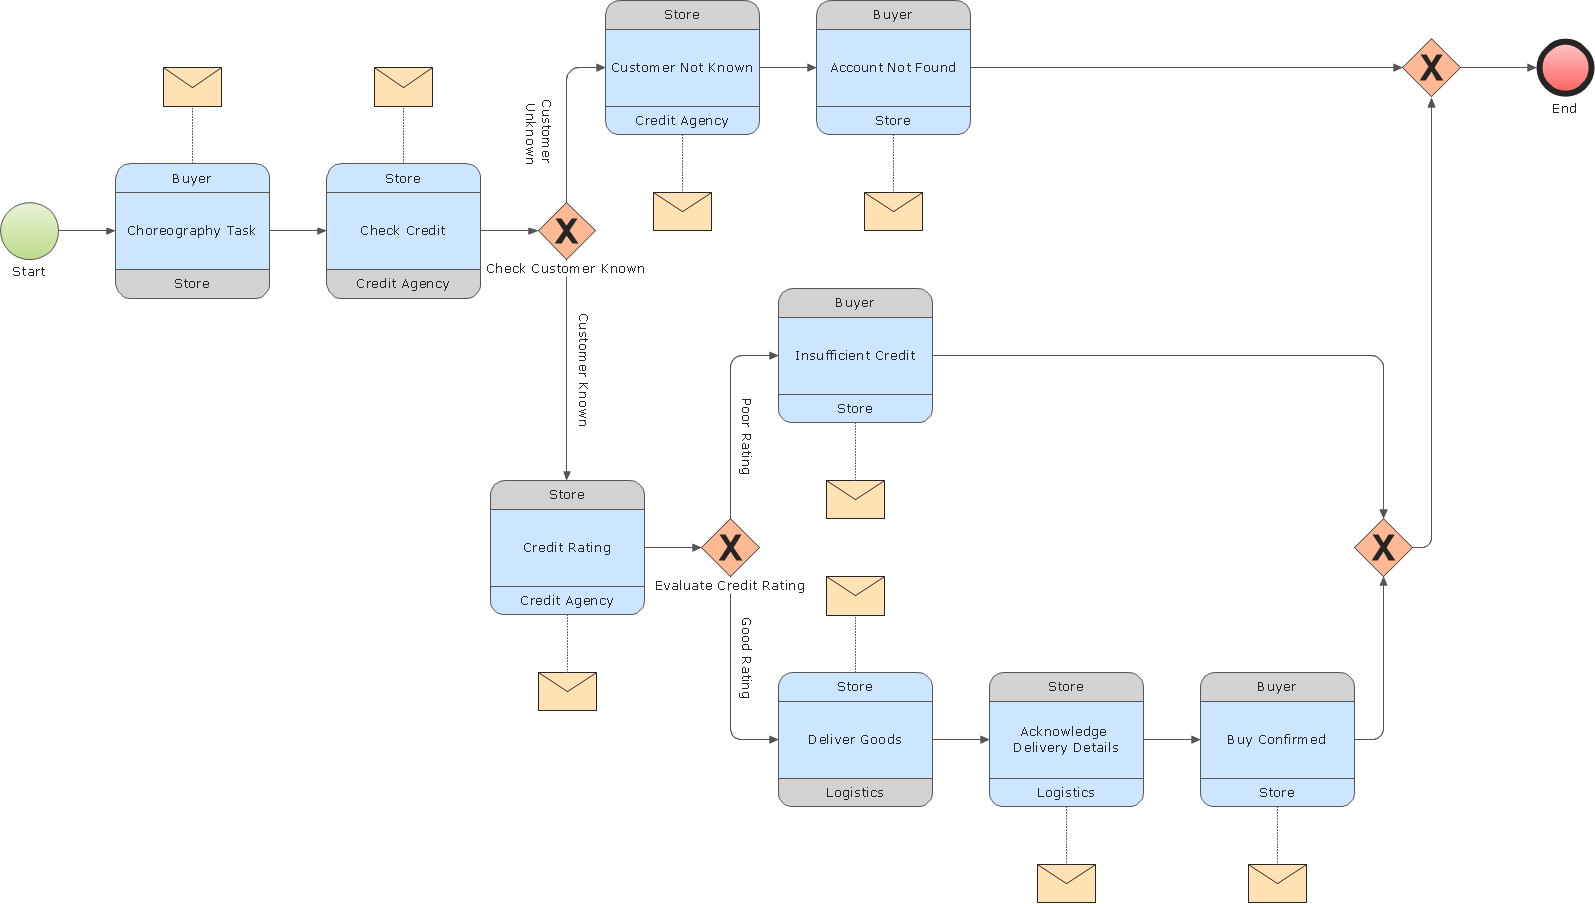
BPMN 2.0
ConceptDraw PRO diagramming and vector drawing software offers the Business Process Diagram Solution from the Business Processes Area of ConceptDraw Solution Park with powerful tools to help you easy represent the business processes and create the business process diagrams based on BPMN 2.0 standard.UML Use Case Diagrams
ConceptDraw has several examples that help you to start using software for designing UML Use Case Diagrams.
Fishbone Diagram Procedure
ConceptDraw PRO diagramming and vector drawing software enhanced with Fishbone Diagrams solution from the Management area of ConceptDraw Solution Park gives the ability to draw Fishbone diagram, which identifies many possible causes for an effect for problem solving. Fishbone Diagram procedure of creation includes the set of steps easy for execution in ConceptDraw PRO.Flowchart Components
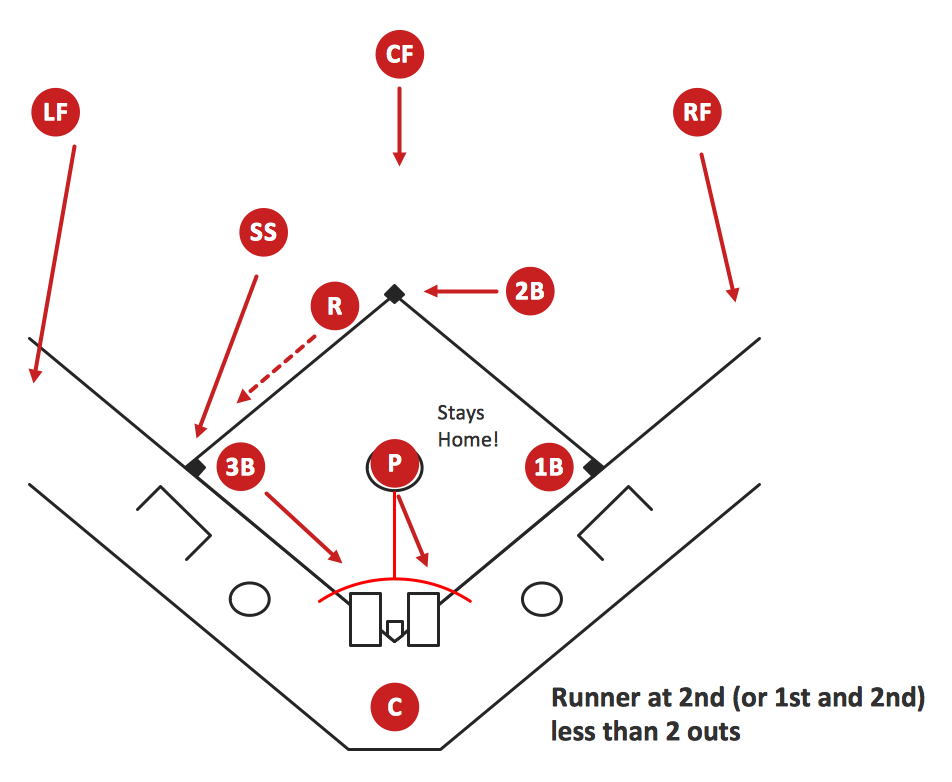
The ConceptDraw Flowchart component includes a set of samples and templates. This geathered as flowchart maker toolbox which focused on drawing flowcharts of any industry standards.Baseball Diagram – Basic Bunt Coverage – Runner at 2nd
Drawing baseball diagrams using ConceptDraw PRO software extended with the Baseball solution saves your time, and adds more value to your work. You can easily convert vector drawing to a popular graphic format and then post it to your blog or site. There is no problem to add your logo or text copyright, or use some text comments to make your diagrams unique and recognizable.Flow Chart Diagram Examples
Draw your own business process flowcharts using ConceptDraw PRO diagramming and business graphics software.Program to Make Flow Chart
Use ConceptDraw PRO diagramming and business graphics software for drawing your own PM life cycle flow charts.Gantt chart examples
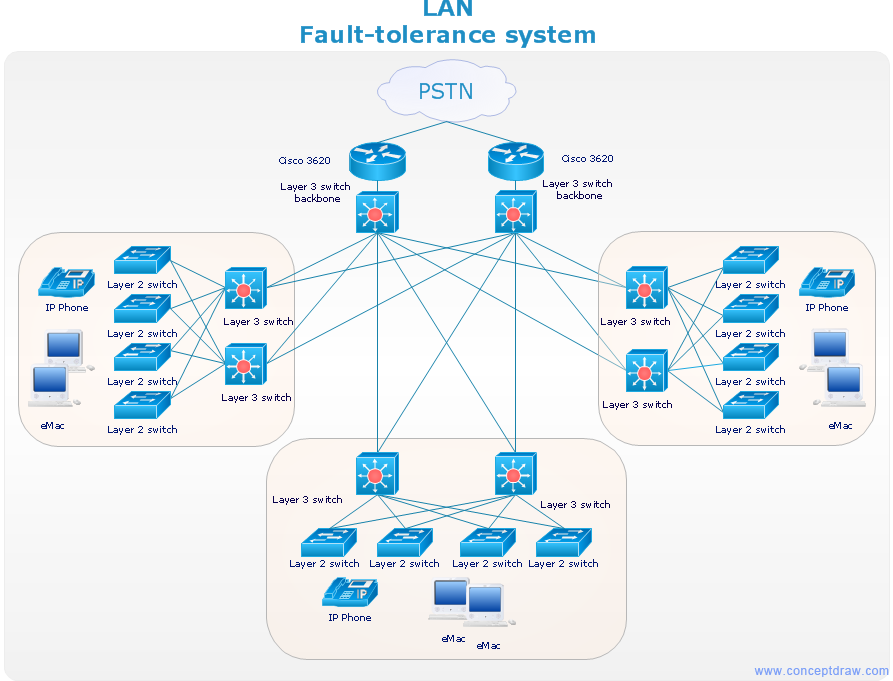
All Gantt charts were made using ConceptDraw PROJECT. ConceptDraw PROJECT works both on Windows and Mac OS X. It allows to schedule a voluntary number of projects in a single Workspace document and lets easily share tasks and resources among them. ConceptDraw PROJECT shares files among Windows and Mac OS X.Network Diagrams for Bandwidth Management
A perfect tool to draw network diagram for bandwidth management. Computer & Networks solution provides the symbol libraries with pre-designed network graphic elements. Use Computer & Networks solution to draw the network diagrams for bandwidth management for Cisco networks, Apple networks, IVR networks, GPRS networks, wi-fi networks, LAN and WAN.
Diagramming Software for Design UML Activity Diagrams
Activity diagram describes the business and operational step-by-step workflows of components in a system. An activity diagram shows the overall flow of control.
Pyramid Diagram
The purchase or purchasing funnel is a consumer focused marketing model which illustrates the theoretical customer journey towards the purchase of a product or service.- Show A Diagram Of Daily Routine Schedule
- Draw A Flow Chart For Daily Routine Of Your Daily Life
- Schedule pie chart - Daily action plan | Personal Daily Activities ...
- Draw Flow Chart Daily Routine
- Schedule pie chart - Daily action plan | Target and Circular ...
- How To Make A Timetable For Daily Life With Diagram
- Schedule pie chart - Daily action plan | Chart Examples | Bar Graphs ...
- Daily Schedule Chart | The Circular Flow Diagram | Flowchart ...
- Schedule pie chart - Daily action plan | Workflow Diagram Template ...
- Schedule pie chart - Daily action plan | Pie Chart | How to Create a ...
- Daily Schedule Chart | Examples of Flowchart | Flow Chart Diagram ...
- Daily Schedule Chart | Good Flow Chart app for Mac | Basic ...
- Daily Schedule Chart | Schedule pie chart - Daily action plan | Gantt ...
- Daily Schedule Chart | Program to Make Flow Chart | Flowchart ...
- Daily Schedule Chart | Good Flow Chart app for Mac | Basic ...
- Schedule pie chart - Daily action plan | Blank Calendar Template ...
- Make A Flow Chart Of Your Daily Routine
- Daily Schedule Chart | Basic Flowchart Symbols and Meaning ...
- Draw Bar Graph On Daily Schedule


