Process Flowchart
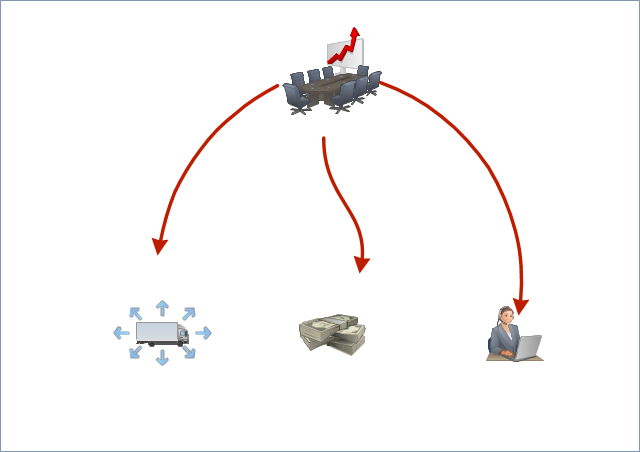
The main reason of using Process Flowchart or PFD is to show relations between major parts of the system. Process Flowcharts are used in process engineering and chemical industry where there is a requirement of depicting relationships between major components only and not include minor parts. Process Flowcharts for single unit or multiple units differ in their structure and implementation. ConceptDraw PRO is Professional business process mapping software for making Process flowcharts, Process flow diagram, Workflow diagram, flowcharts and technical illustrations for business documents and also comprehensive visio for mac application. Easier define and document basic work and data flows, financial, production and quality management processes to increase efficiency of your business with ConcepDraw PRO. Business process mapping software with Flowchart Maker ConceptDraw PRO includes extensive drawing tools, rich examples and templates, process flowchart symbols and shape libraries, smart connectors that allow you create the flowcharts of complex processes, process flow diagrams, procedures and information exchange. Process Flowchart Solution is project management workflow tools which is part ConceptDraw Project marketing project management software. Drawing charts, diagrams, and network layouts has long been the monopoly of Microsoft Visio, making Mac users to struggle when needing such visio alternative like visio for mac, it requires only to view features, make a minor edit to, or print a diagram or chart. Thankfully to MS Visio alternative like ConceptDraw PRO software, this is cross-platform charting and business process management tool, now visio alternative for making sort of visio diagram is not a problem anymore however many people still name it business process visio tools.
Databases Access Objects Model with ConceptDraw PRO
ConceptDraw Basic gives the opportunity of interaction with any ODBC-compatible databases. For this the Database Access Objects Model is provided. All calls to the database are made by certain methods of objects of this model.Pyramid Chart Examples
Pyramid Charts and Triangle Diagrams are used to visually structure the topics and progressively order the quantitative data. They allow to illustrate hierarchical structure of the topics, proportional, interconnected and containment relations among the topics. The multilevel Pyramids and Triangle diagrams are constructed oriented up or down and divided into several horizontal slices. They are effectively used to represent marketing strategies, social strategies, information systems, market value, etc., to illustrate presentations, websites, documents, reports in business, finances, sales, management, marketing, media, training, consulting, and many other fields. To maximize the efficiency in drawing the Pyramid Charts, use the ConceptDraw PRO diagramming and vector drawing software extended with Pyramid Diagrams solution from Marketing area, which contains the set of Pyramid Chart examples, samples, templates and vector design elements of triangular diagrams and pyramids with different quantity of levels for various needs."Chen's notation for entity–relationship modeling uses rectangles to represent entity sets, and diamonds to represent relationships appropriate for first-class objects: they can have attributes and relationships of their own. If an entity set participates in a relationship set, they are connected with a line.
Attributes are drawn as ovals and are connected with a line to exactly one entity or relationship set.
Cardinality constraints are expressed as follows:
- a double line indicates a participation constraint, totality or surjectivity: all entities in the entity set must participate in at least one relationship in the relationship set;
- an arrow from entity set to relationship set indicates a key constraint, i.e. injectivity: each entity of the entity set can participate in at most one relationship in the relationship set;
- a thick line indicates both, i.e. bijectivity: each entity in the entity set is involved in exactly one relationship.
- an underlined name of an attribute indicates that it is a key: two different entities or relationships with this attribute always have different values for this attribute.
Attributes are often omitted as they can clutter up a diagram; other diagram techniques often list entity attributes within the rectangles drawn for entity sets." [Entity–relationship model. Wikipedia]
The vector stencils library ERD, Chen's notation contains 13 symbols for drawing entity-relatinship diagrams using the ConceptDraw PRO diagramming and vector drawing software.
The example "Design elements - ER diagram (Chen notation)" is included in the Entity-Relationship Diagram (ERD) solution from the Software Development area of ConceptDraw Solution Park.
Workflow Diagram Examples
ConceptDraw PRO software extended with the Workflow Diagram solution provides a complete set of samples, templates and features help you to draw diagrams faster. A workflow diagram software you use for drawing workflow diagrams and business process flow diagrams should provide a wide set of examples allows you get closer with workflow diagrams, learn symbols meaning, find appropriate layout and design, and then start drawing your own workflow diagram masterfully. Workflow diagrams used for orchestrating organizational processes between company departments and humans, so critical process diagrams used to train many people to interact must be clear and professional to convey an idea from a view. Thats a reason we created a lot workflow symbols and workflow icons collected them into special Workflow Diagram solution in ConceptDraw Solution Park.How To Create Restaurant Floor Plan in Minutes
Developing Floor Plans, Design Drawings, Plans of Furniture Placement for restaurants and cafes is one of the most responsible and important steps at their construction and designing. Selection of favorable design, the right style of furniture and decors largely determine the success and atmosphere of the institution. The restaurant floor planner ConceptDraw PRO is a perfect choice for architects and designers. Enhanced with Cafe and Restaurant Floor Plans solution it offers a lot of extensive vector symbol libraries and building plan elements for drawing Restaurant floor plans, Restaurant layouts, Restaurant furniture layouts, Cafe floor plans, Bar area floor plan, Fast food restaurant plan, etc. With ConceptDraw PRO you don't need to be an artist to create great-looking restaurant floor plan drawings in minutes, all needed drawing tools are delivered by Building Plans area solutions. Construct your own general plan of restaurant's premises, choose the furniture for your taste from the Cafe and Restaurant Floor Plans solution libraries and arrange it on the plan as you desire fast and easy. ConceptDraw PRO has many of the features found in Visio for Mac such as Drawing, Connection, Shape and Editing Tools.
HelpDesk
How to Resize Objects
When creating diagram using ConceptDraw PRO, you can select, move, resize and rotate objects. After selecting an object (or objects) in a document, you can change it position, resize it or move an object to the desired position. The sizes of objects in ConceptDraw PRO can be changed by simple dragging, or you can set a particular size of any object. Using ConceptDraw PRO, you can re-size an object on the page using the absolute measurements instead of a mouse. You can make quick work of designing complex drawing using a combination of different-sized items.Entity Relationship Software
Entity Relationship Diagram (ERD) is a leading data modeling tool that is used to illustrate the logical structure of database, helps to organize and represent your project's data in terms of entities, attributes and relationships. To describe the database structure usually is used the ERD Chen's or Crow's Foot notation. Chen's notation supposes the representation of entities by rectangles with the entities names inside, relationships by diamonds and attributes by ovals connected with a line to exactly one entity. In Crow's Foot notation the boxes are used to depict the entities and their attributes, the lines between them - to depict relationships. ConceptDraw PRO software extended with Entity-Relationship Diagram (ERD) Solution is convenient and useful for designing the ER Diagrams, and supports the use of Chen's or Crow’s Foot notation according to your needs and desires. The ERD diagrams produced with ConceptDraw PRO Entity Relationship Diagram software can be successfully used in whitepapers, presentations, posters, datasheets, technical materials, etc.Workflow Process Example
One of the most popular option helps to draw diagrams faster is pre-designed set of examples related to each kind of diagram. ConceptDraw PRO software extended with the Workflow Diagrams solution delivers a complete set of workflow process examples helps you to start making your own workflow faster.HelpDesk
How to Draw a Floor Plan for Your Office
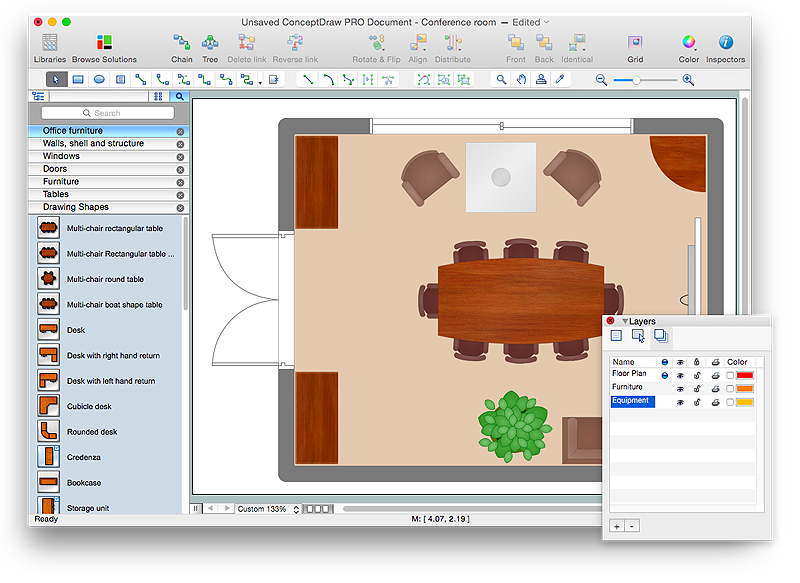
Designing the right office space is is an essential factor of business productivity. An office floor plan should reflect the needs of both employees and customers. ConceptDraw PRO allows you to draw the Floor Plan for your office using a special office equipment library as well as set of?special objects that?displays the?sizes, corners, squares and other floor plan details.Basic Workflow Examples
ConceptDraw PRO with the Workflow Diagrams solution delivers a complete set of samples and templates. This set contains basic workflow examples you may use to start drawing your own workflow or to get closer with workflow idea.HelpDesk
How to Draw an Area Chart in ConceptDraw PRO
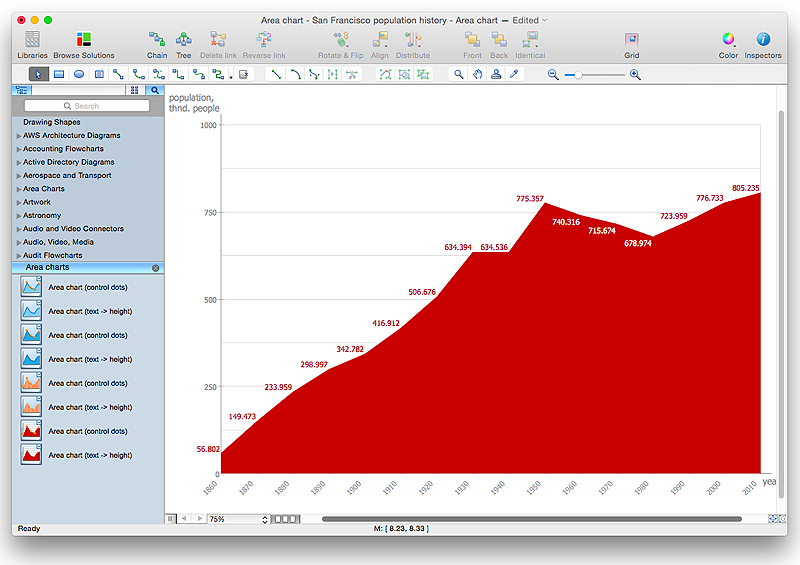
Area chart is similar to a line chart, but an area chart has an area, commonly filled with color below the line. The applying of Line charts and area charts are also very similar. They both show continuity across a data set. They are both can be used for displaying time series data and for depicting tendencies better than separate values, but they have some different characteristics. Using the proper one is good chance to show once again a professionalism of your graphic documents. An area chart depicts a colored area below the line. The sum on the vertical axis of an area chart represents the entire value, while the height of each separate piece shows its parts. Area charts are used to display multiple data series with proportion to a whole value , or for separate data series showing a set of countable values, or cumulative data.Basic Flowchart Symbols and Meaning
Flowcharts are the best for visually representation the business processes and the flow of a custom-order process through various departments within an organization. ConceptDraw PRO diagramming and vector drawing software extended with Flowcharts solution offers the full set of predesigned basic flowchart symbols which are gathered at two libraries: Flowchart and Flowcharts Rapid Draw. Among them are: process, terminator, decision, data, document, display, manual loop, and many other specific symbols. The meaning for each symbol offered by ConceptDraw gives the presentation about their proposed use in professional Flowcharts for business and technical processes, software algorithms, well-developed structures of web sites, Workflow diagrams, Process flow diagram and correlation in developing on-line instructional projects or business process system. Use of ready flow chart symbols in diagrams is incredibly useful - you need simply drag desired from the libraries to your document and arrange them in required order. There are a few serious alternatives to Visio for Mac, one of them is ConceptDraw PRO. It is one of the main contender with the most similar features and capabilities.
HelpDesk
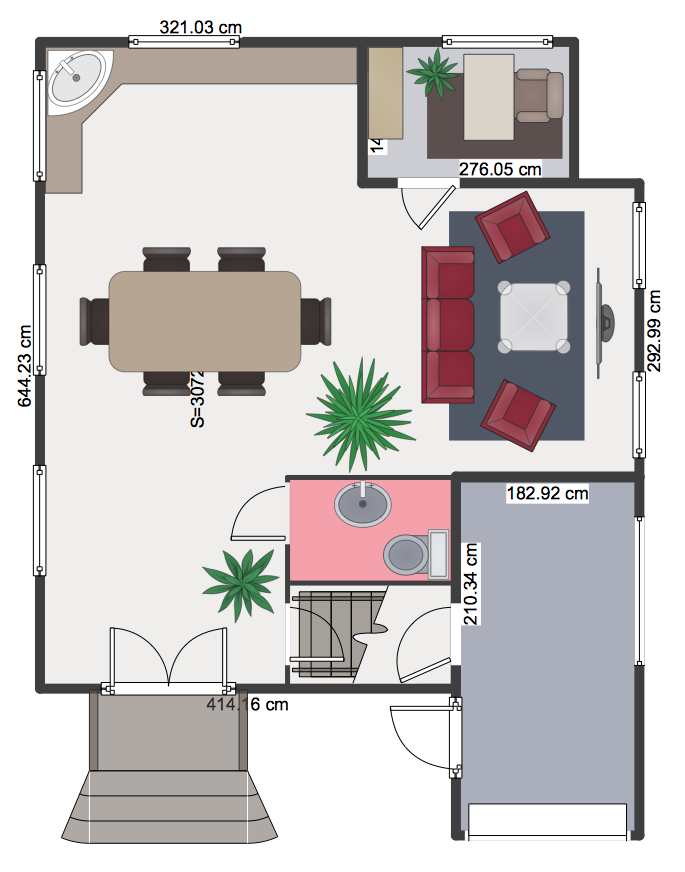
How to Create a Floor Plan
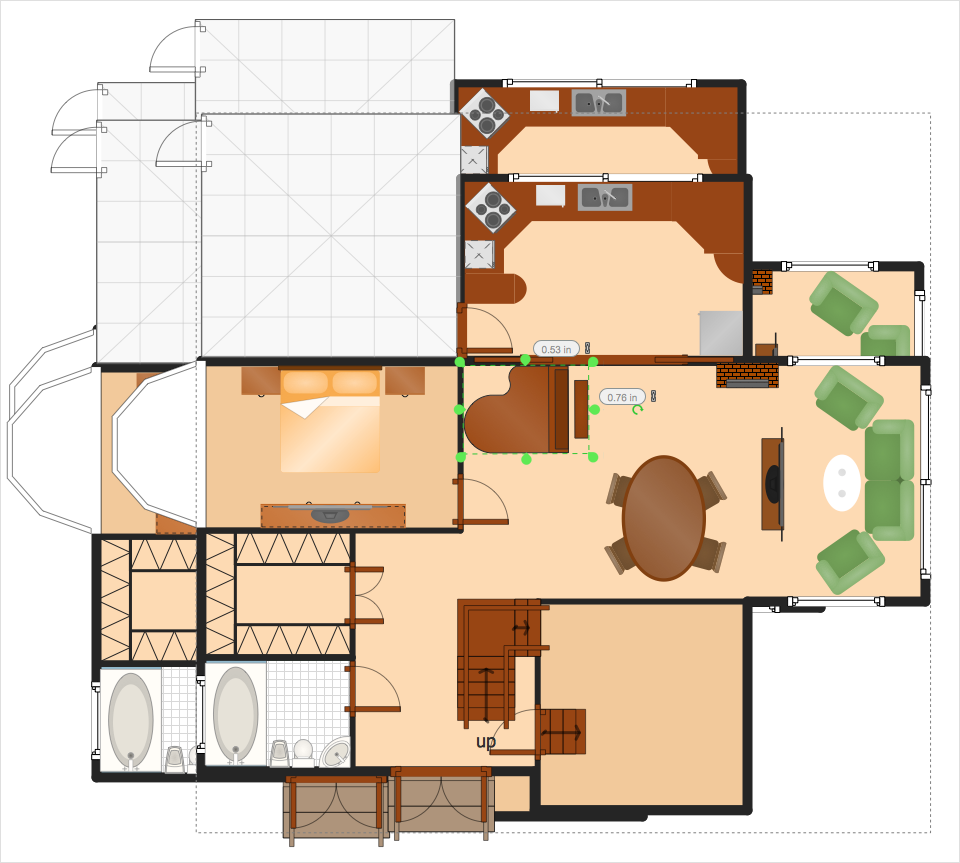
Making a floor plan is the best way to get a handle on how to organize your living space, and find out what could be changed. Creating a floor plan to scale is a challenge of the home and interior design process and can be noticeably helpful for visualizing things like furniture layout. You can use ConceptDraw?PRO to?produce layouts of?real estate properties. ConceptDraw PRO contains the large quantity of pre-designed vector objects that you can use for quick and easy designing such floor plans. You ?can easily determine the?size of?the?rooms and distances in?you drawing. The?ability to?create a floor plan is?delivered by?the?Floor Plans?solution. This solution extends ConceptDraw PRO with libraries that contains over 500 objects of floor plan elements. There is?a set of?special objects that?displays the?sizes, corners, squares and other technical details using?the?current measurements?of?units.IDEF4 Standard
Use Case Diagrams technology. IDEF4 standard implies not only graphical presentation but the additional information about diagrams of heredity, methods systematization and types which are contained in specifications.- Entity Relationship Diagram Symbols and Meaning ERD Symbols ...
- Design elements - ER diagram (Chen notation) | Entity-Relationship ...
- Example Of Er
- Flow chart Example . Warehouse Flowchart | Workflow Diagrams ...
- Design elements - ER diagram (Chen notation) | Design elements ...
- ER Diagrams with ConceptDraw PRO | ERD Symbols and Meanings ...
- Entity Relationship Diagram Chen Model
- Entity-Relationship Diagram (ERD) | ConceptDraw PRO ER ...
- Business Process Reengineering Examples | BPR Diagram ...
- Entity-Relationship Diagram (ERD) | ER Diagram Tool | Entity ...
- Entity-Relationship Diagram (ERD) | Design Element: Chen for ...
- Entity Relationship Diagram Examples
- Entity-Relationship Diagram (ERD) | Design Element: Chen for ...
- Mathematical Diagrams | Basic Diagramming | Mathematics ...
- Software For Drawing Mathematical Diagrams
- Entity Relationship Diagram Symbols
- Erd Example
- Data Flow Diagram
- Example Of Chen Erd
- Taxi order process - BPMN 1.2 diagram | Taxi service order ...


.png--diagram-flowchart-example.png)


