"Project planning is part of project management, which relates to the use of schedules such as Gantt charts to plan and subsequently report progress within the project environment.
Initially, the project scope is defined and the appropriate methods for completing the project are determined. Following this step, the durations for the various tasks necessary to complete the work are listed and grouped into a work breakdown structure. Project planning is often used to organize different areas of a project, including project plans, work loads and the management of teams and individuals. The logical dependencies between tasks are defined using an activity network diagram that enables identification of the critical path. Float or slack time in the schedule can be calculated using project management software. Then the necessary resources can be estimated and costs for each activity can be allocated to each resource, giving the total project cost. At this stage, the project schedule may be optimized to achieve the appropriate balance between resource usage and project duration to comply with the project objectives. Once established and agreed, the project schedule becomes what is known as the baseline schedule. Progress will be measured against the baseline schedule throughout the life of the project. Analyzing progress compared to the baseline schedule is known as earned value management.
The inputs of the project planning phase include the project charter and the concept proposal. The outputs of the project planning phase include the project requirements, the project schedule, and the project management plan." [Project planning. Wikipedia]
The flow chart example "Project planning process" was created using the ConceptDraw PRO diagramming and vector drawing software extended with the Flowcharts solution from the area "What is a Diagram" of ConceptDraw Solution Park.
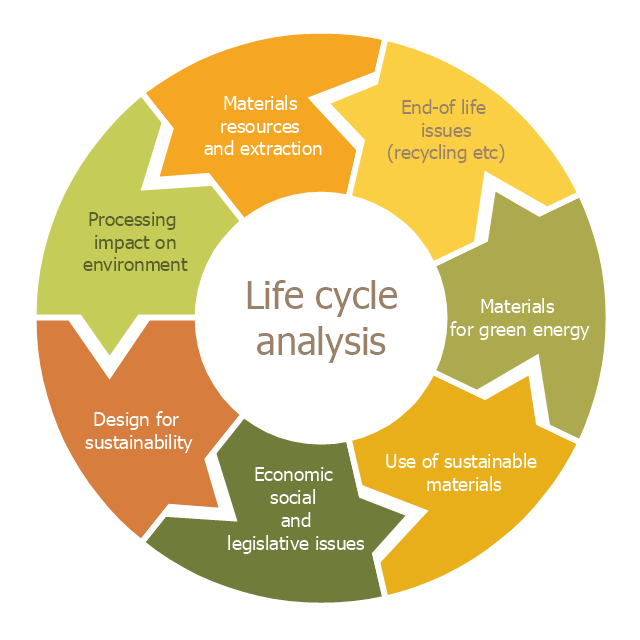
This cycle diagram sample was created on the base of the figure illustrating the article "Environmental Materials" by Cris Arnold from the website of the UK Centre for Materials Education of the Higher Education Academy. "The figure ... schematically shows how the disparate areas under the heading of 'environmental materials' can be linked via a life cycle analysis approach. ...
Life Cycle Analysis.
Life Cycle Analysis is essentially a method of considering the entire environmental impact, energy and resource usage of a material or product. It is often known as a 'cradle-to-grave' analysis and can encompass the entire lifetime from extraction to end-of-life disposal. Life cycle analysis can be an extremely effective way of linking many different aspects of the environmental impacts of materials usage. ...
Materials Extraction and Resource Implications.
The environmental impact of raw materials extraction and processing together with global resource issues provides a good place to start consideration of environmental aspects of materials. ...
Environmental Impacts of Processing.
... Topics that would come under this subject area include the specific environmental problems associated with processing of metals, polymers, ceramics, composites etc, and how these problems can be overcome.
Design for Sustainability.
This area ... will ... cover issues such as design for successful recycling, waste minimisation, energy efficiency and increased lifetime.
Economic, Social and Legislative Issues.
... For example, materials selection within the automotive industry is now heavily influenced by 'end-of-life vehicle' and 'hazardous material' regulations.
Use of Sustainable Materials.
... It is probably sensible to define such materials as those that have distinct differences that achieve environmental benefit compared to conventional materials. With this definition, the list would include:
(1) Materials of a significantly plant-based nature, including wood, natural fibre composites, natural polymers.
(2) Materials produced using a large proportion of waste material, including recycled polymers, composites made from waste mineral powders, and arguably also much steel and aluminium.
Materials for Green Energy.
The most exciting developments in Materials Science are in the realm of functional materials, and many of these serve an environmentally-beneficial purpose, particularly in the production of green energy.
These include:
(1) Solar-cell materials.
(2) Fuel-cell technology.
(3) Catalytic pollution control.
End-of-Life Issues.
The treatment of materials at the end of their lifetime is a significant subject area and encompasses aspects such as recycling techniques and materials limitations, biodegradabilty and composting, chemical recovery and energy recovery." [materials.ac.uk/ guides/ environmental.asp]
The ring chart example "Life cycle analysis" was created using the ConceptDraw PRO diagramming and vector drawing software extended with the Target and Circular Diagrams solution from the Marketing area of ConceptDraw Solution Park.
www.conceptdraw.com/ solution-park/ marketing-target-and-circular-diagrams
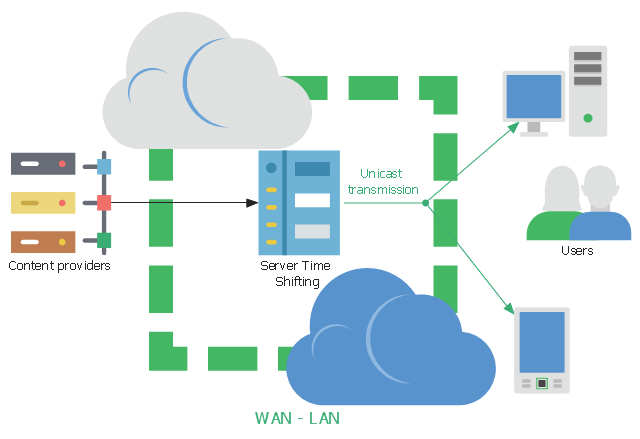
This network diagram sample shows the video on demand (VoD) architecture in a network video recorder (NVR) enviroment. It was designed on the base of Wikimedia Commons file: BaixdemandaArchitecture.png.
[commons.wikimedia.org/ wiki/ File:BaixdemandaArchitecture.png]
This file is licensed under the Creative Commons Attribution-Share Alike 3.0 Unported license. [creativecommons.org/ licenses/ by-sa/ 3.0/ deed.en]
"Video on demand (display) (VOD) are systems which allow users to select and watch/ listen to video or audio content when they choose to, rather than having to watch at a specific broadcast time. IPTV technology is often used to bring video on demand to televisions and personal computers." [Video on demand. Wikipedia]
The network diagram example "VoD architecture in a NVR enviroment" was created using the ConceptDraw PRO diagramming and vector drawing software extended with the Computers and
Communications solution from the Illustration area of ConceptDraw Solution Park.
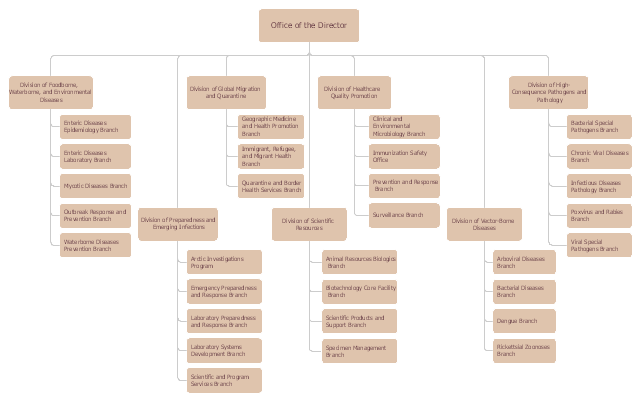
This example is based on the organizational chart from the NCEZID website. [cdc.gov/ ncezid/ org-ncezid.html]
"The National Center for Emerging and Zoonotic Infectious Diseases aims to prevent disease, disability, and death caused by a wide range of infectious diseases. We focus on diseases that have been around for many years, emerging diseases (those that are new or just recently identified), and zoonotic diseases (those spread from animals to people). Our work is guided in part by a holistic "One Health" strategy, which recognizes the vital interconnectedness of microbes and the environment. Through a comprehensive approach involving many scientific disciplines, we can attain better health for humans and animals and improve our environment.
To carry out our mission, we use many different tactics: providing leadership in public health, conducting exemplary science, strengthening preparedness efforts, establishing public health policy, sharing vital health information with the public, and building partnerships. Each of the center’s seven divisions works with partners to protect and improve the public’s health in the United States and worldwide." [cdc.gov/ ncezid/ ]
The organizational chart example "National Center for Emerging and Zoonotic Infectious Diseases" was created using the ConceptDraw PRO diagramming and vector drawing software extended with the Organizational Charts solution from the Management area of ConceptDraw Solution Park.
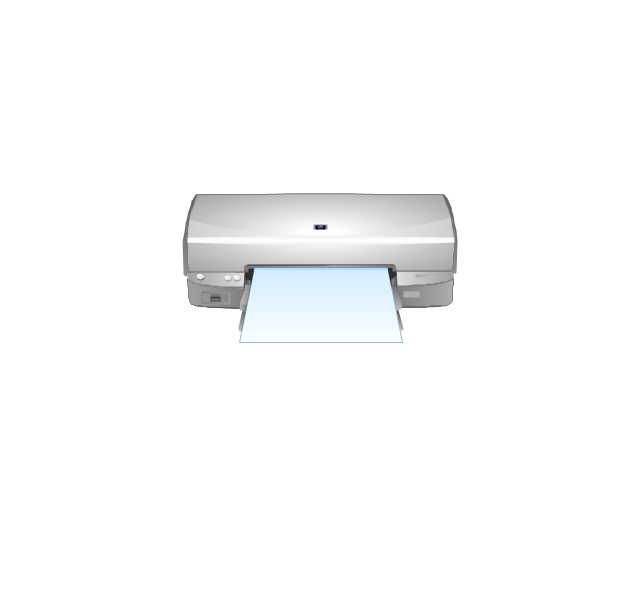
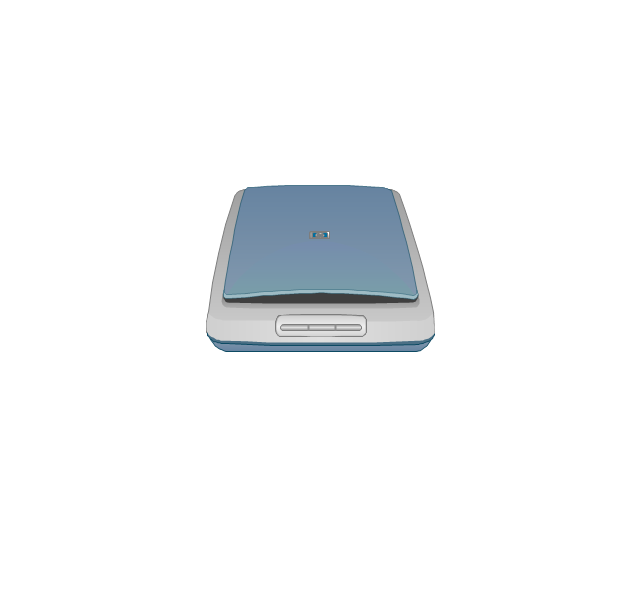
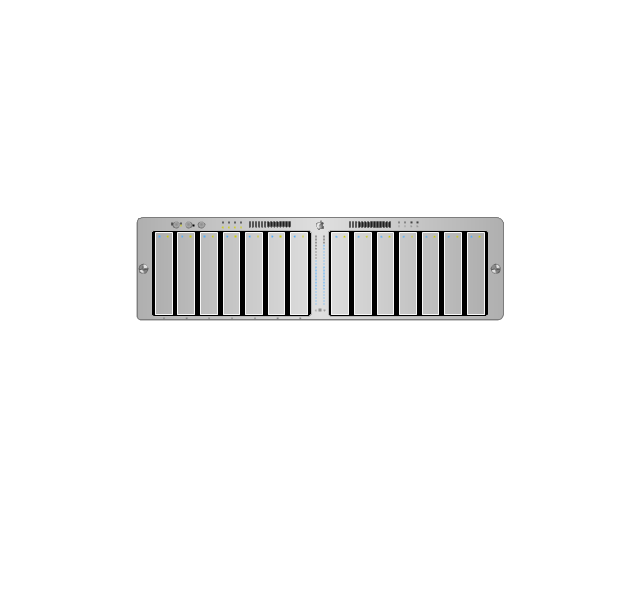
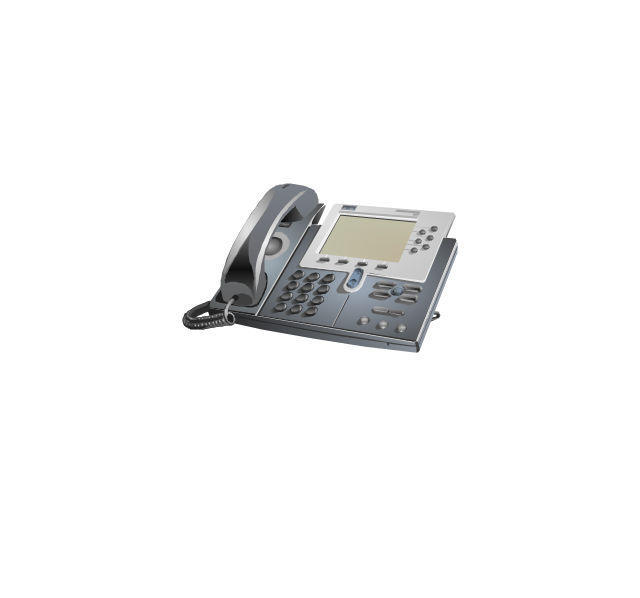
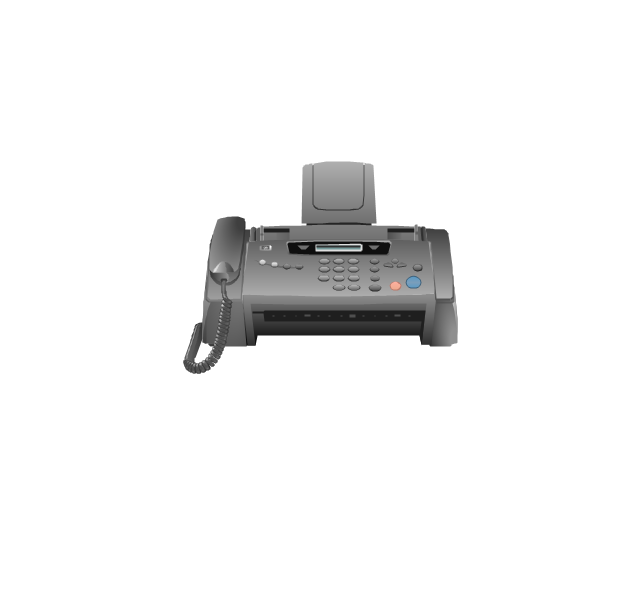
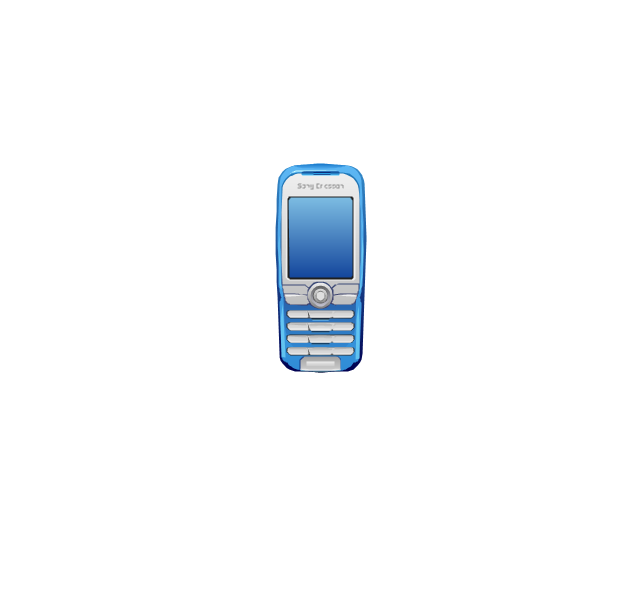
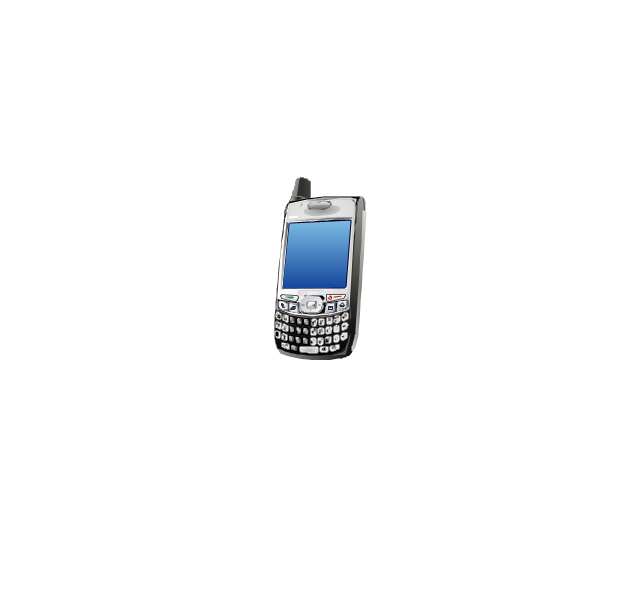
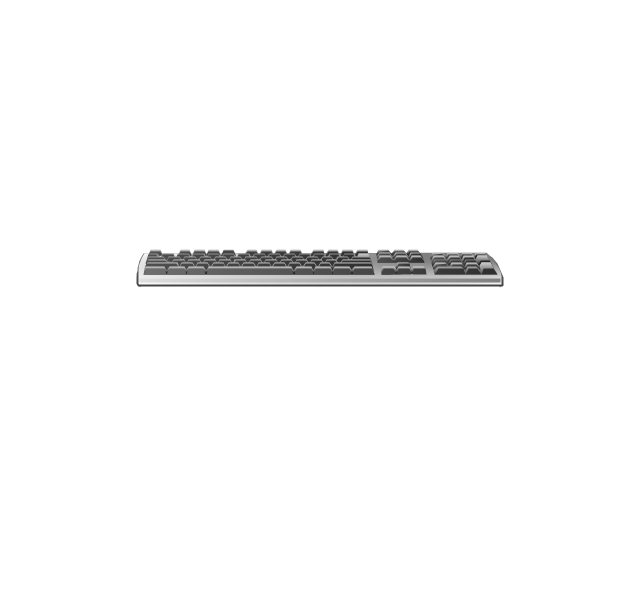
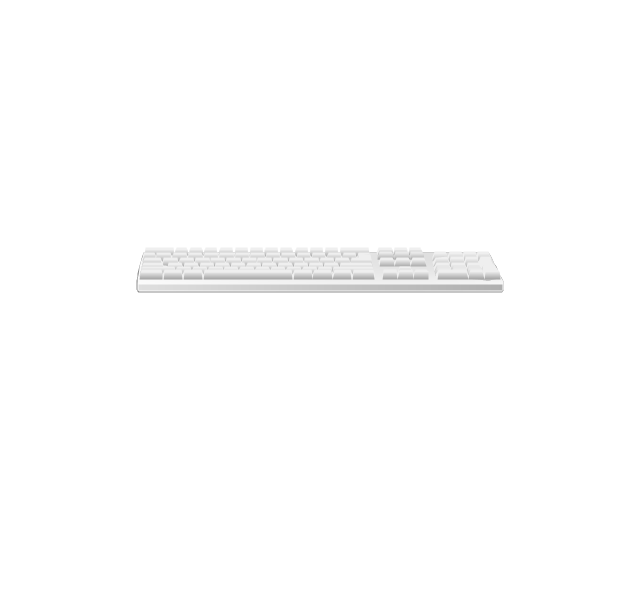
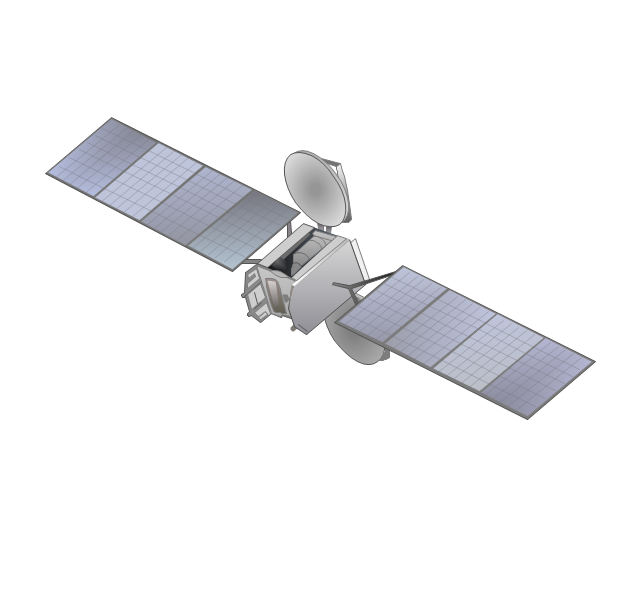
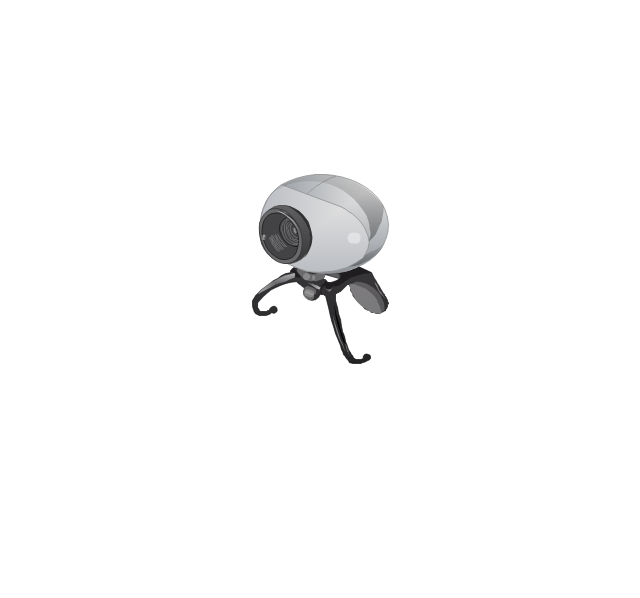
The vector stencils library "Computers" contains 52 hardware icons.
Use it to design your audio, video and multimedia illustrations, presentations, web pages and infographics with ConceptDraw PRO diagramming and vector drawing software.
The vector stencils library "Computers" is included in the Audio, Video, Media solution from the Illustration area of ConceptDraw Solution Park.
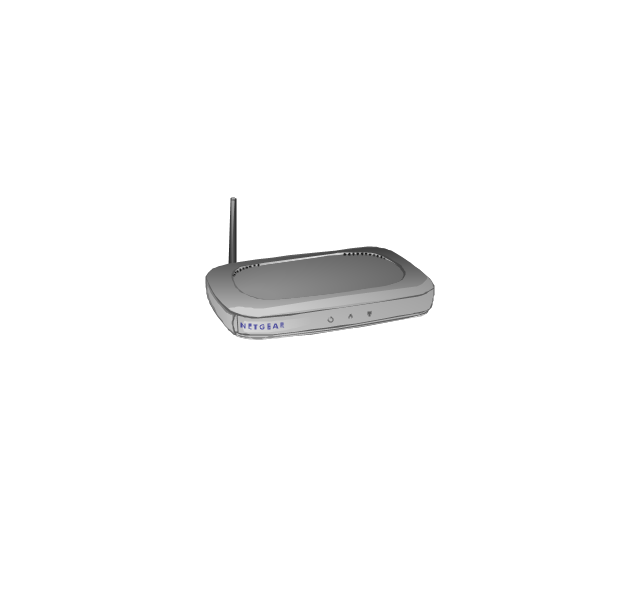
The vector stencils library "Computer network" contains 51 symbols of computer network devices and equipment for drawing computer network diagrams.
"Network Mapping Software.
A number of software tools exist to design computer network diagrams / or generate visual maps of networks, servers, storage, services, data centers, and other peripherals. Broadly, there are two types of software tools - those that help create diagrams manually and those that generate them using automated / semi-automated approaches.
Type of Software.
(1) Manual - allows users to design and draw logical and physical topology diagrams by manually placing icons and connections.
(2) Automated - generate topology diagrams / maps by traversing the network and automatically discovering resident devices or by importing network data." [Comparison of network diagram software. Wikipedia]
ConceptDraw PRO is the software for manual design of computer network diagrams. The solutions of the Computer and Networks area in ConceptDraw Solution Park extend ConceptDraw PRO with vector stencils libraries, templates and examples for creating the computer network diagrams.
The symbols example "Computer network - Vector stencils library" was created using the ConceptDraw PRO diagramming and vector drawing software extended with the Computer and Networks solution from the Computer and Networks area of ConceptDraw Solution Park.
www.conceptdraw.com/ solution-park/ computer-and-networks
The vector stencils library "Windows 8 apps" contains 40 shortcut icons of Windows 8 software applications.
Use this shortcut UI icon set to design graphic user interface (GUI) prototypes of your software apps for Windows 8.
"In computing, a file shortcut is a handle in a user interface that allows the user to find a file or resource located in a different directory or folder from the place where the shortcut is located.
Shortcuts are typically implemented as a small file containing a target URI or GUID to an object, or the name of a target program file that the shortcut represents. The shortcut might additionally specify parameters to be passed to the target program when it is run. Each shortcut can have its own icon. Shortcuts are very commonly placed on a desktop, in an application launcher panel such as the Microsoft Windows Start menu, or in the main menu of a desktop environment. ...
File shortcuts (also known as shell links) were introduced in Windows 95. Microsoft Windows uses .lnk as the filename extension for shortcuts to local files, and .URL for shortcuts to remote files, like web pages. Commonly referred to as "shortcuts" or "link files", both are displayed with a curled arrow overlay icon by default, and no filename extension. ...
Shortcut files can be used to launch programs in minimized or maximized window states if the program supports it. ...
Beginning with Windows 7, some shortcuts also store Application User Model IDs (AppUserModelIDs). Instead of the target command line, AppUserModelIDs may directly be used to launch applications. Shortcuts with AppUserModelIDs are used by some desktop programs and all WinRT Modern apps for launching." [File shortcut. Wikipedia]
The shortcut icons example "Windows 8 apps - Vector stencils library" was created using the ConceptDraw PRO diagramming and vector drawing software extended with the Windows 8 User Interface solution from the Software Development area of ConceptDraw Solution Park.
- Draw A Flowchart Of Component Of Environment
- Draw A Chart On Components Of Environment
- Draw The Diagram Of Business Environment
- Process Flowchart | Simple Drawing Applications for Mac | Venn ...
- Venn Diagrams | Business Process Mapping | Draw And Label ...
- Full Label Diagram Of Internet Environment
- How to Draw Business Process Diagrams with RapidDraw Interface ...
- Process Flowchart | UML Deployment Diagram. Design Elements ...
- Diagram Of Micro And Macro Environment
- File Processing System Environment Diagram

