How to Draw an Organization Chart
An Organizational chart is a type of diagram which visually displays the structure of an organization, relationships and relative ranks of the organization′s parts and positions. Organizational chart is constructed as an hierarchical structure, in the form of tree. How to Draw an Organization Chart the most easy and quickly? The Organizational Charts solution, innovative Tree Auto-connection mode and ConceptDraw Arrows10 Technology included in ConceptDraw DIAGRAM software are powerful drawing tools that change the way of diagrams production. Arrows10 Technology provides smart behavior for the connectors, and so quick and precise placement when drawing, and lets easy make the changes and automatic rearrangement. It helps to make the process of drawing diagrams more efficient, easier and faster. Now, you don′t need to think on how to connect or place the objects, you can concentrate fully on what to draw. See obligatory the helpful video tutorial about creation the Organization Charts and orgchart professional presentations with ConceptDraw products.Flow Chart Creator
ConceptDraw DIAGRAM is a flowchart design software. There are large collections of professional flowchart symbols for process flow diagrams, standard flowchart symbols and colored basic flowchart symbols. Built-in examples and video lessons allow users to get started immediately and do drawing of virtually any type of flowchart or process flow diagramsMarketing Infographics
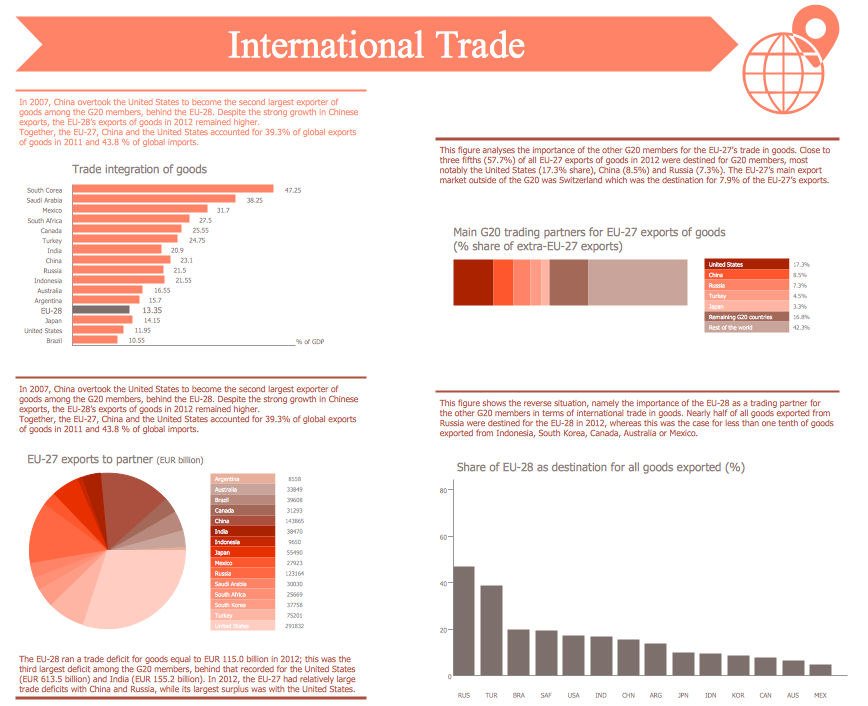
Marketing Infographics is a very popular tool that allows to represent the complex data, knowledge, and other marketing information in a simple, visual and attractive graphical form. But how to draw Marketing Infographics simply and quickly? ConceptDraw DIAGRAM diagramming and vector drawing software extended with unique Marketing Infographics Solution from the Business Infographics Area will help you design marketing infographics without efforts. This toolset included in ConceptDraw Office for small business project management, creating presentations using marketing infographics is critical part project management reporting software.Horizontal Cross Functional Flowchart
ConceptDraw DIAGRAM is a powerful software that helps you create professional looking cross-functional flowcharts with the well-designed objects. ConceptDraw DIAGRAM allows you to focus on work, not the drawing process. ConceptDraw Arrows10 Technology allows to draw connectors with smart behavior that gives flexibility to you during work process.Material Requisition Flowchart. Flowchart Examples
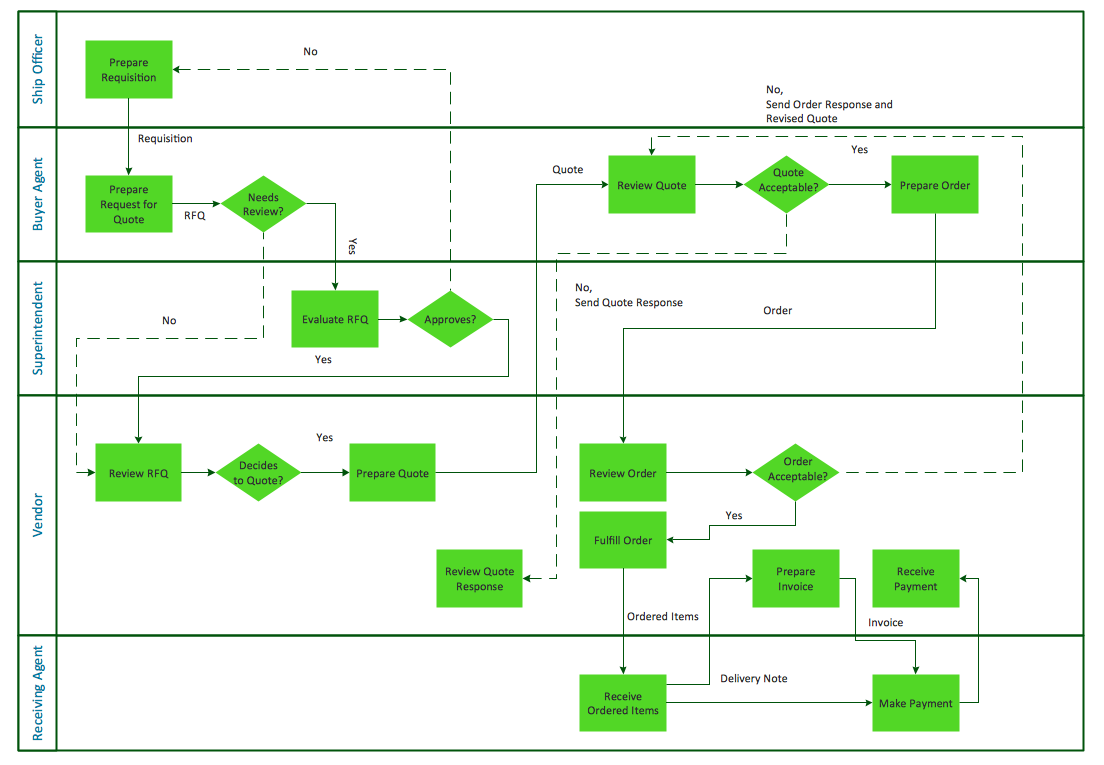
Material requisition is a request generated by internal or external organization with a goal to inform the purchase department about the needed items and materials. The requisition can be represented as a written document on a pre-printed form or online request in form of electronic document. The electronic inquisition occupies a leading position in a modern world, now the paper forms are replaced by electronic ordering processes and workflows. The requisition is actively used in business as an internal document for notification the store about the needed goods, in medicine for making the orders on medical equipment and medicaments, in industry for creation request for purchasing some items and materials, and so on. ConceptDraw DIAGRAM ector graphics software extended with Flowcharts solution from the Diagrams area is powerful and useful tool for drawing various types of Flowcharts, including without doubt the Material Requisition Flowchart of any degree of detailing. Succeed in drawing using the large quantity of predesigned flowchart specific shapes, symbols and icons.Design Element: Crows Foot for Entity Relationship Diagram - ERD
Entity-Relationship Diagram (ERD) is ideal tool that helps execute the detalization of data warehouse for a given designed system, lets to document the system's entities, attributes (objects' properties), and their interactions each other (relationships). Creation of an ERD requires the choice of specific set of notations, which the best suits for your database design. Two notations - Chen’s and Crow's Foot are applied for ERDs design. Chen's notation was developed first and has linguistic approach, the boxes represent the entities and are considered as nouns, relationships between them are shown as diamonds in a verb form. Over time Chen’s style was adapted into the popular standard - Crow’s Foot notation, where entities are shown as boxes and relationships - as labeled lines. ConceptDraw DIAGRAM software supplied with Entity-Relationship Diagram (ERD) solution offers samples and templates of ER diagrams, and also ready-to-use vector design elements - ERD Crow′s Foot and Chen's notation icons for easy designing your own ER diagrams for depicting databases.Business diagrams & Org Charts with ConceptDraw DIAGRAM
The business diagrams are in great demand, they describe the business processes, business tasks and activities which are executed to achieve specific organizational and business goals, increase productivity, reduce costs and errors. They let research and better understand the business processes. ConceptDraw DIAGRAM is a powerful professional cross-platform business graphics and business flowcharting tool which contains hundreds of built-in collections of task-specific vector stencils and templates. They will help you to visualize and structure information, create various Business flowcharts, maps and diagrams with minimal efforts, and add them to your documents and presentations to make them successful. Among them are Data flow diagrams, Organization charts, Business process workflow diagrams, Audit flowcharts, Cause and Effect diagrams, IDEF business process diagrams, Cross-functional flowcharts, PERT charts, Timeline diagrams, Calendars, Marketing diagrams, Pyramids, Target diagrams, Venn diagrams, Comparison charts, Analysis charts, Dashboards, and many more. Being a cross-platform application, ConceptDraw DIAGRAM is very secure, handy, free of bloatware and one of the best alternatives to Visio for Mac users.
UML Collaboration Diagram (UML2.0)
UML Collaboration Diagram depicts the interactions between objects or parts in terms of sequenced messages and describes both the static structure and dynamic behavior of a system. Rapid UML solution provides templates, examples and libraries of stencils for quick and easy drawing all the types of system and software engineering diagrams according to UML 2.4 and 1.2 notations.
Cross-Functional Flowchart
Use of Cross-Functional Flowchart is a clear way of showing each team member’s responsibilities and how processes get shared or transferred between different responsible people, teams and departments. Use the best flowchart maker ConceptDraw DIAGRAM with a range of standardized cross-functional flowchart symbols to create the Cross-Functional Flowcharts simply and to visualize the relationship between a business process and the functional units responsible for that process. To draw the most quickly Cross-Functional Flowcharts, Cross Functional Process Maps, or Cross Functional Process Flow Diagrams, start with a Cross-functional flowchart samples and templates from ConceptDraw Solution Park. The ConceptDraw Arrows10 and RapidDraw technologies will be also useful for you in drawing. ConceptDraw DIAGRAM supports designing both types - horizontal and vertical Cross-functional flowcharts. A vertical layout makes the accents mainly on the functional units while a horizontal layout - on the process. If you need a Visio alternative in Mac OS X, try ConceptDraw DIAGRAM. Its interface is very intuitive and it’s actually much easier to use than Visio, yet somehow it’s just as powerful if not more so. ConceptDraw DIAGRAM performs professional quality work and seamless Visio interaction.
Use Case Diagrams technology with ConceptDraw DIAGRAM
Use case diagrams are used at the development of software and systems for definition of functional system requirements or system of systems. Use case diagram presents the consecution of object’s actions (user’s or system’s) which are executed for reaching the definite result.- Draw A Diagram To Explain Types Of Trade
- Diagram Of Aid To Trade
- Foreign trade - Onion diagram | Target Diagram | Target and ...
- Organizational Structure | How to Draw an Organization Chart ...
- How to Draw a Line Chart Quickly | Block diagram - Selling ...
- Flow Chart For Trading
- Sales Process Flowchart. Flowchart Examples | How to Draw an ...
- How To Draw Patent Drawings Software
- Flow Chart Of Foreign Trade Showing Import And Export
- Diagram International Trade Process


