HelpDesk
How to Create a Fault Tree Analysis Diagram (FTD) in ConceptDraw PRO
Fault Tree Diagram are logic diagram that shows the state of an entire system in a relationship of the conditions of its elements. Fault Tree Diagram are used to analyze the probability of functional system failures and safety accidents. ConceptDraw PRO allows you to create professional Fault Tree Diagrams using the basic FTD symbols. An FTD visualize a model of the processes within a system that can lead to the unlikely event. A fault tree diagrams are created using standard logic symbols . The basic elements in a fault tree diagram are gates and events.HelpDesk
How To Create Root Cause Analysis Diagram Using ConceptDraw Office
Root Cause Analysis (RCA) is used to determine the main causes of the problem. If the certain factor is the root cause, this mean that its vanishing will help to prevent the further recurrence of the problem. Root Cause Analysis diagram is used to analyze the root causes of factors that influence the problem. It helps to identify the root causes for a factor and then propose possible corrective actions. A diagram is constructed separately for each high priority factor. The ability to create a RCA tree diagram from a mind map is supported by the ConceptDraw Seven Management and Planning Tools solution.
 Fault Tree Analysis Diagrams
This solution extends ConceptDraw PRO v9.5 or later with templates, fault tree analysis example, samples and a library of vector design elements for drawing FTA diagrams (or negative analytical trees), cause and effect diagrams and fault tree diagrams.
Graphic Technologies
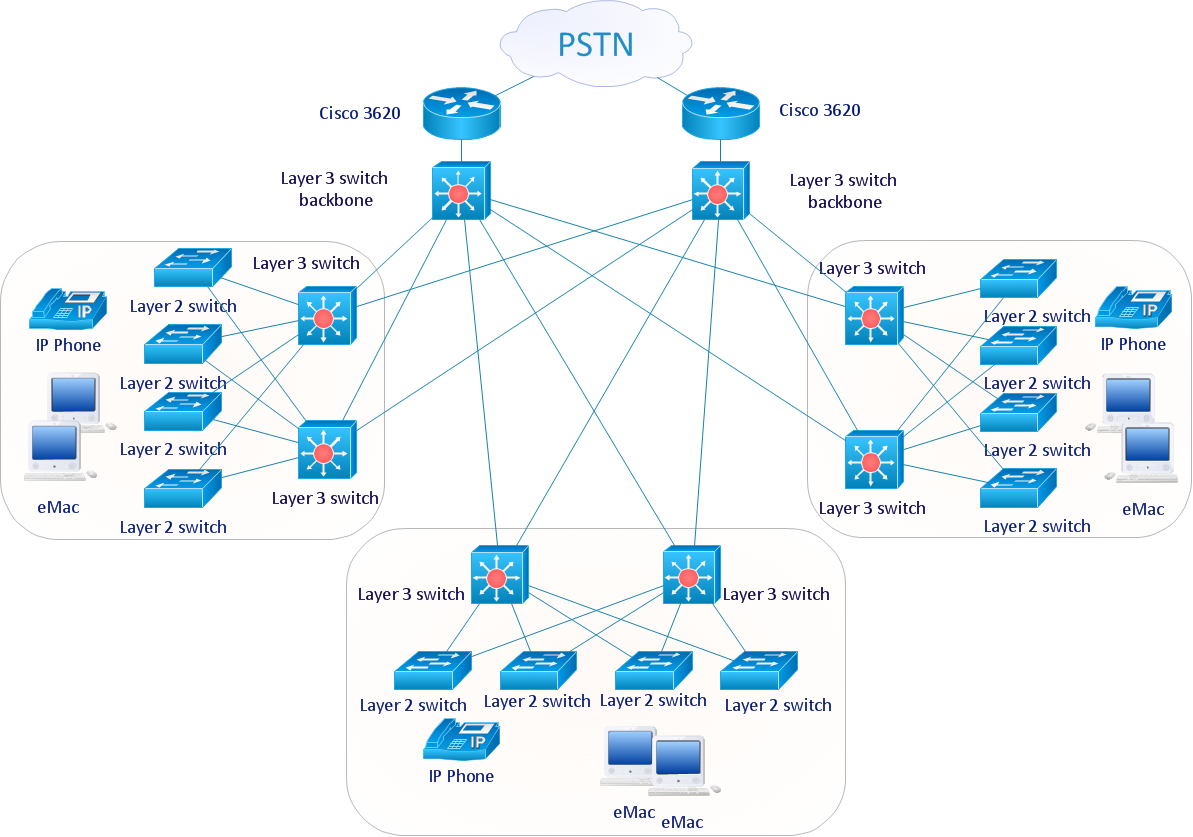
Graphics Technology looks at how to communicate graphically, develop ability to create graphical presentations for varied needs, understand standards and special conventions, develop specific techniques and build an understanding of the impact of graphical presentation on society. If you want to use effective methods for your work, you may need a tool which may let you represent your ideas and goals in graphic way.- Tree Network Topology Diagram | Fully Connected Network ...
- Network Topologies | Tree Network Topology Diagram | Fully ...
- Network Topologies | Tree Network Topology Diagram | Bus network ...
- Hybrid Network Topology | Tree Network Topology Diagram | Star ...
- Network Topology | Tree Network Topology Diagram | Star Network ...
- Network Topologies | Star Network Topology | Tree Network ...
- Draw The Tree Diagrame In Classification Of Computer Its Types
- Star Network Topology | Tree Network Topology Diagram | Network ...
- Network Topologies | Fully Connected Network Topology Diagram ...
- Draw The Tree Diagram In Classification Of Computer Its Types
- Tree Network Topology Diagram | Star Network Topology | Network ...
- Hybrid Network Topology | Star Network Topology | Tree Network ...
- Network Topologies | Tree Network Topology Diagram | Hybrid ...
- Star Network Topology | Hybrid Network Topology | Tree Network ...
- Tree Network Topology Diagram | Draw Diagram on Mac | Bus ...
- Bus Network Topology | Network Topologies | Tree Network ...
- Bus Network Topology | Fully Connected Network Topology ...
- Network Topology Illustration | Tree Network Topology Diagram ...
- Network Topology Graphical Examples | Star Network Topology ...
- Star Network Topology | Network Topologies | Tree Network ...


