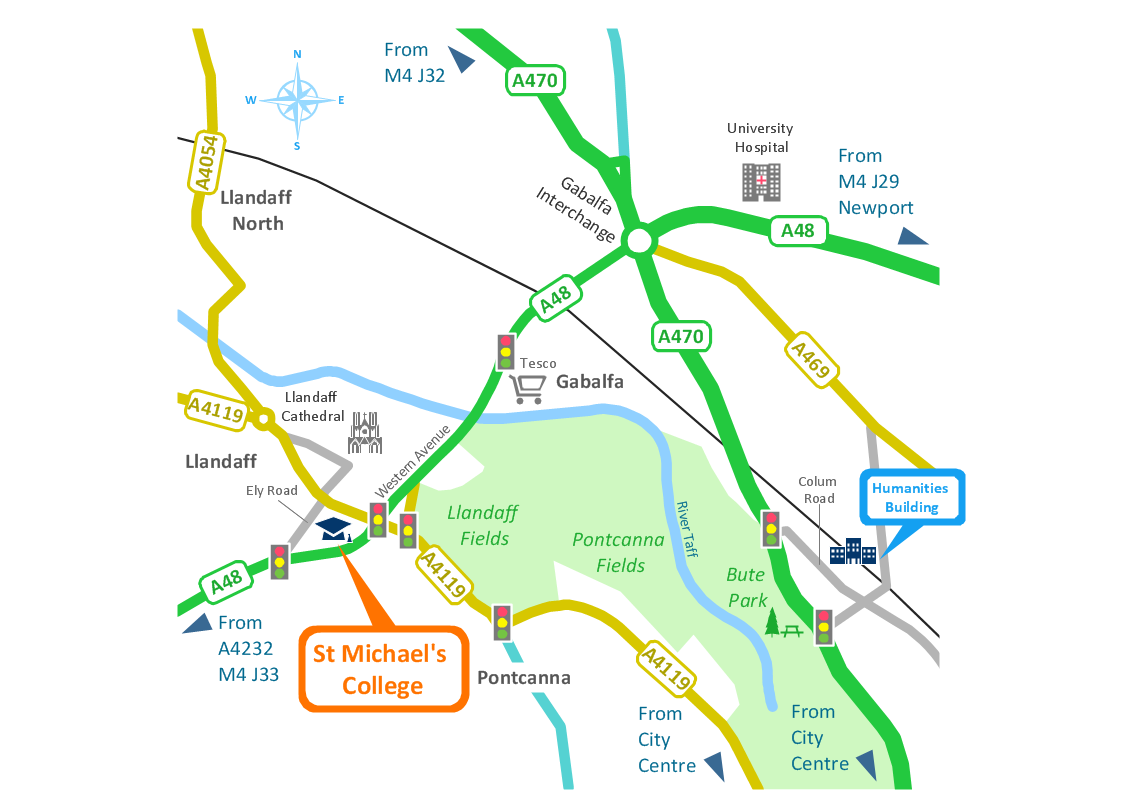
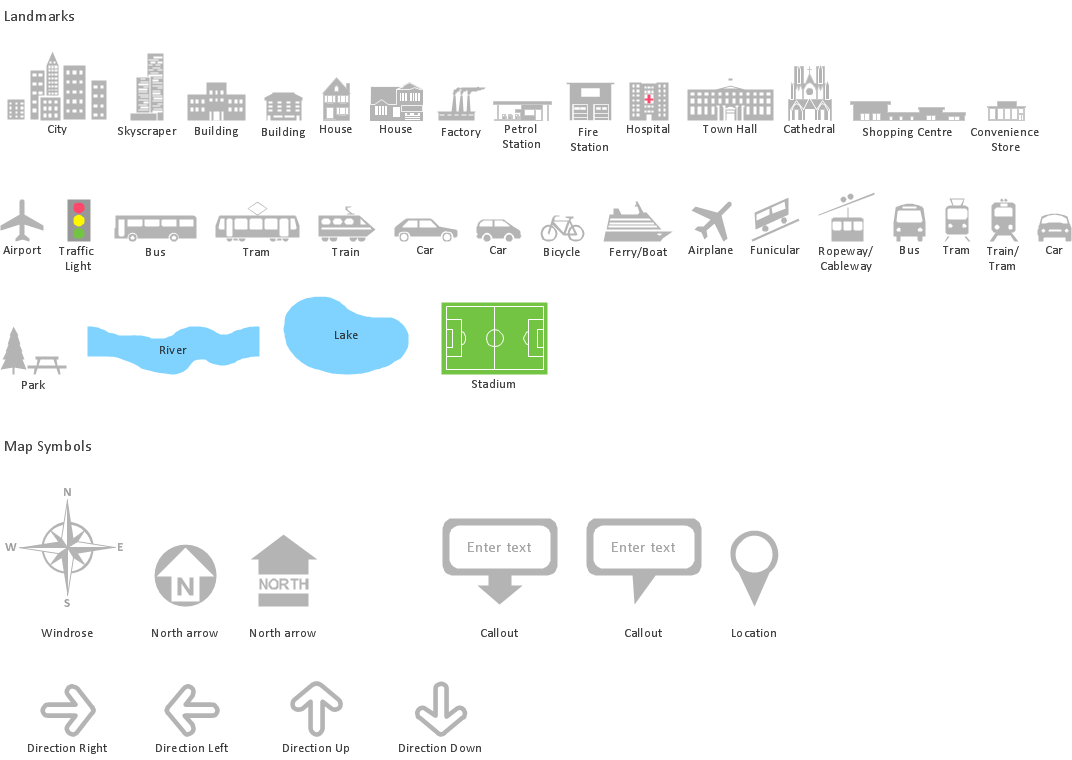
Spatial infographics Design Elements: Location Map
Infographic Design Elements for visually present various geographically distributed information.HelpDesk
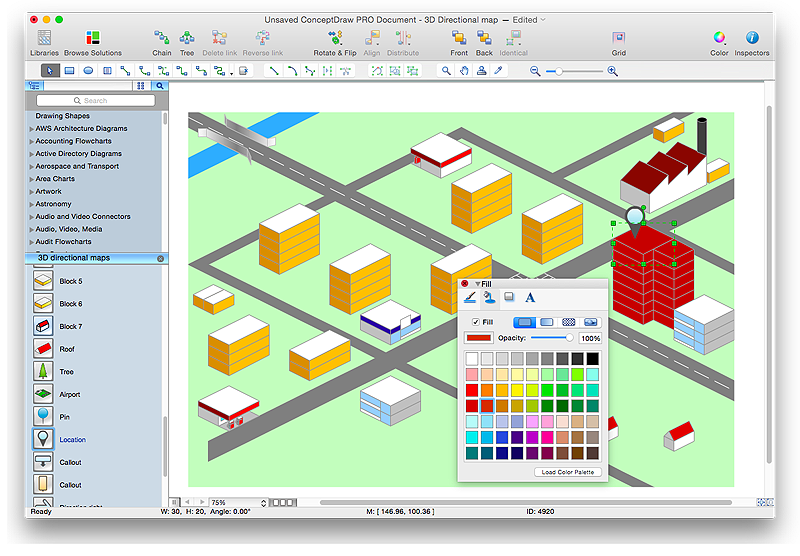
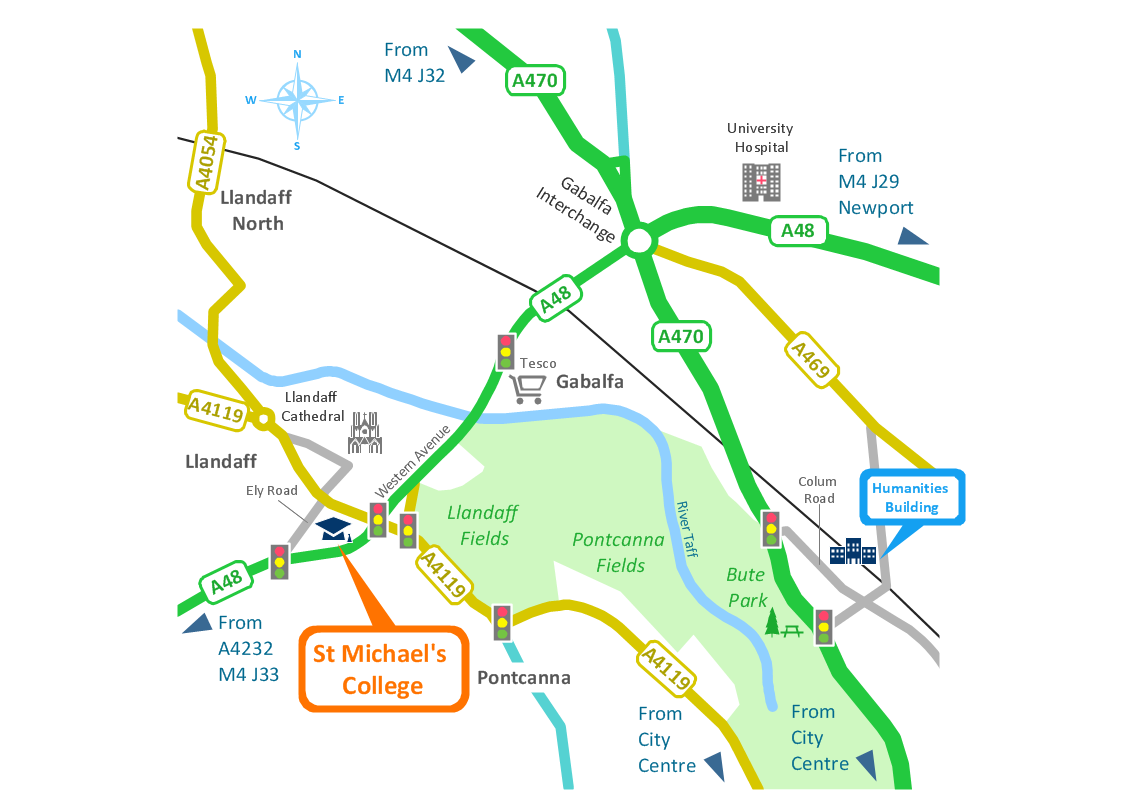
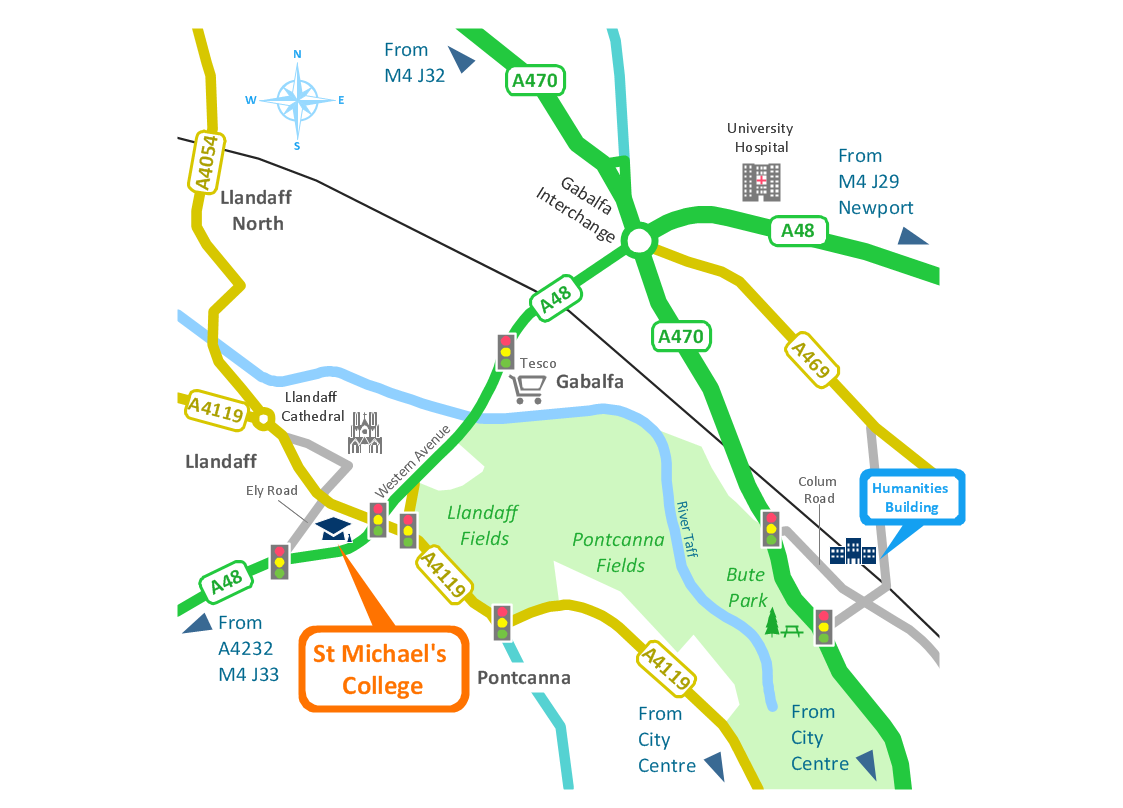
How to Create a Directional Map Using ConceptDraw PRO
Travelers often use directional maps to find directions for certain places. These maps are guide millions of tourists to explore towns and cities worldwide. Searching addresses on a map, view nearby businesses, get driving directions - this is only a little of what directional maps is needed. ConceptDraw PRO allows you to create various kinds of directional maps. You can easily visualize city maps or destinations with driving directions and traveler information using special vector stencils libraries.How tо Represent Information Graphically
ConceptDraw Infographics is a great visual tool for communicating the large amounts of data and graphic visualization and representations of data and information.Cross-Functional Flowchart
Use of Cross-Functional Flowchart is a clear way of showing each team member’s responsibilities and how processes get shared or transferred between different responsible people, teams and departments. Use the best flowchart maker ConceptDraw PRO with a range of standardized cross-functional flowchart symbols to create the Cross-Functional Flowcharts simply and to visualize the relationship between a business process and the functional units responsible for that process. To draw the most quickly Cross-Functional Flowcharts, Cross Functional Process Maps, or Cross Functional Process Flow Diagrams, start with a Cross-functional flowchart samples and templates from ConceptDraw Solution Park. The ConceptDraw Arrows10 and RapidDraw technologies will be also useful for you in drawing. ConceptDraw PRO supports designing both types - horizontal and vertical Cross-functional flowcharts. A vertical layout makes the accents mainly on the functional units while a horizontal layout - on the process. If you need a Visio alternative in Mac OS X, try ConceptDraw PRO. Its interface is very intuitive and it’s actually much easier to use than Visio, yet somehow it’s just as powerful if not more so. ConceptDraw PRO performs professional quality work and seamless Visio interaction.
Map Infographic Design
ConceptDraw collection of vector elements for infographics design.Spatial infographics Design Elements: Transport Map
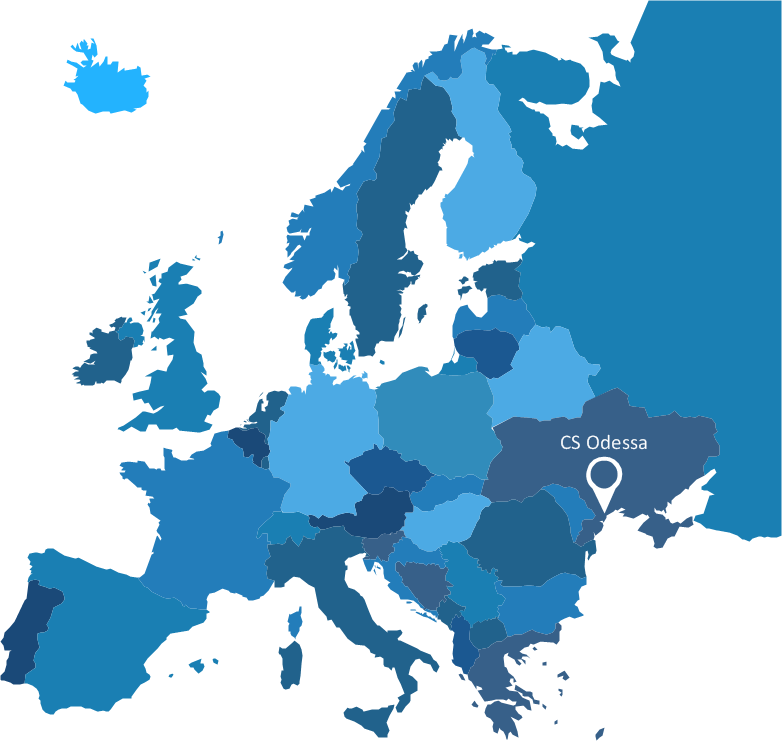
Do you like infographics and data visualization? Creating infographics is super-easy with ConceptDraw.Spatial infographics Design Elements: Continental Map
ConceptDraw PRO is a software for making infographics illustrations. You can work with various components to build really impressive and easy-to-understand infographics design.The Best Flowchart Software Available
ConceptDraw gives the ability to draw Flowchart documents. Flowcharts solutionis a powerful tool that extends ConceptDraw application for drawing business flowcharts. ConceptDraw PRO vector diagramming and business graphics software enhanced with with templates, green and interactive flowchart makers, samples and stencil libraries from ConceptDraw Solution Park which all focused to help with drawing flowcharts, block diagrams, bar charts, histograms, pie charts, divided bar diagrams, line graphs, area charts, scatter plots, circular arrows diagrams, Venn diagrams, bubble diagrams, concept maps, and others.
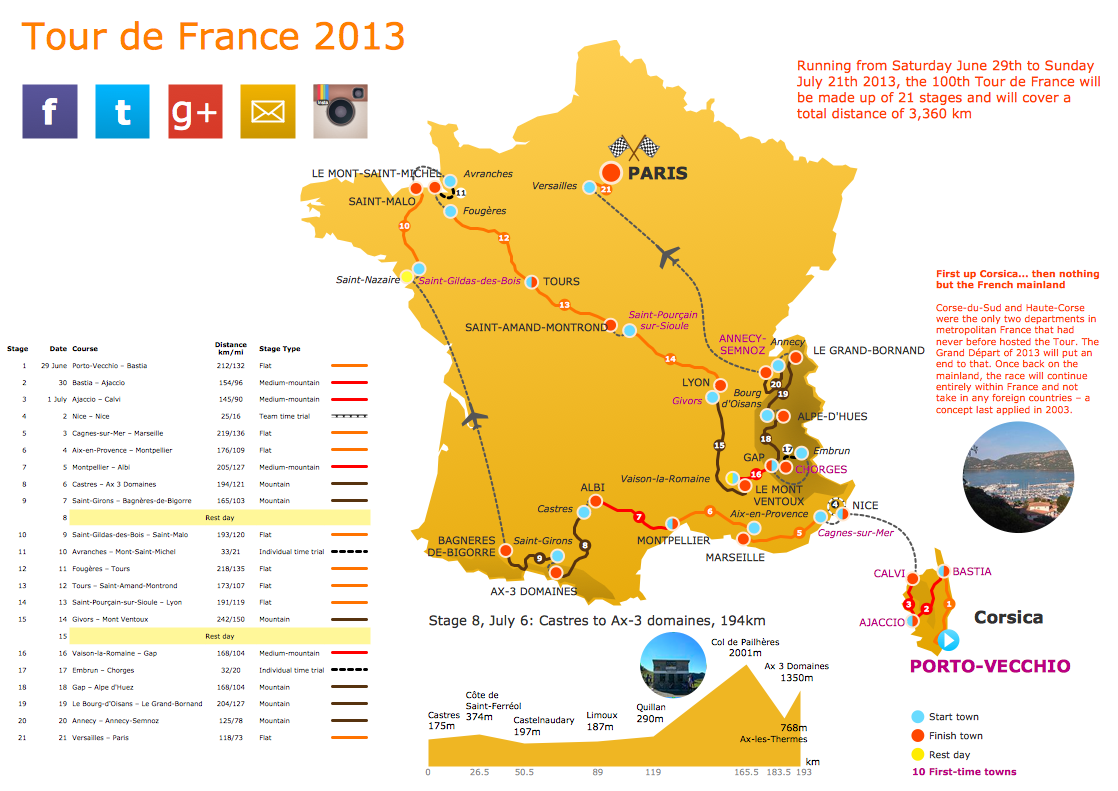
Brilliant Examples of Infographics Map, Transport, Road
ConceptDraw PRO contains spatial infographics samples, map templates to be filled in, and libraries of vector stencils for main design elements of spatial infographics.Geospatial Data
Effective spatial infographics design, easy geospatial data presenting, now it is reality thanks to the extensive drawing tools of the Spatial Infographics Solution included in “Infographics” Area of ConceptDraw Solution Park.Map Infographic Tool
ConceptDraw is a data visualization tool, which can help you to create a map infographics. Anyone can do this, it's that easy!Basic Flowchart Symbols and Meaning
Flowcharts are the best for visually representation the business processes and the flow of a custom-order process through various departments within an organization. ConceptDraw PRO diagramming and vector drawing software extended with Flowcharts solution offers the full set of predesigned basic flowchart symbols which are gathered at two libraries: Flowchart and Flowcharts Rapid Draw. Among them are: process, terminator, decision, data, document, display, manual loop, and many other specific symbols. The meaning for each symbol offered by ConceptDraw gives the presentation about their proposed use in professional Flowcharts for business and technical processes, software algorithms, well-developed structures of web sites, Workflow diagrams, Process flow diagram and correlation in developing on-line instructional projects or business process system. Use of ready flow chart symbols in diagrams is incredibly useful - you need simply drag desired from the libraries to your document and arrange them in required order. There are a few serious alternatives to Visio for Mac, one of them is ConceptDraw PRO. It is one of the main contender with the most similar features and capabilities.
HelpDesk
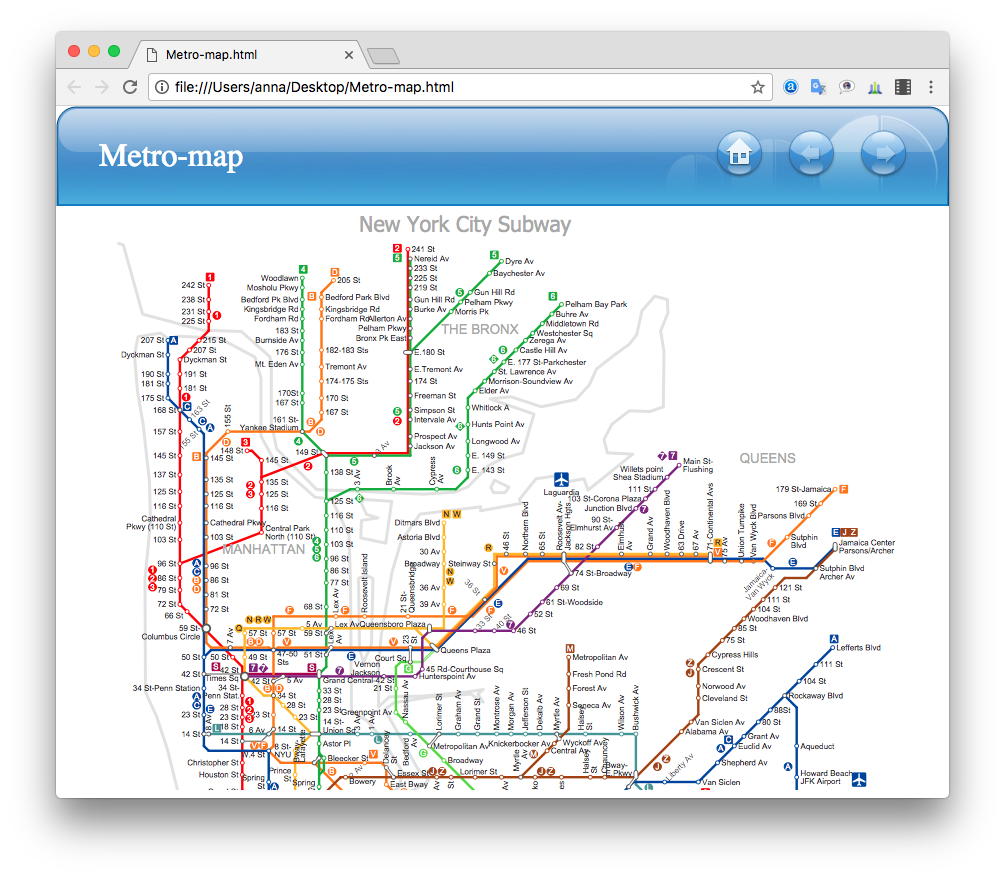
How to Make a Web Page from Your Metro Map
Using ConceptDraw PRO, you can create metro maps, route maps and various transport schemes. It is easy for anyone to build a map, one does not needed to be a cartographer to make good use of the ConceptDraw mapping solutions. Elaborate maps can be quickly assembled and then used on the web, printed, or made into signage. Graphical power and ease of use are built into the ConceptDraw mapping solutions. You can save your drawing as a Web pages. ConceptDraw PRO adds the HTML tags that are needed to display your diagrams in a Web browser, so all you have to do is design their appearance.
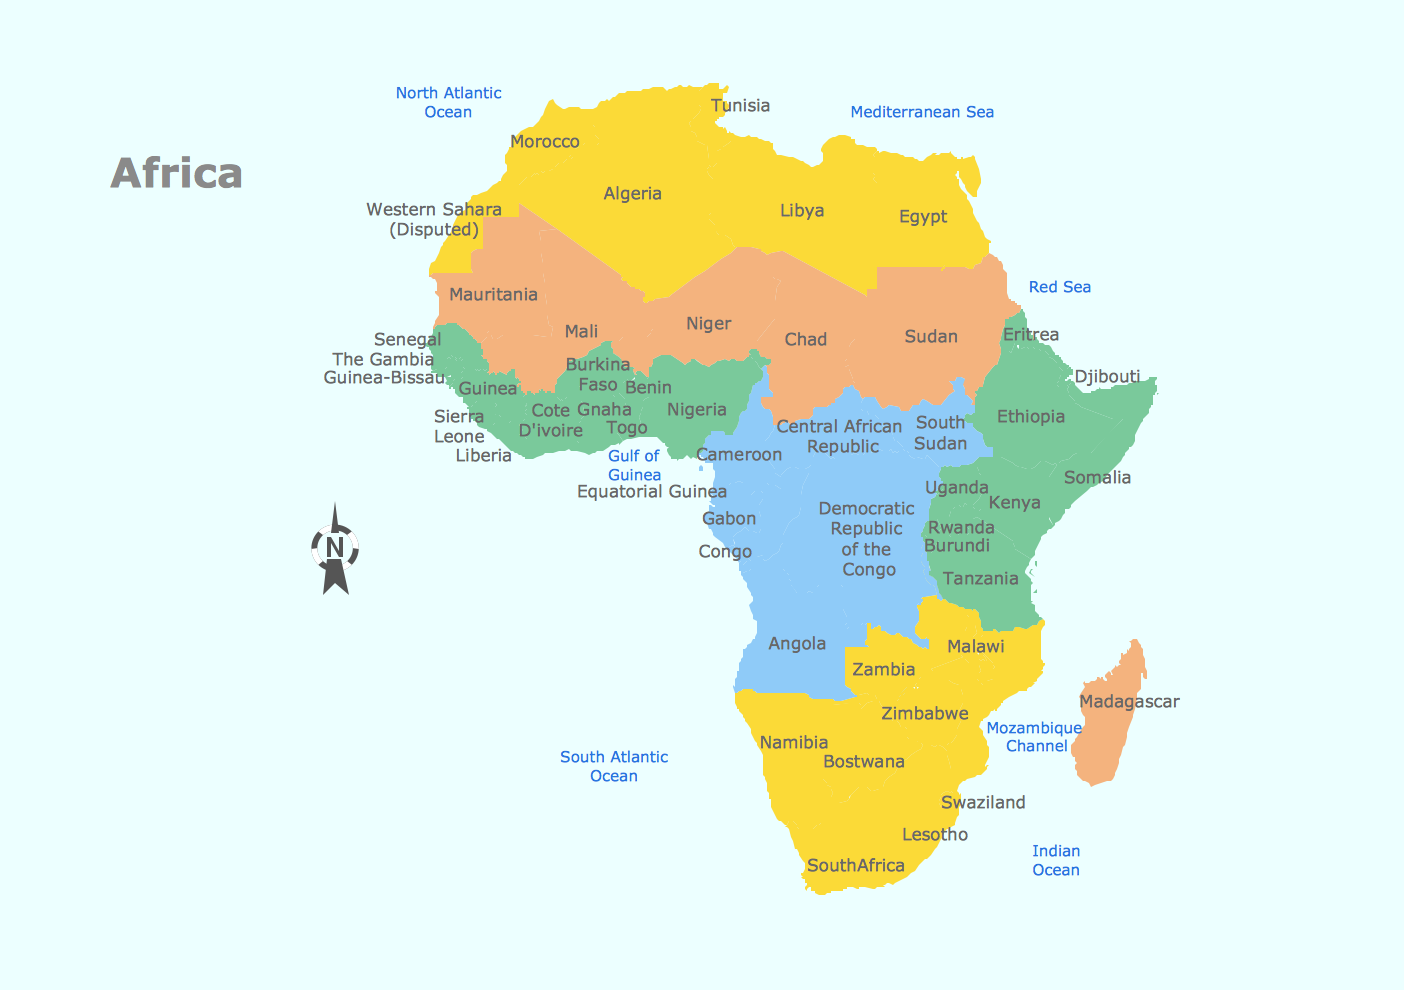
Geo Map - Africa
Africa has 54 fully recognized sovereign states, 9 territories and two de facto independent states with limited or no recognition. Vector design elements library Africa contains country map contours, geographical maps, cartograms and thematic maps for ConceptDraw PRO diagramming and vector drawing software. To help visualize the business and thematic information connected with geographic areas, locations or customs. All ConceptDraw PRO documents are vector graphic files and are available for reviewing, modifying, and converting to a variety of formats: image, HTML, PDF file, MS PowerPoint Presentation, Adobe Flash, MS Visio (.VDX, .VSDX).- Directional Map Drawing Software
- Drawing Simple Road Map Software
- Map Infographic Design | Spatial infographics Design Elements ...
- Simple Way To Draw Road Map
- 2D Directional map
- Software Drawing Directional Map
- Maps | Directional Maps | Map Directions | Road Maps
- Software To Draw Plan And Road Map
- Software To Draw Road Maps
- Directions Maps | Maps and Directions | Directions Map | Drawing ...
- Directional Maps | How to Create a Directional Map Using ...
- Location Map Template
- How To Draw Building Plans | Design elements - Location map ...
- Spatial infographics Design Elements: Location Map | Design ...
- Conceptdraw.com: Mind Map Software, Drawing Tools | Project ...
- Map Infographic Creator | Map Infographic Design | How to draw ...
- Fire Exit Plan. Building Plan Examples | How To Draw Building ...
- Vector Map of Germany | MTA Subway Map | Value Stream Mapping ...
- How to Draw a Map of North America Using ConceptDraw PRO ...

