Process Flowchart
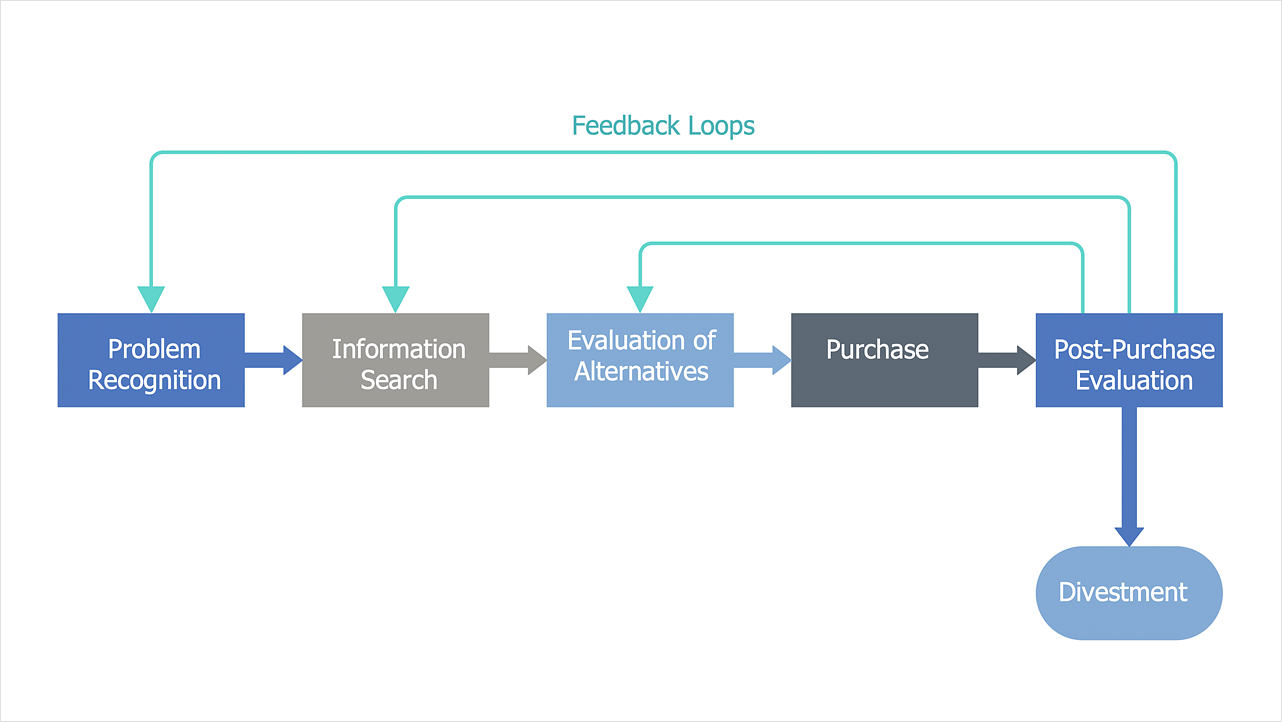
The main reason of using Process Flowchart or PFD is to show relations between major parts of the system. Process Flowcharts are used in process engineering and chemical industry where there is a requirement of depicting relationships between major components only and not include minor parts. Process Flowcharts for single unit or multiple units differ in their structure and implementation. ConceptDraw DIAGRAM is Professional business process mapping software for making Process flowcharts, Process flow diagram, Workflow diagram, flowcharts and technical illustrations for business documents and also comprehensive visio for mac application. Easier define and document basic work and data flows, financial, production and quality management processes to increase efficiency of your business with ConcepDraw DIAGRAM. Business process mapping software with Flowchart Maker ConceptDraw DIAGRAM includes extensive drawing tools, rich examples and templates, process flowchart symbols and shape libraries, smart connectors that allow you create the flowcharts of complex processes, process flow diagrams, procedures and information exchange. Process Flowchart Solution is project management workflow tools which is part ConceptDraw Project marketing project management software. Drawing charts, diagrams, and network layouts has long been the monopoly of Microsoft Visio, making Mac users to struggle when needing such visio alternative like visio for mac, it requires only to view features, make a minor edit to, or print a diagram or chart. Thankfully to MS Visio alternative like ConceptDraw DIAGRAM software, this is cross-platform charting and business process management tool, now visio alternative for making sort of visio diagram is not a problem anymore however many people still name it business process visio tools.
HelpDesk
How to Create a Hook-Up Diagram
Hook-up diagram of the audio-video system is a detailed drawing showing the audio video connections in a correct manner so that the system operates properly. Using the hook-up diagram you can understand how the elements of your audio-video system should be installed. ConceptDraw DIAGRAM allows you to draw the Hook Up diagram of Audio-Video system easily using the set of special libraries provided by Audio and Video Connectors solution.UML Sequence Diagram
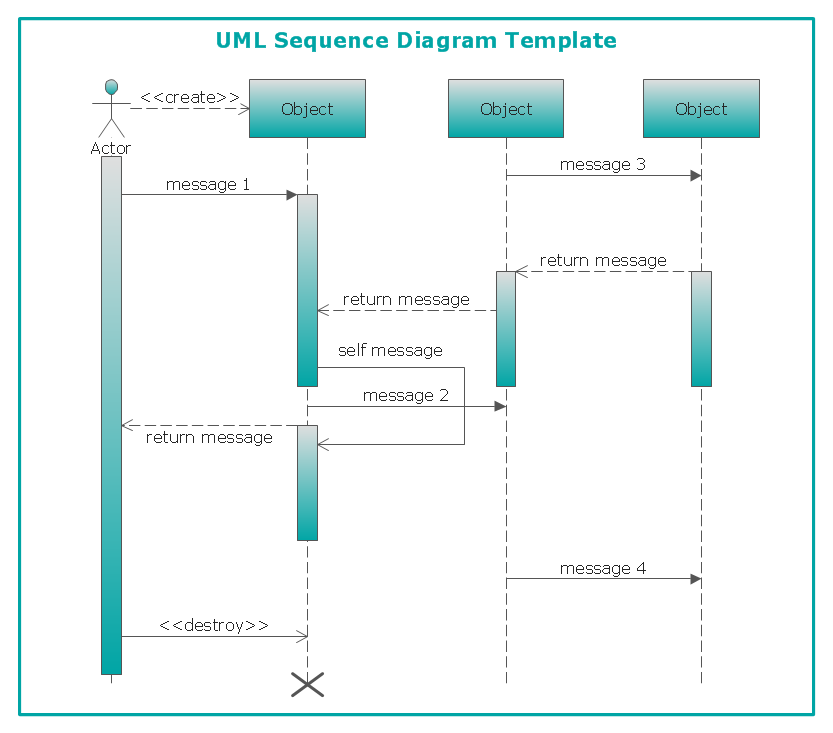
UML Sequence Diagram can be created using ConceptDraw DIAGRAM diagramming software contains rich examples and template. ConceptDraw is perfect for software designers and software developers who need to draw UML Sequence Diagrams.
UML Use Case Diagrams
ConceptDraw has several examples that help you to start using software for designing UML Use Case Diagrams.
Interactive Voice Response Network Diagram
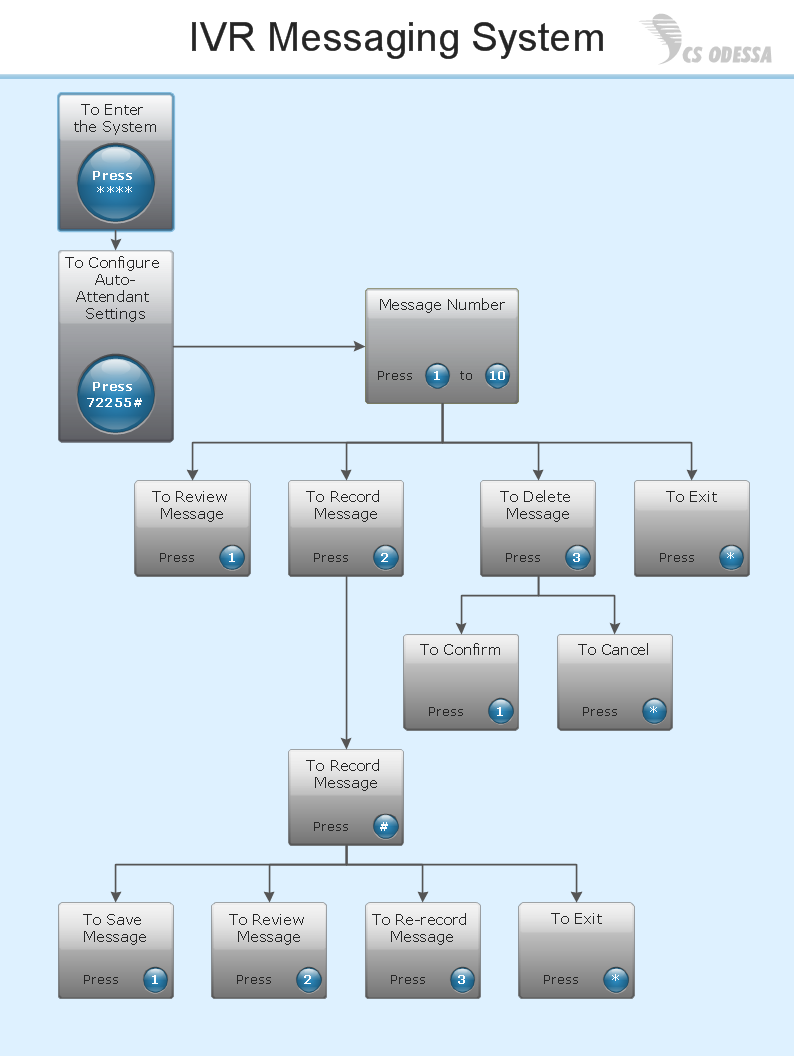
ConceptDraw solution Computer and Networks provides Interactive Voice Response samples, templates and library of 35 vector stencils for drawing the IVR network diagrams. Use ConceptDraw DIAGRAM diagramming and vector drawing software enhanced with solution Computer and Networks to visualize the logical and physical structure of IVR systems for inbound and outbound call centers and voice mail systems.
Interaction Overview Diagram
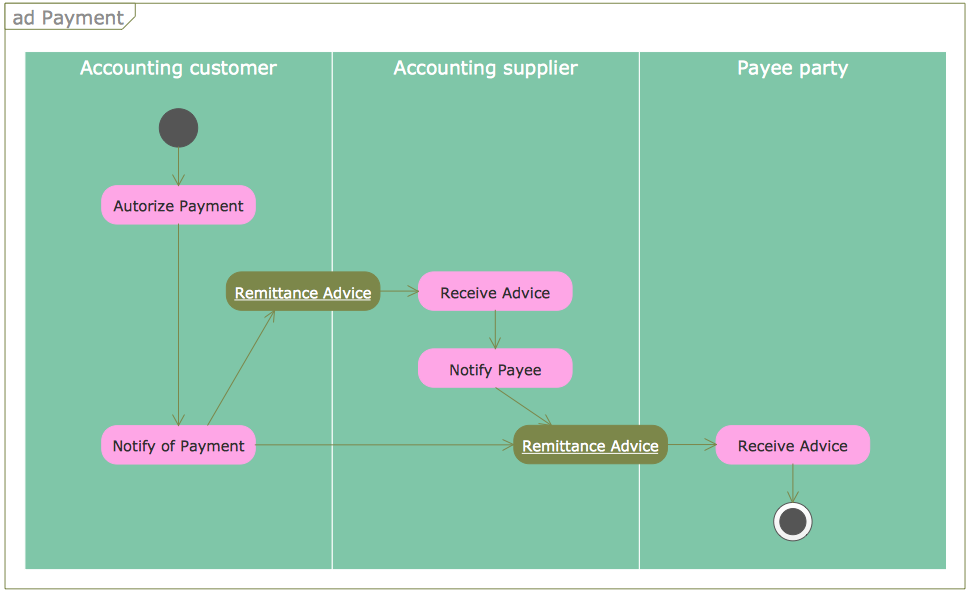
UML Interaction Overview Diagram schematically shows a control flow with nodes and a sequence of activities that can contain interaction or sequence diagrams.
Drawing Illustration
The Nature Solution addition to ConceptDraw Solution Park for ConceptDraw DIAGRAM includes new libraries that provide a wide range nature objects and it can be used in many areas.Network Diagramming with ConceptDraw DIAGRAM
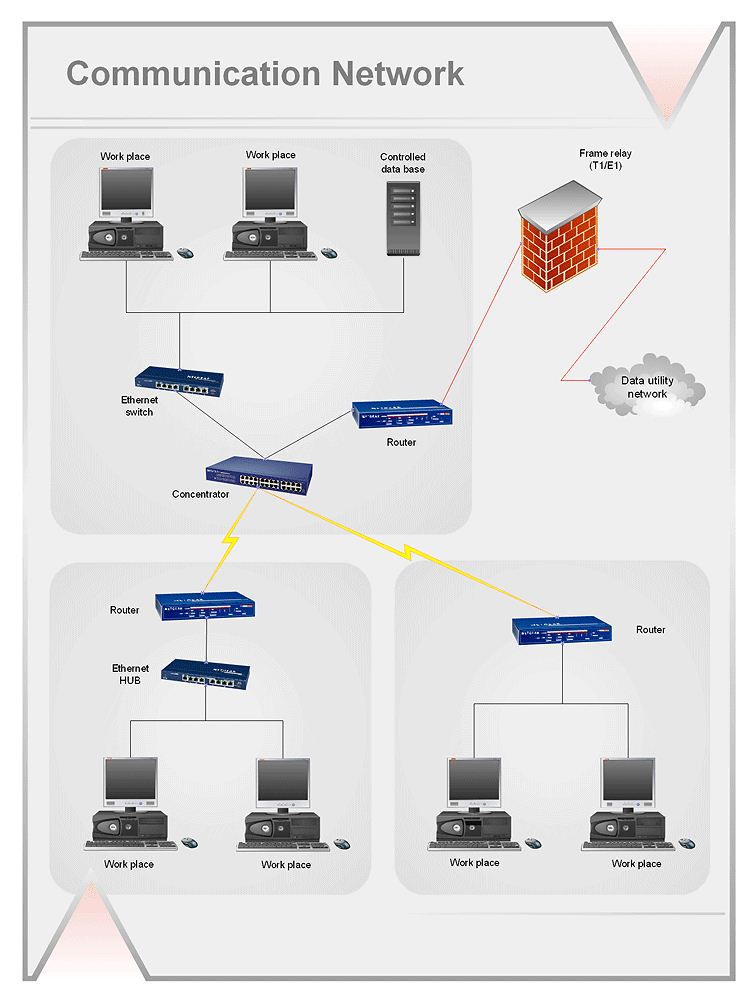
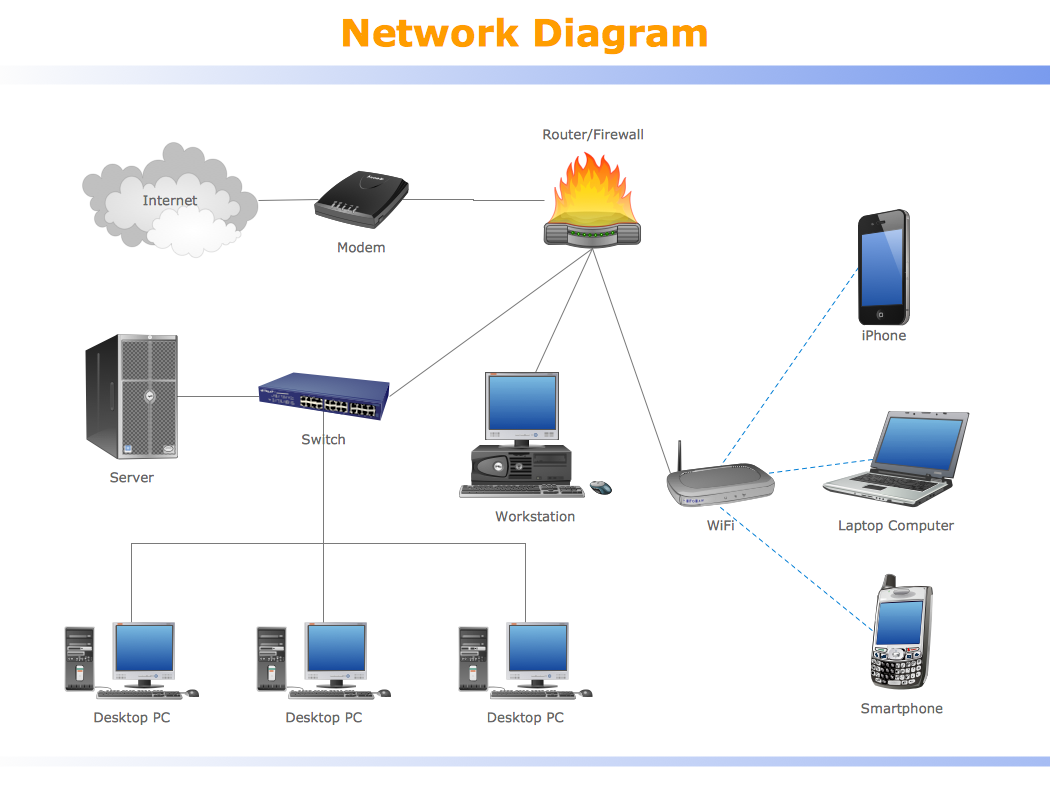
At the moment computer networks are widespread, various types of computer networks are constructed around the world, operate and interact with each other. There are many kinds of computer networks that differ in the transmission medium, in communications protocols, in size, topology, organizational intent, and also in territorial basis. There are popular such types of computer networks as Global Area Network (GAN), Wide Area Network (WAN), Metropolitan Area Network (MAN), Local Area Network (LAN). ConceptDraw DIAGRAM is a powerful network diagramming software, perfect for software engineers, software designers and software developers who need to draw Computer Network diagrams, designs, schematics, and network maps in no time. The pre-drawn shapes representing computers, network devices and smart connectors offered by ConceptDraw solutions help to create the accurate diagrams and documentation, represent computer network topologies and designs, depict Computer network architectures, logical, physical, cable networks, and vehicular networks.Export from ConceptDraw DIAGRAM Document to a Graphic File
Now it’s easy to share your visual documents with other people in a form most convenient for them. ConceptDraw DIAGRAM can save your drawings and diagrams in a number of highly useful formats, including graphic files. You can save your drawing as a.PNG,.JPG, or other graphic format file.
Simple Diagramming
Create flowcharts, org charts, floor plans, business diagrams and more with ConceptDraw DIAGRAM.
Data Flow Diagram
Data Flow Diagram (DFD) is the part of the Structured Systems Analysis and Design Methodology (SSADM), which is intended for information systems projection and analysis. Data Flow Diagrams allow graphically represent the data flows in information system and analyze the data processing during the structural projection. This type of diagrams lets visually show a work of information system and results of this work, it is often used in connection with human processes and can be displayed as Workflow diagram. Data Flow Diagram visualizes processes and functions, external entities, data depositories, and data flows connecting these elements and indicating direction and data character. Each of these elements used for DFD has its own graphical notation. There are two notations to draw DFDs - Yourdon & Coad and Gane & Sarson. ConceptDraw DIAGRAM extended with Data Flow Diagrams (DFD) solution from Software Developmant area is ideal for designing professional looking DFDs, which can be then easily exported in various formats.UML Collaboration Diagram (UML2.0)
UML Collaboration Diagram depicts the interactions between objects or parts in terms of sequenced messages and describes both the static structure and dynamic behavior of a system. Rapid UML solution provides templates, examples and libraries of stencils for quick and easy drawing all the types of system and software engineering diagrams according to UML 2.4 and 1.2 notations.
Timing diagram
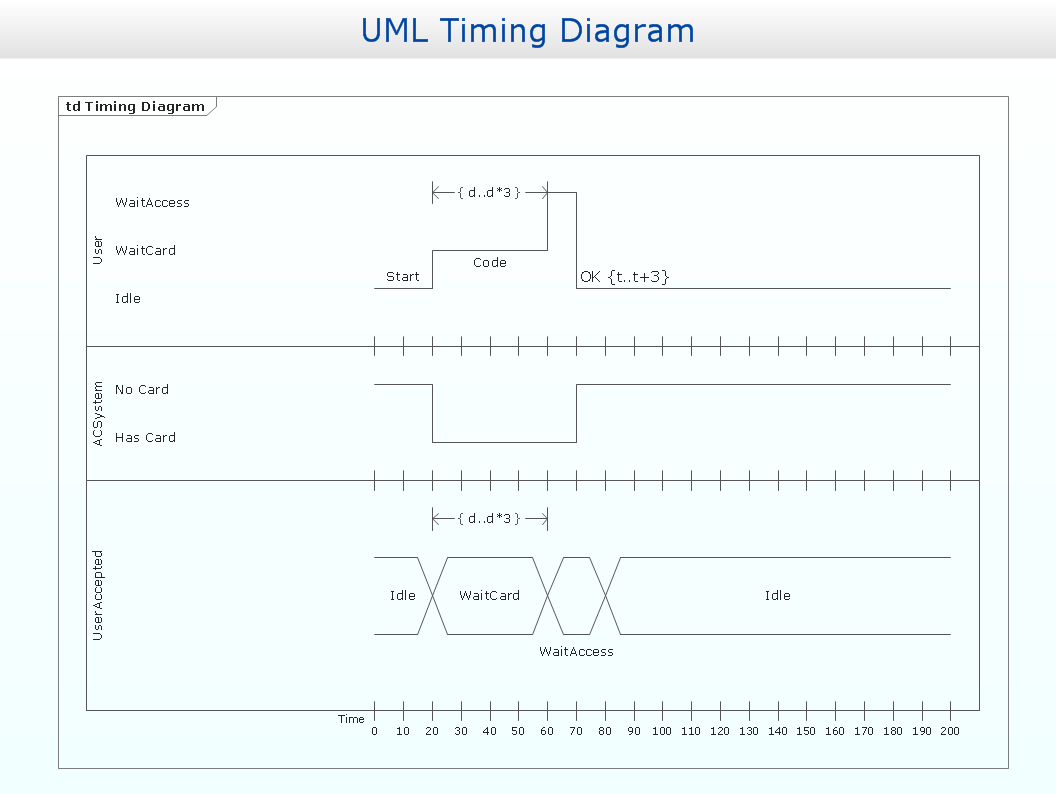
UML Timing Diagram as special form of a sequence diagram is used to explore the behaviours of objects throughout a given period of time.
How to Draw a Computer Network Diagrams
ConceptDraw DIAGRAM enhanced with popular Computer Network Diagrams solution from Computer and Networks area of ConceptDraw Solution Park is a powerful vector graphics and computer network diagramming software. It includes templates, samples and 7 libraries with predesigned vector objects of computer network devices, computer peripheral devices, network hardware, external digital devices, internet symbols, logical symbols, to help IT professionals easily visualize network equipment, to draft and present computer and network installations. It assists create easy and even instantly Computer Network Diagrams of various types and complexity, design Wireless Network Schemes, Network Topologies Diagrams, Computer Network System Designs. The list of five the most popular practical applications of Computer Network Diagrams solution includes documentation, presentations, training, workflows, education. A represented video How to Draw a Computer Network Diagram will help to realize effectively your computer network design process.HelpDesk
How to Create a UML Diagram Quickly
UML diagramming software with rich examples and template. ConceptDraw DIAGRAM is ideal for software designers and software developers who need to draw UML DiagramsHow to Create Flowcharts for an Accounting Information System
Accounting information is a system of interrelated processes which represent financial and accounting data, required for decision making. For representing the accounting processes in a visual and easy for perception form are constructed Accounting Flowcharts. For their creation are used special flowchart symbols, this makes Accounting flowcharts understandable for all users of accounting information system and helps them easy understand the sequence of steps involved to accounting processes. But how to create Flowcharts for an Accounting Information System fast and easy? Use of special design software is useful for this. ConceptDraw DIAGRAM software extended with Accounting Flowcharts solution is the best for creation accurate Accounting Flowcharts, for documentation and visually communication on how accounting processes work, how each operation is done. Accounting Flowcharts solution is supplied with library of predesigned commonly used vector symbols, Accounting Flowchart templates and samples demonstrating receiving, purchasing, payment, and other accounting processes.How To use Switches in Network Diagram
Special libraries of highly detailed, accurate shapes and computer graphics, servers, hubs, switches, printers, mainframes, face plates, routers etc.
How to Draw ER Diagrams
An Entity Relationship (ER) Diagram is a type of flowchart that illustrates the logical structure of databases, how the different entities, such as people, objects or concepts relate to each other within a given system. How to draw ER Diagrams fast and easy? ConceptDraw DIAGRAM diagramming and vector drawing software enhanced with Entity-Relationship Diagram (ERD) solution from Software Development area of ConceptDraw Solution Park offers you the powerful abilities of designing the ER Diagrams and ERD drawings without efforts. This solution includes a lot of predesigned icons advocated by popular Chen's and Crow’s Foot notations, which can be used when describing an enterprise database and depicting it by abstract way. Simply drag the required objects to ConceptDraw document, connect them in a desired way and make style settings. But the easiest and fastest way of drawing ERDs is to make them on the base of ready-to-use Chen ERD and Crow's Foot ERD templates, which are both represented at ConceptDraw STORE.Wireless Network Drawing
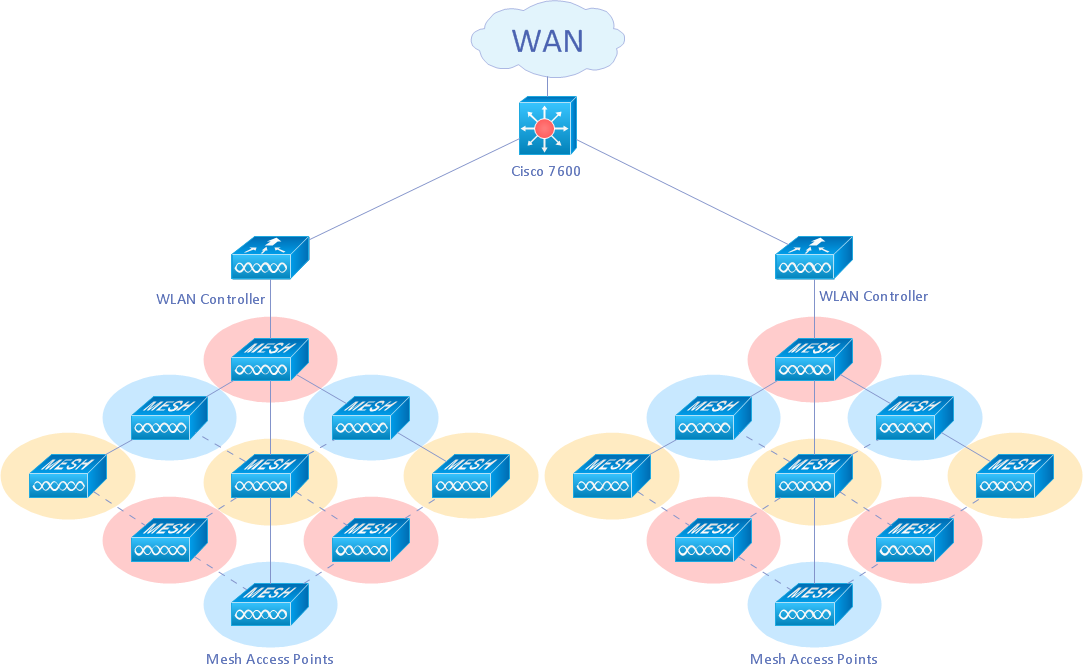
The Wireless Network solution helps users to quickly transition from an idea to the implementation of a wireless computer network. ConceptDraw DIAGRAM is well placed to provide experienced and comprehensive assistance in the workplace. The vector stencils, examples, and templates included to solution is a strong toolset for network engineer.HelpDesk
How to Draw a Block Diagram
Block diagram is a simple chart that use blocks to show some elements or activities, and connectors that show the relationship between neighboring blocks. They are commonly simple, giving an overview of a process without necessarily going into the specifics of implementation. Block diagrams are commonly used to depict a general description of a system and its activity. A most known sample of a block diagram is a flow chart, used in many types of business as a common method of representing repeated processes. Easy and a simple creation, a number of objects and connectors make the block diagram a many-sided tool for various industries. The ability to make block diagrams is delivered by the ConceptDraw Block Diagrams solution.- Process Flowchart | JSD - Jackson system development | Systems ...
- How To Draw System Context Diagram In Staruml
- Data Flow Diagrams (DFD) | Draw System Flow Diagram For Online ...
- How To Draw Architecture Diagram For Project
- How To Draw System Architecture Diagram
- Cloud Computing Architecture Diagrams | How to Create an ...
- How to Create a CCTV Diagram | How To Create CCTV Network ...
- Systems development life cycle | SSADM Diagram | Circular Flow ...
- Process Flowchart | Block Diagram | Functional Block Diagram | Use ...
- UML use case diagram - Banking system | How to Create a Bank ...
- How to Add a Block Diagram to a PowerPoint Presentation | How to ...
- Draw System Block Diagram Software
- Cross-Functional Flowchart | How To Draw System Context Diagram ...
- Financial Trade UML Use Case Diagram Example | How to create a ...
- Data Flow Diagram Process | Accounts Payable Process Flow Chart ...
- Draw And Explain The Layout Electrical Power System
- Process Flow Diagram Symbols | How to Create a Mechanical ...
- UML Deployment Diagram Example - ATM System UML diagrams ...
- 5 Level pyramid model diagram - Information systems types | Draw ...
- Draw A Component Diagram For Library Information System


