Example of DFD for Online Store (Data Flow Diagram)
Data Flow Diagram (DFD) is a methodology of graphical structural analysis and information systems design, which describes the sources external in respect to the system, recipients of data, logical functions, data flows and data stores that are accessed. DFDs allow to identify relationships between various system's components and are effectively used in business analysis and information systems analysis. They are useful for system’s high-level details modeling, to show how the input data are transformed to output results via the sequence of functional transformations. For description of DFD diagrams are uses two notations — Yourdon and Gane-Sarson, which differ in syntax. Online Store DFD example illustrates the Data Flow Diagram for online store, the interactions between Customers, Visitors, Sellers, depicts User databases and the flows of Website Information. ConceptDraw DIAGRAM enhanced with Data Flow Diagrams solution lets you to draw clear and simple example of DFD for Online Store using special libraries of predesigned DFD symbols.
UML Component Diagram Example - Online Shopping
UML Component Diagram Online Shopping. This sample was created in ConceptDraw DIAGRAM diagramming and vector drawing software using the UML Component Diagram library of the Rapid UML Solution from the Software Development area of ConceptDraw Solution Park. This sample shows the concept of the online shopping and is used for the understanding of the online shopping processes, of the online shops working processes, for projection and creating of the online stores.UML Collaboration Diagram (UML2.0)
UML Collaboration Diagram depicts the interactions between objects or parts in terms of sequenced messages and describes both the static structure and dynamic behavior of a system. Rapid UML solution provides templates, examples and libraries of stencils for quick and easy drawing all the types of system and software engineering diagrams according to UML 2.4 and 1.2 notations.
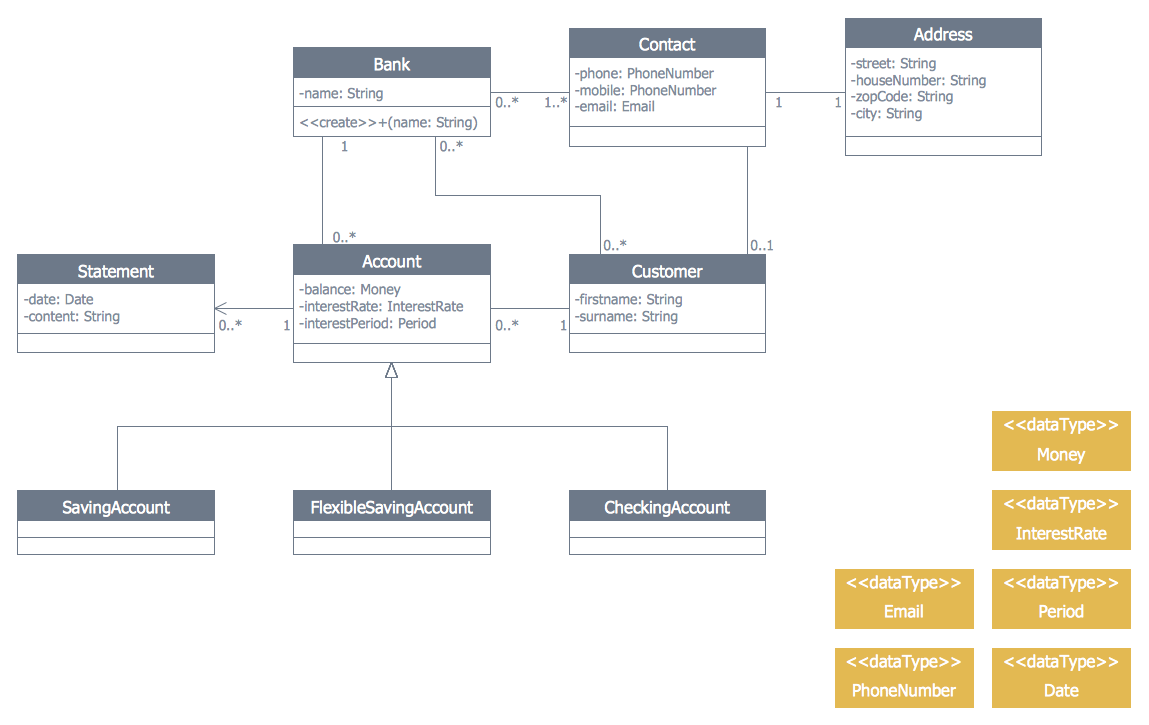
Banking System
ConceptDraw DIAGRAM extended with ATM UML Diagrams Solution from the Software Development Area of ConceptDraw Solution Park is a powerful software for representing the ATM processes, for designing and building banking system and ATMs.Accounting Flowchart: Purchasing, Receiving, Payable and Payment
Accounting flowchart is a system of processes to represent accounting system of an organization. How to create flowcharts for an accounting information system.UML Composite Structure Diagram
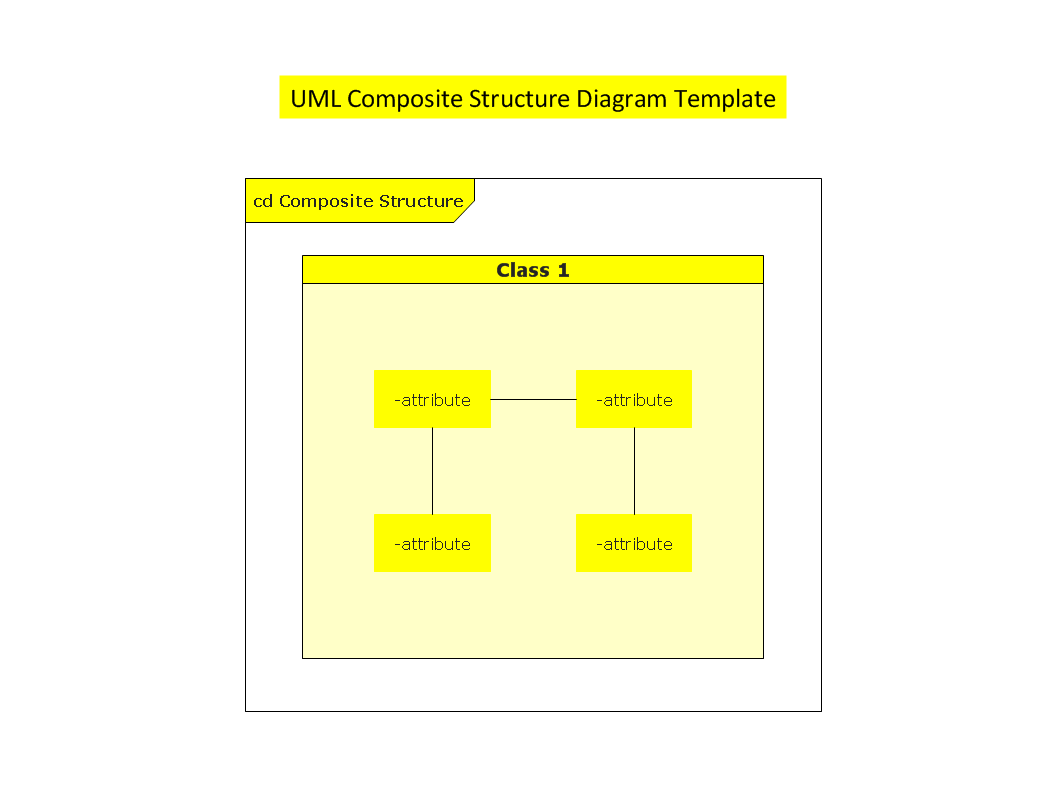
UML Composite Structure Diagram shows the internal structure of a class and the possible interactions at this structure.
Stakeholder Management System
Stakeholder management is a critical component to the successful delivery of any project, programme or activity. ConceptDraw DIAGRAM is a powerful diagramming and vector drawing software. Now, thanks to the Stakeholder Onion Diagrams Solution included to the Management Area of ConceptDraw Solution Park, ConceptDraw DIAGRAM became also unique stakeholder management system design software.Online Diagram Tool
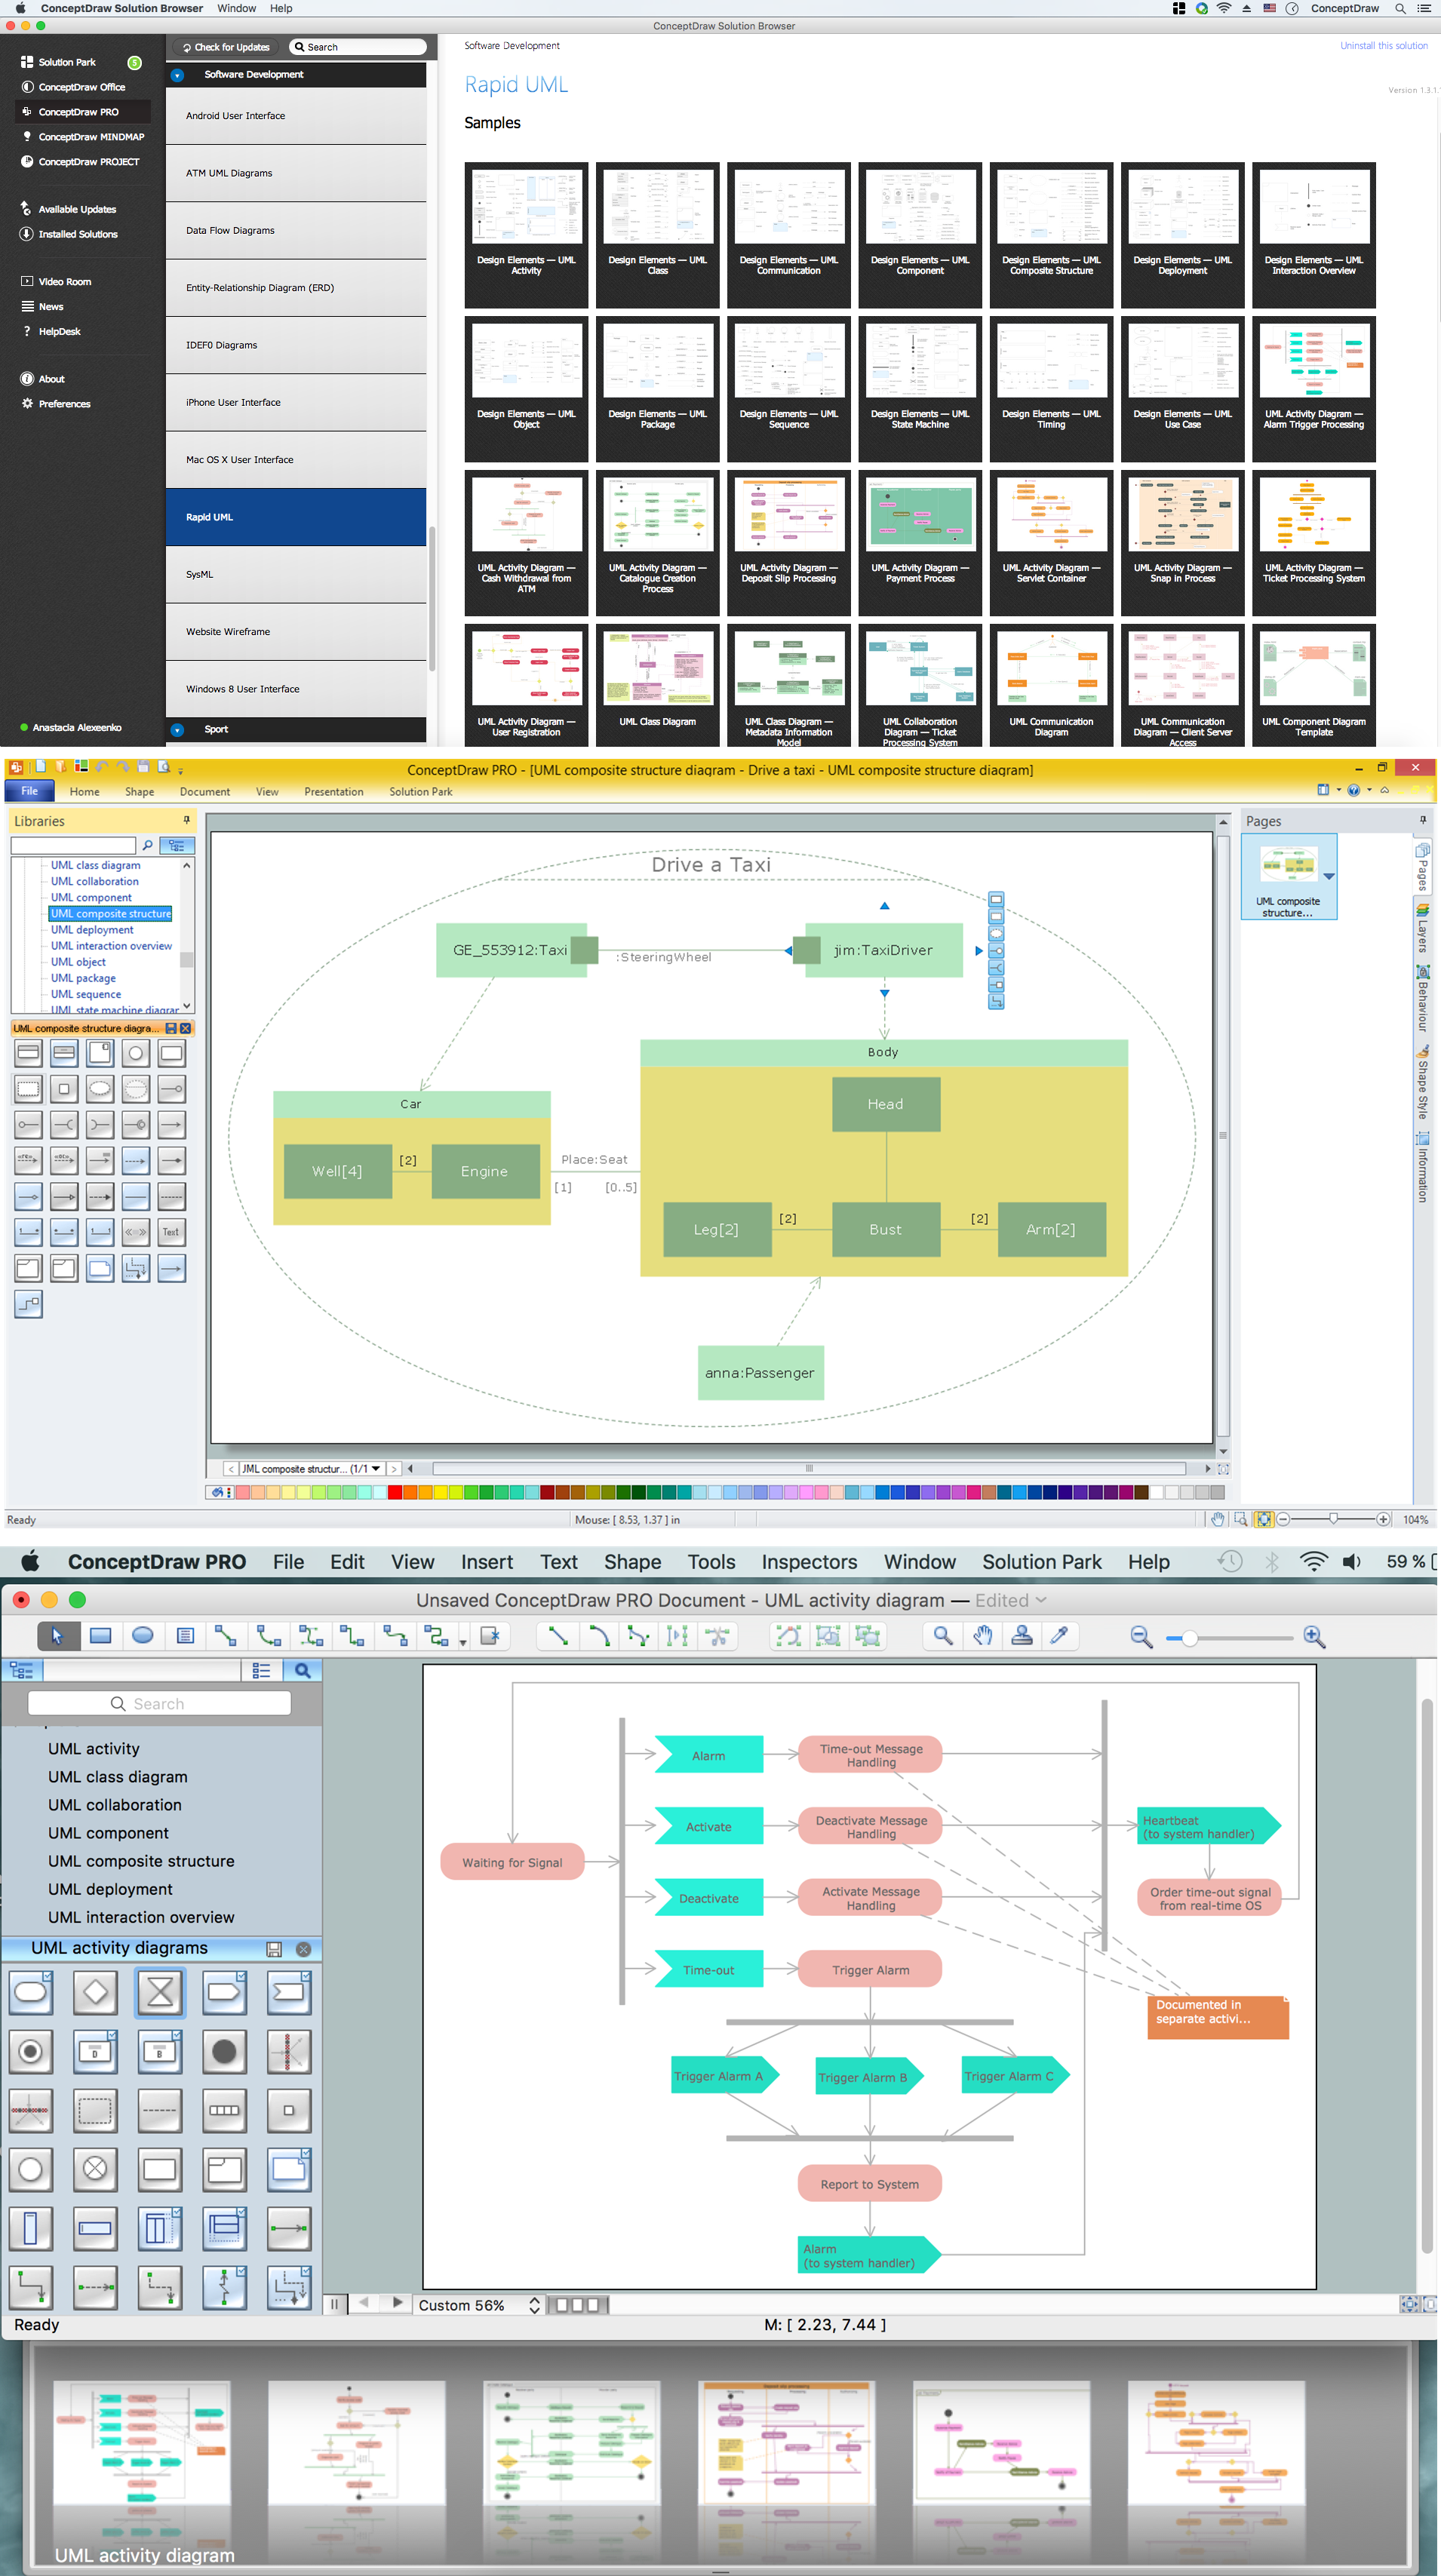
ConceptDraw DIAGRAM diagramming and vector drawing software extended with Rapid UML Solution from the Software Development Area is a powerful online diagram tool that will help you design any types of UML diagrams simply and fast.UML Component Diagram
UML Component Diagrams are used to illustrate the structure of arbitrarily complex systems and illustrates the service consumer - service provider relationship between components.
State Diagram Example — Online Store
This sample was created in ConceptDraw DIAGRAM diagramming and vector drawing software using the UML State Mashine Diagram library of the Rapid UML Solution from the Software Development area of ConceptDraw Solution Park. This sample shows the work of the online store and can be used for the understanding of the online shopping processes, for projection and creating of the online store.Purchasing Flow Chart. Purchasing Flowchart Example
This sample shows the Purchasing Flow Chart Diagram that displays the money flow in the carbon offset sphere. The carbon offsets are the compensatory measures that the companies make for the carbon emissions. You can see on this sample the groups that have interests in the carbon offsets and the money flow after the carbon offset vendors sold the carbon offsets.How to create your UML Diagram
The UML diagrams in this Solution are divided into three broad categories: Structure Diagrams; Behavior Diagrams; Interaction Diagrams. The 13 diagrams contained in the Rapid UML Solution offer an essential framework for systems analysts and software architects to create the diagrams they need to model processes from the conceptual level on through to project completion.Purchase Process Flow Chart, Receiving Process Flow Chart, Accounting Flowchart Example.
The purchasing process follows very specific guidelines and includes a purchasing cycle flowchart and receiving process flow chart. Common key elements of purchasing process. It is important to know how purchasing processes work and how each operation is done.UML Class Diagrams. Diagramming Software for Design UML Diagrams
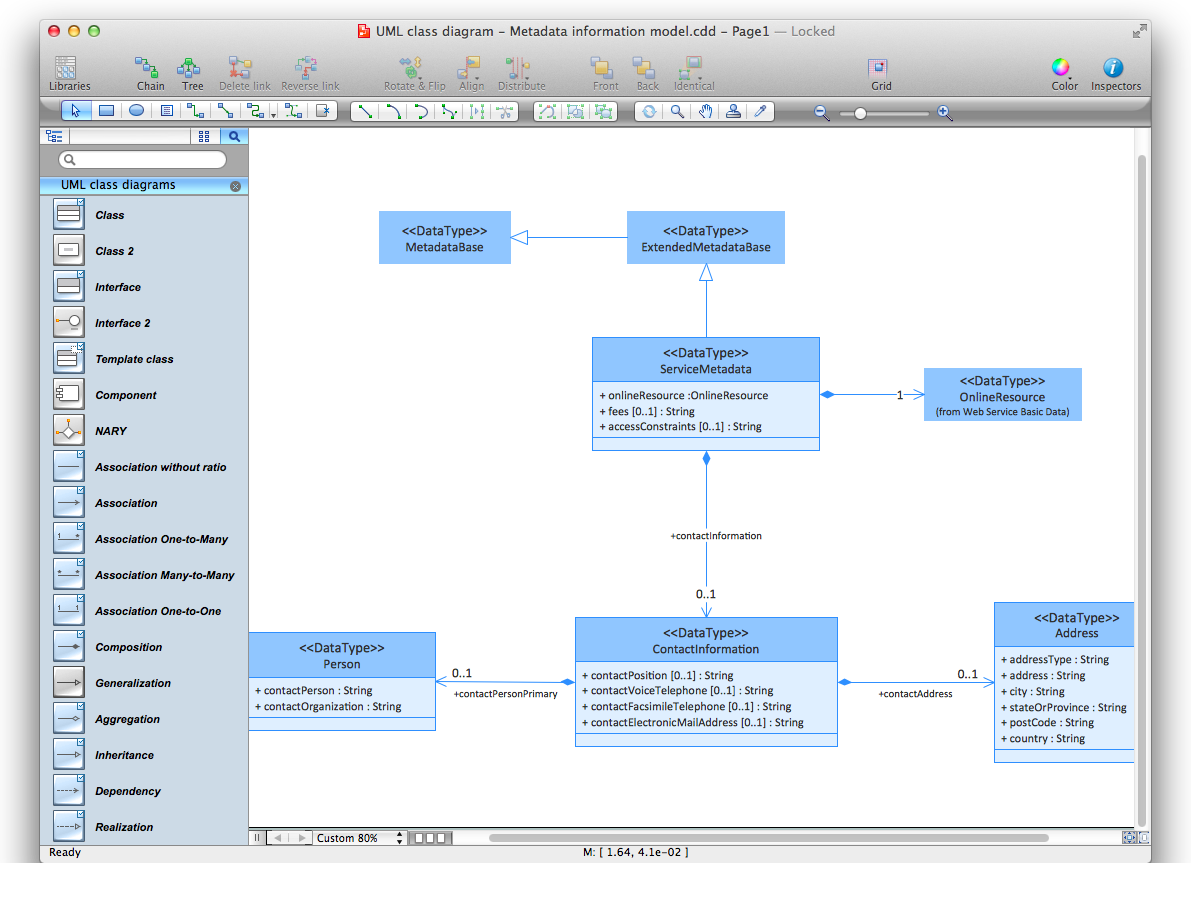
In software engineering, a UML Class Diagrams is a type of static structure diagram that is used both for general conceptual modeling of the systematics of the application, and for detailed modeling translating the models into programming code. Use ConceptDraw DIAGRAM with UML class diagram templates, samples and stencil library from Rapid UML solution to show the classes of system, their attributes, operations or methods, and the relationships among the classes.
UML Diagram for System
This sample shows the UML Class Diagram of delivery system. On this diagram you can see the classes that are connected with aggregation and composition associations indicated with the multiplicity. This sample can be used by delivery services, postal services.Data Flow Diagram Software
Data Flow Diagrams (DFDs) are successfully used when studying the business processes or systems that involve the transfer of data. They are a visual way to represent the data processing, to model and visualize the flow of data through a computer system and functional requirements for a designed system. They are the good business modeling tool to describe the business events and interactions, the physical systems involving the storage and transfer of data. ConceptDraw DIAGRAM supplied with Data Flow Diagrams solution from Software Development area of ConceptDraw Solution Park is a modern and powerful data flow diagram software. This solution offers large set of predesigned DFD vector objects, grouped to three libraries: Data Flow Diagrams, Gane-Sarson Notation, and Yourdon and Coad Notation. All they and also collection of DFD samples and built-in templates make a good base for ConceptDraw DIAGRAM users, providing them all conditions for easy creation the Data Flow Diagrams and Data Flow Models of any complexity.Process Flow Diagram
A Process Flow Diagram (PFD) is a diagram which shows the relationships between the main components in a system. Process Flow Diagrams are widely used by engineers in chemical and process engineering, they allows to indicate the general flow of plant process streams and equipment, helps to design the petroleum refineries, petrochemical and chemical plants, natural gas processing plants, and many other industrial facilities. ConceptDraw DIAGRAM diagramming and vector drawing software extended with powerful tools of Flowcharts Solution from the "Diagrams" Area of ConceptDraw Solution Park is effective for drawing: Process Flow Diagram, Flow Process Diagram, Business Process Flow Diagrams.UML Class Diagram Example - Medical Shop
State Diagram UML of Online Store. This sample was created in ConceptDraw DIAGRAM diagramming and vector drawing software using the UML Class Diagram library of the Rapid UML Solution from the Software Development area of ConceptDraw Solution Park. This sample shows the work of the medical shop and is used at the creation of the medical shop or pharmacy project, for understanding the process of shopping in the medical shop, for keeping purchases, for medical supplies.UML Tool & UML Diagram Examples
The Unified Modeling Language (abbr. UML) is a general-purpose modeling language widely used in the field of software development, software engineering, education, science, industry, business. In 1997 the UML was approved as a standard by the OMG (Object Management Group) and in 2005 was published as ISO standard by the International Organization for Standardization. UML is widely and succesfully applied for optimization the process of software systems development and business systems analysis. There are used 14 types of UML diagrams, 7 from them depict structural information, another 7 types represent different types of behavior and aspects of interactions. Design of any automated process is easy with ConceptDraw DIAGRAM and unique Rapid UML solution from the Software Development area, which provides numerous UML examples, templates and vector stencils libraries for drawing all types of UML 1.x and UML 2.x diagrams. Use of predesigned UML diagram examples and templates lets you quickly start drawing your own UML diagrams in ConceptDraw DIAGRAM software.HelpDesk
How to Create a Data Flow Diagram
Data flow diagramming is a highly effective technique for showing the flow of information through a system. Data flow diagrams reveal relationships among and between the various components in a program or system. DFD is an important technique for modeling a system’s high-level detail by showing how input data is transformed to output results through a sequence of functional transformations. The set of standard symbols is used to depict how these components interact in a system. ConceptDraw DIAGRAM allows you to draw a simple and clear Data Flow Diagram using special libraries.- UML Notation | Draw A System Flow Diagram For Online Shopping ...
- Online Shopping System Flow Chart
- System Flow Diagram For Online Shopping System
- Draw System Flow Diagram For Online Shopping Pdf
- Context Level Dfd For Online Shopping System
- Fishbone Diagram | Activity Diagram For Online Shopping System In ...
- Sequence Diagram For Online Shopping Management System
- Data Flow Diagrams (DFD) | Data Flow Model For Online Shopping ...
- Flow Chart Online Shopping
- Data Flow Diagram For Online Shopping Pdf
- Example of DFD for Online Store (Data Flow Diagram ) | UML ...
- Swimlane Diagram For Online Shopping System
- Explanation Of Online Shoping Flow Chart
- UML Class Diagram Notation | UML Tool & UML Diagram Examples ...
- Data Flow Diagram For Online Shopping System Level 0 1 2
- System Flowchart For Online Shopping Pdf
- Example of DFD for Online Store (Data Flow Diagram ) DFD ...
- Draw System Outline Chart And System Flowchart For Online
- Sales Flowcharts | System Flow Chart From Online Shoping


