Percentage Pie Chart. Pie Chart Examples

Data Visualization Solutions

Restaurant Layouts

Donut Chart Templates

This pie chart sample shows the make up of the top one percent of United States wage earners, grouped by occupation. Data for this graph is sourced from the November 2010 report written by Jon Bakija, Adam Cole, and Bradley T. Heim titled "Jobs and Income Growth of Top Earners and the Causes of Changing Income Inequality: Evidence from U.S. Tax Return Data", column "2005" in table 2, titled "Percentage of primary taxpayers in top one percent of the distribution of income (excluding capital gains) that are in each occupation", on page 50.
This pie chart sample was redesigned from the Wikimedia Commons file: Percentage of the top 1% wage earners in the United States by occupation (pie chart).svg.
[commons.wikimedia.org/ wiki/ File:Percentage_ of_ the_ top_ 1%25_ wage_ earners_ in_ the_ United_ States_ by_ occupation_ (pie_ chart).svg]
This file is licensed under the Creative Commons Attribution-Share Alike 3.0 Unported license. [creativecommons.org/ licenses/ by-sa/ 3.0/ deed.en]
"The distribution of wealth is a comparison of the wealth of various members or groups in a society. It differs from the distribution of income in that it looks at the distribution of ownership of the assets in a society, rather than the current income of members of that society." [Distribution of wealth. Wikipedia]
The pie chart example "Percentage of the top 1% wage earners in the US by occupation" was created using the ConceptDraw PRO diagramming and vector drawing software extended with the Pie Charts solutiton of the Graphs and Charts area in ConceptDraw Solution Park.
Pie chart

 Pie Charts
Pie Charts are extensively used in statistics and business for explaining data and work results, in mass media for comparison (i.e. to visualize the percentage for the parts of one total), and in many other fields. The Pie Charts solution for ConceptDraw DIAGRAM offers powerful drawing tools, varied templates, samples, and a library of vector stencils for simple construction and design of Pie Charts, Donut Chart, and Pie Graph Worksheets.
Rainfall Bar Chart

Pie Chart

Pyramid Diagram

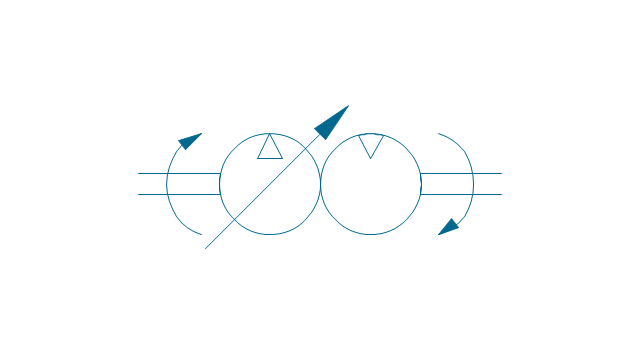
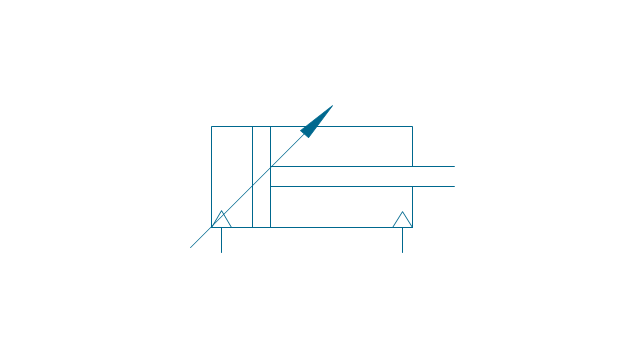
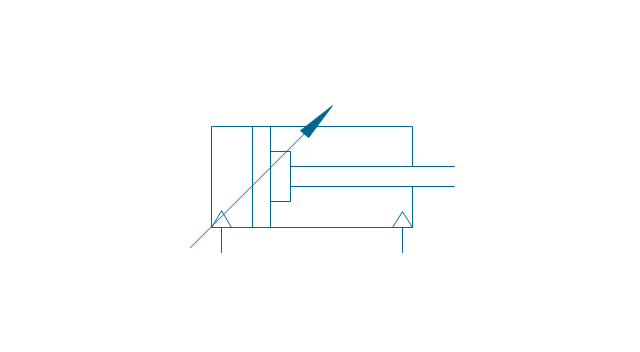
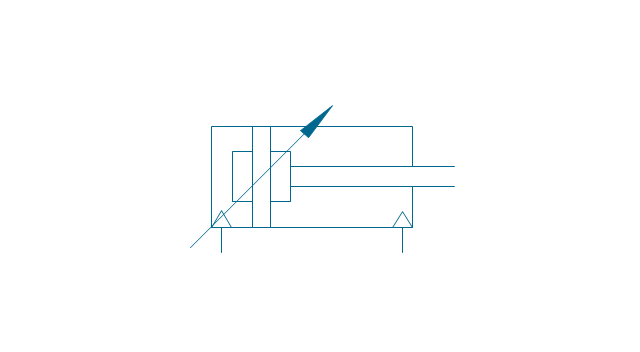
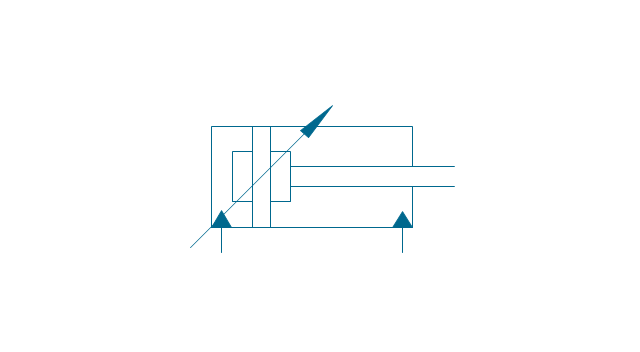
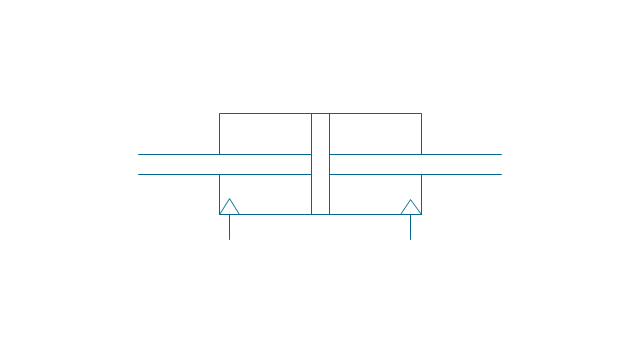
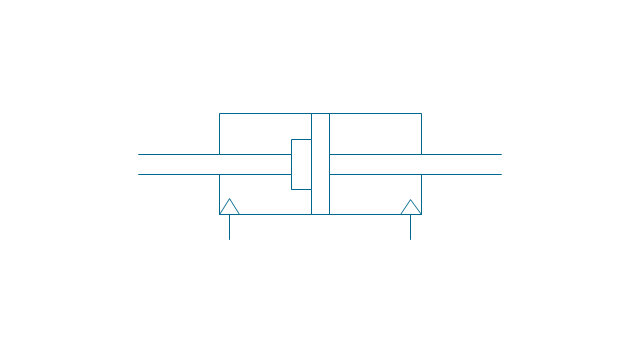
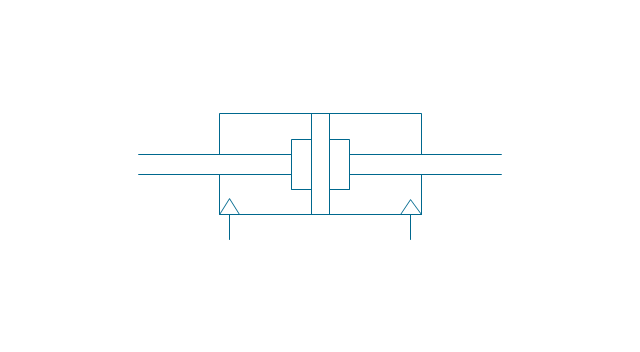
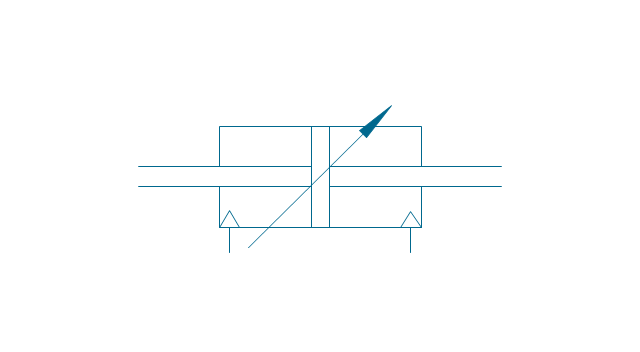
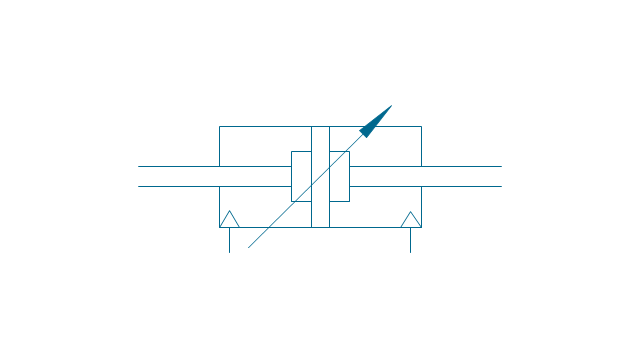
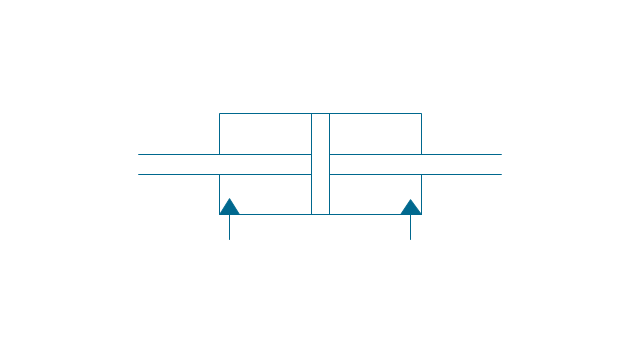
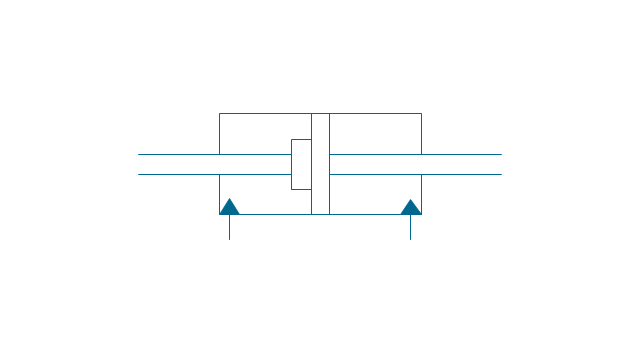
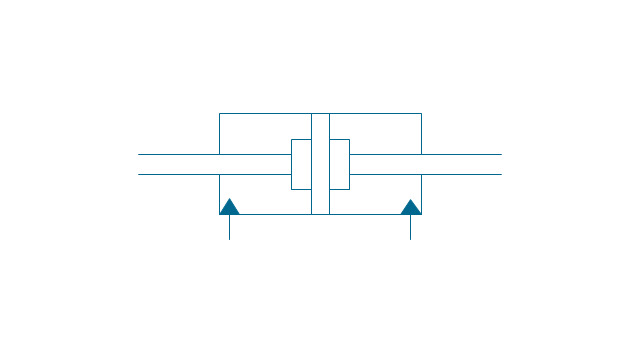
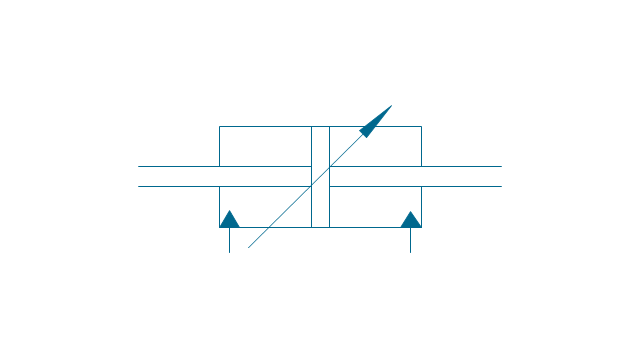
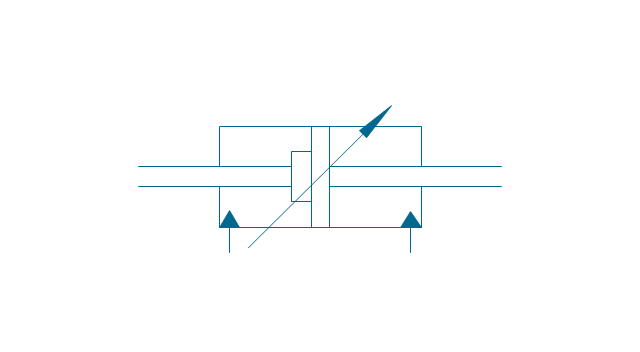
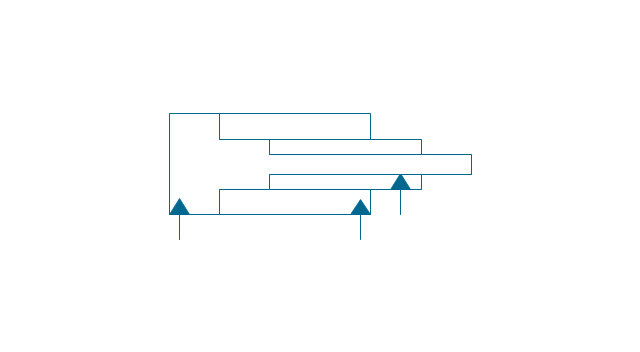
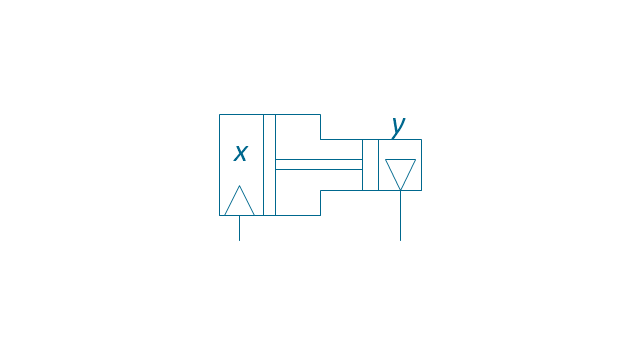
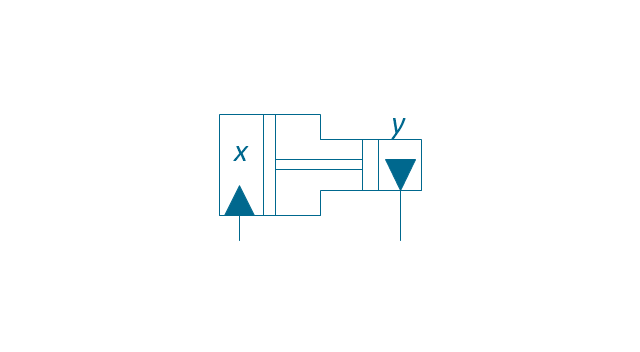
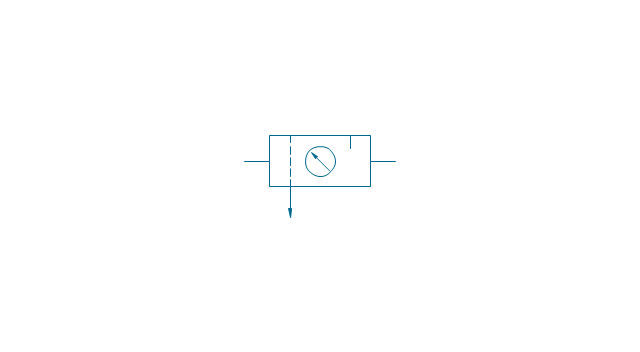
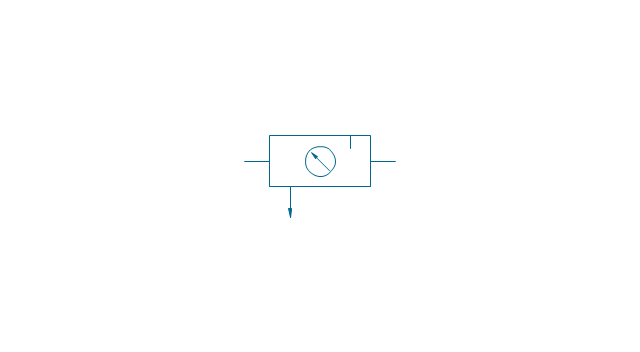
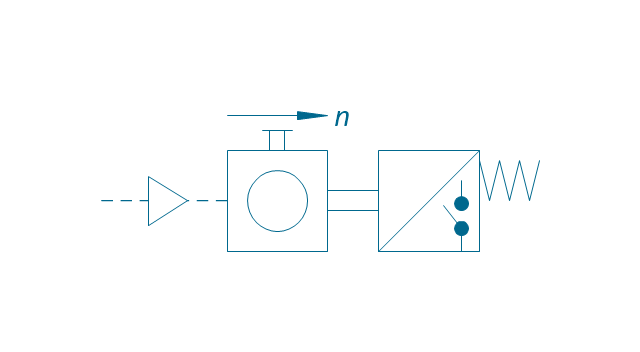
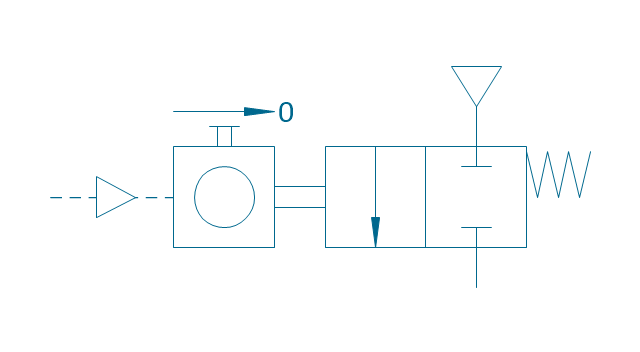
The vector stencils library "Fluid power equipment" contains 113 symbols of hydraulic and pneumatic equipment including pumps, motors, air compressors, cylinders, meters, gauges, and actuators.
Use it to design fluid power and hydraulic control systems in the ConceptDraw PRO diagramming and vector drawing software extended with the Mechanical Engineering solution from the Engineering area of ConceptDraw Solution Park.
www.conceptdraw.com/ solution-park/ engineering-mechanical
Use it to design fluid power and hydraulic control systems in the ConceptDraw PRO diagramming and vector drawing software extended with the Mechanical Engineering solution from the Engineering area of ConceptDraw Solution Park.
www.conceptdraw.com/ solution-park/ engineering-mechanical
Actuator (semi-rotary), pneumatic
,-pneumatic-fluid-power-equipment---vector-stencils-library.png--diagram-flowchart-example.png)
Actuator (semi-rotary), hydraulic
,-hydraulic-fluid-power-equipment---vector-stencils-library.png--diagram-flowchart-example.png)
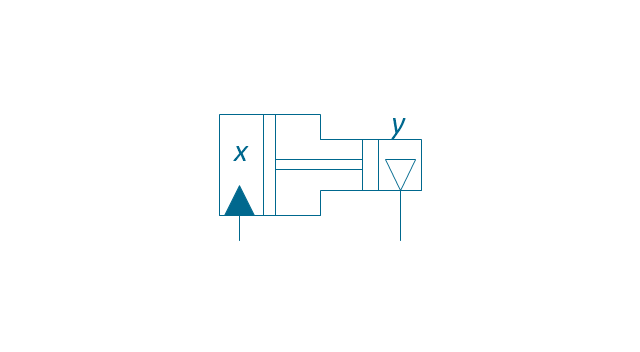
Drive unit, pneumatic
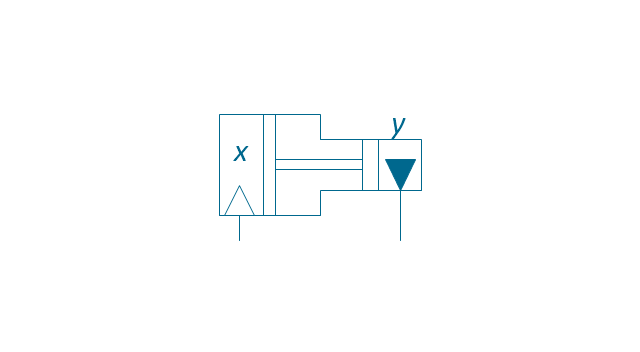
Drive unit, hydraulic

Sgl-act. cylinder, pneum., left spring

Sgl-act. cylinder, pneum., right spring

Sgl-act. cylinder, pneumatic

Sgl-act. cylinder, hydr., left spring

Sgl-act. cylinder, hydr., right spring

Sgl-act. cylinder, hydraulic

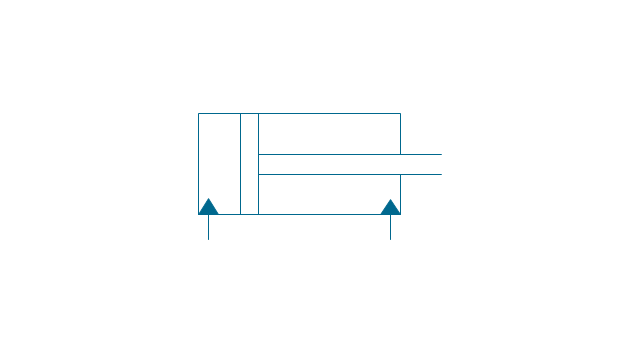
Dbl-act. cylinder, pneumatic

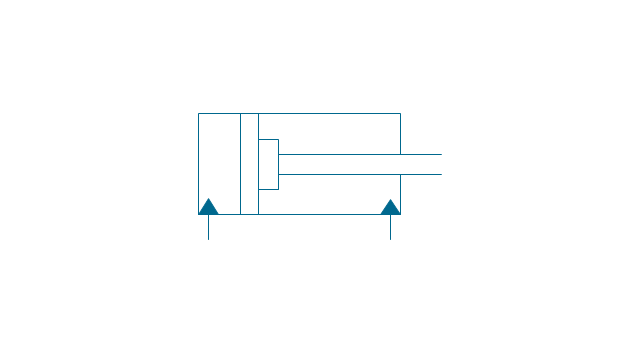
Dbl-act. cylinder, pneum., sgl cushion

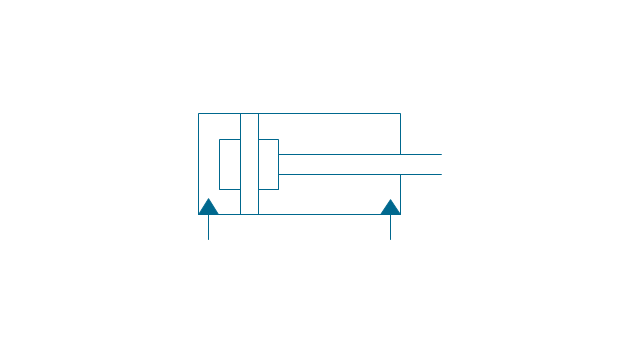
Dbl-act. cylinder, pneum., dbl cushion

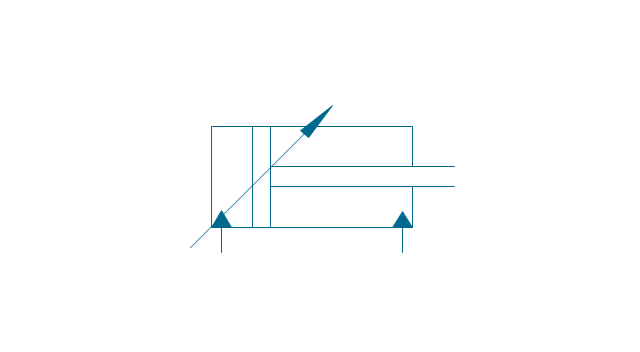
Dbl-act. cylinder, pneum., adjustable
Dbl-act. cylinder, pneum., sgl cushion, adj.
Dbl-act. cylinder, pneum., dbl cushion, adj.
Dbl-act. cylinder, hydraulic
Dbl-act. cylinder, hydr., sgl cushion
Dbl-act. cylinder, hydr., dbl cushion
Dbl-act. cylinder, hydr., adjustable
Dbl-act. cylinder, hydr., sgl cushion, adj.

Dbl-act. cylinder, hydr., dbl cushion, adj.
Dbl-act. cylinder, magnetic

Dbl-act. cylinder, magn., sgl cushion

Dbl-act. cylinder, magn., dbl cushion

Dbl-act. cylinder, magn., adjustable

Dbl-act. cylinder, magn., sgl cushion, adj.

Dbl-act. cylinder, magn., dbl cushion, adj.

Dbl-act. dbl-end. cylinder, pneumatic
Dbl-act. dbl-end. cylinder, pneum., sgl cushion
Dbl-act. dbl-end. cylinder, pneum., dbl cushion
Dbl-act. dbl-end. cylinder, pneum., adjustable
Dbl-act. dbl-end. cylinder, pneum., sgl cushion, adj.

Dbl-act. dbl-end. cylinder, pneum., dbl cushion, adj.
Dbl-act. dbl-end. cylinder, hydraulic
Dbl-act. dbl-end. cylinder, hydr., sgl cushion
Dbl-act. dbl-end. cylinder, hydr., dbl cushion
Dbl-act. dbl-end. cylinder, hydr., adjustable
Dbl-act. dbl-end. cylinder, hydr., sgl cushion, adj.
Dbl-act. dbl-end. cylinder, hydr., dbl cushion, adj.

Telescopic cylinder, pneum., dbl-act.

Telescopic cylinder, hydr., dbl-act.
Telescopic cylinder, pneum., sgl-act.

Telescopic cylinder, hydr., sgl-act.

Actuator, hydraulic-pneumatic

Actuator, pneumatic-hydraulic

Intensifier, pneumatic
Intensifier, hydraulic
Intensifier, hydraulic-pneumatic
Intensifier, pneumatic-hydraulic
Intensifier, pneumatic-hydraulic

Intensifier, hydraulic-pneumatic

Actuator, pneumatic-hydraulic

Actuator, hydraulic-pneumatic

Accumulator

Accumulator, gas loaded

Accumulator, spring loaded

Accumulator, auxiliary gas bottle

Air receiver

Energy source, pneumatic

Energy source, hydraulic

Energy source, electric motor

Energy source, non-electric prime mover

Vented reservoir

Sealed reservoir

Filter

Filter, magnetic element

Filter, contamination indicator

Automatic drain filter separator

Manual drain filter separator

Separator, automatic drain

Separator, manual drain

Air dryer

Lubricator

Air service unit, filter, separator
Air service unit, separator
Air service unit, filter

Air service unit

Liquid cooler

Gas cooler

Cooler

Liquid heater

Gas heater

Heater

Liquid temperature controller

Gas temperature controller

Temperature controller

Liquid temperature controller 2

Gas temperature controller 2

Temperature controller 2

Pressure indicator

Pressure gauge

Differential pressure gauge

Thermometer

Liquid level measuring instrument

Flow indicator

Flow meter

Integrating flow meter

Tachometer

Torque measurement equipment

Pressure switch

Limit switch

Transducer

Pulse counter
Pulse counter 2
Silencer

Drain (inlet below fluid, drain line)
-fluid-power-equipment---vector-stencils-library.png--diagram-flowchart-example.png)
Drain (inlet below fluid, return line)
-fluid-power-equipment---vector-stencils-library.png--diagram-flowchart-example.png)
Drain (inlet above fluid, drain line)
-fluid-power-equipment---vector-stencils-library.png--diagram-flowchart-example.png)
Drain (inlet above fluid, return line)
-fluid-power-equipment---vector-stencils-library.png--diagram-flowchart-example.png)
Oil tank

Oil tank, empty

Air compressor

The vector stencils library "Professions" contains 58 people clipart images of different professions you can use in your presentations, illustrations and infographics.
"Electronic clip art is available in several different file formats. It is important for clip art users to understand the differences between file formats so that they can use an appropriate image file and get the resolution and detail results they need.
Clip art file formats are divided into 2 different types: bitmap or vector graphics. ...
In contrast to the grid format of bitmap images, Vector graphics file formats use geometric modeling to describe an image as a series of points, lines, curves, and polygons. Because the image is described using geometric data instead of fixed pixels, the image can be scaled to any size while retaining "resolution independence", meaning that the image can be printed at the highest resolution a printer supports, resulting in a clear, crisp image. Vector file formats are usually superior in resolution and ease of editing as compared to bitmap file formats, but are not as widely supported by software and are not well-suited for storing pixel-specific data such as scanned photographs. In the early years of electronic clip art, vector illustrations were limited to simple line art representations." [Clip art. Wikipedia]
The clip art example "Professions - Vector stencils library" was created using the ConceptDraw PRO diagramming and vector drawing software extended with the People solution from the Illustration area of ConceptDraw Solution Park.
www.conceptdraw.com/ solution-park/ illustrations-people
Builder 1

System administrator

Worker of conveyor

Clerk 1

Clerk 2

Student 2

Student 3

Student 1

Dispatcher 1

Accountant

Gardener

Lawyer

Jurist

Judge

Consultant

Manager

Director

Programmer

Architect

Pilot

Policeman

Secretary

Security officer

Clerk 3

Musician

Presenter

Athlete

Artist

Announcer

Photographer

Hairdresser

Florist

Spaceman
Engineer

Reporter

Tailor
Dispatcher 2

Biologist

Chemist

Dentist

Priest

Soldier

Doctor

Driver

Carpenter

Fireman

Seaman

Builder 2

Postman

Miner

Waiter

Cleaner

Cashier

Shop assistant

Cook

Flight attendant

Teacher

Hall porter

- Atmosphere air composition | Percentage Pie Chart . Pie Chart ...
- Percentage Pie Chart . Pie Chart Examples | Atmosphere air ...
- Draw A Pie Chart Showing Different Gases And Their Percentage In
- Percentage Pie Chart . Pie Chart Examples | How to Draw the ...
- Percentage Pie Chart . Pie Chart Examples | Sector diagram ...
- Percentage Pie Chart . Pie Chart Examples | Chart Maker for ...
- Percentage Pie Chart . Pie Chart Examples | Exploded pie chart ...
- Percentage Pie Chart . Pie Chart Examples | Atmosphere air ...
- Chart Maker for Presentations | Percentage Pie Chart . Pie Chart ...
- Percentage Pie Chart . Pie Chart Examples | Business Report Pie ...
- How To Display Percentages In Pie Chart
- Percentage Pie Chart . Pie Chart Examples | Percentage of the top 1 ...
- Chart Maker for Presentations | Percentage Pie Chart . Pie Chart ...
- Approximate composition of the air - Pie chart | Pie Chart Showing ...
- Process Flow Diagram | Bar Diagrams for Problem Solving. Create ...
- Percentage of the top 1% wage earners in the US by occupation ...
- Percentage Pie Chart . Pie Chart Examples | Percentage of the top 1 ...
- Org Chart With Percentages
- Percentage Pie Chart . Pie Chart Examples | Pie Graph Worksheets ...
- Percentage Pie Chart . Pie Chart Examples | Bar Graphs | How to ...