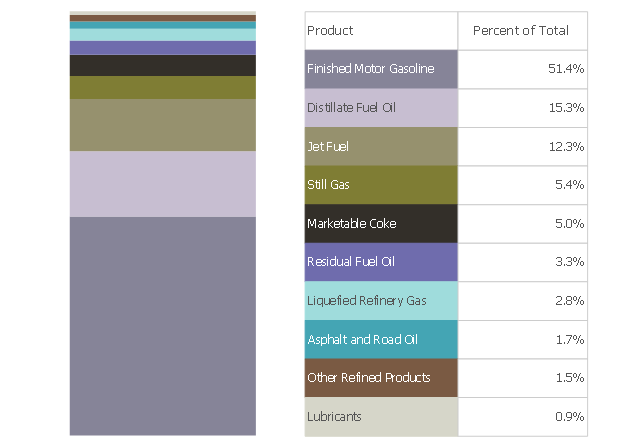
This divided bar chart sample shows the petroleum products yielded from 1 barrel of crude oil in California in 2004. It was drawn using data from the chart on the California Energy Almanac website. [energyalmanac.ca.gov/ gasoline/ whats_ in_ barrel_ oil.html]
"Petroleum products are useful materials derived from crude oil (petroleum) as it is processed in oil refineries. Unlike petrochemicals, which are a collection of well-defined usually pure chemical compounds, petroleum products are complex mixtures. The majority of petroleum is converted to petroleum products, which includes several classes of fuels.
According to the composition of the crude oil and depending on the demands of the market, refineries can produce different shares of petroleum products. The largest share of oil products is used as "energy carriers", i.e. various grades of fuel oil and gasoline. These fuels include or can be blended to give gasoline, jet fuel, diesel fuel, heating oil, and heavier fuel oils. Heavier (less volatile) fractions can also be used to produce asphalt, tar, paraffin wax, lubricating and other heavy oils. Refineries also produce other chemicals, some of which are used in chemical processes to produce plastics and other useful materials. Since petroleum often contains a few percent sulfur-containing molecules, elemental sulfur is also often produced as a petroleum product. Carbon, in the form of petroleum coke, and hydrogen may also be produced as petroleum products. The hydrogen produced is often used as an intermediate product for other oil refinery processes such as hydrocracking and hydrodesulfurization." [Petroleum product. Wikipedia]
The chart example "Petroleum products yielded from one barrel of crude oil" was created using the ConceptDraw PRO diagramming and vector drawing software extended with the Divided Bar Diagrams solution from the Graphs and Charts area of ConceptDraw Solution Park.
Basic Flowchart Examples
ConceptDraw PRO is a business flowchart software includes the wide flowchart examples package.
 Picture Graphs
Typically, a Picture Graph has very broad usage. They many times used successfully in marketing, management, and manufacturing. The Picture Graphs Solution extends the capabilities of ConceptDraw PRO v10 with templates, samples, and a library of professionally developed vector stencils for designing Picture Graphs.
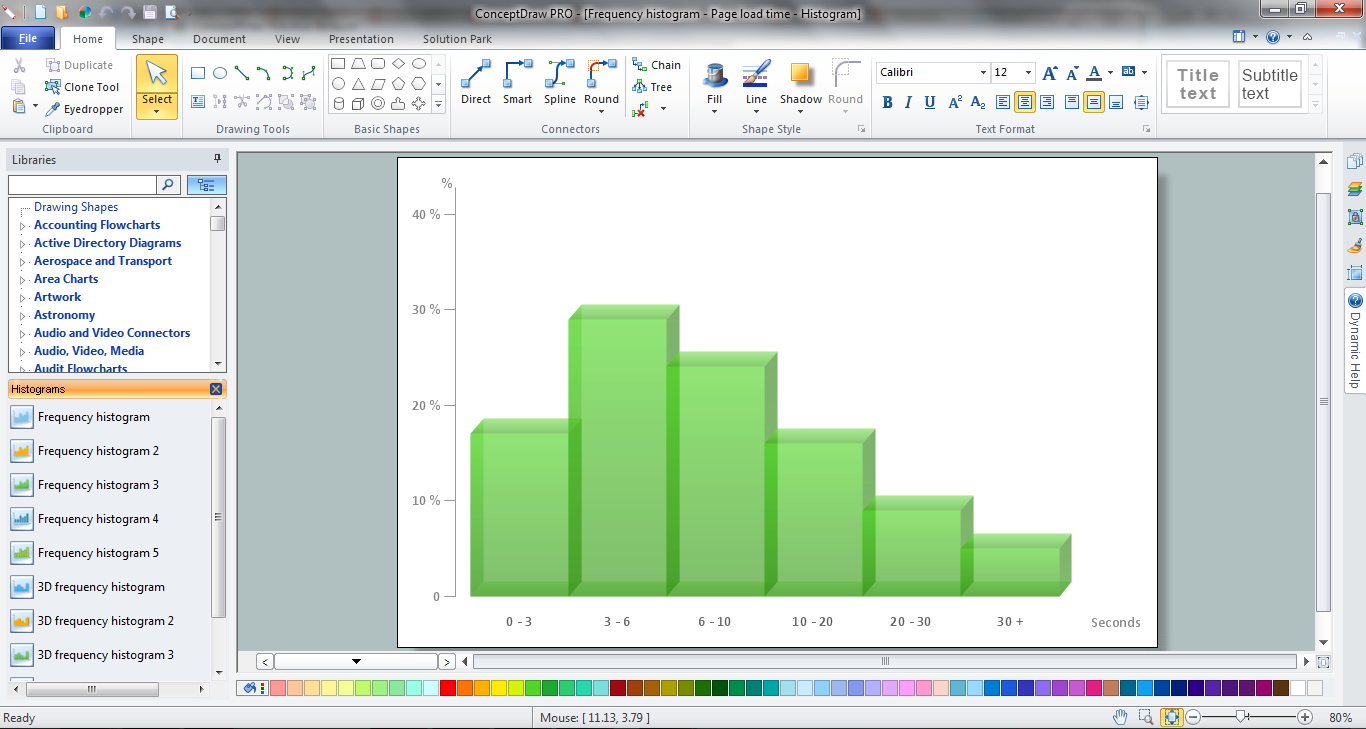
Histogram
ConceptDraw PRO diagramming and vector drawing software offers the Histograms solution from the Graphs and Charts area of ConceptDraw Solution Park with powerful tools to help you draw a Histogram of any complexity quick and easy.Copying Service Process Flowchart. Flowchart Examples
This sample was created in ConceptDraw PRO diagramming and vector drawing software using the Flowcharts solution from the What is a Diagram area of ConceptDraw Solution Park. This sample shows the Flowchart on that it is displayed the process of the determination the permissibility according the Access Copyright license. The diamonds represent the decision points. Inside the diamonds are the questions that need the answer yes/no. It is necessary to answer on the question, make the decision that will determine the next step.
 Aerospace and Transport
This solution extends ConceptDraw PRO software with templates, samples and library of vector clipart for drawing the Aerospace and Transport Illustrations. It contains clipart of aerospace objects and transportation vehicles, office buildings and anci
- How to Draw a Divided Bar Chart in ConceptDraw PRO | Divided ...
- Petroleum products yielded from one barrel of crude oil | Process ...
- Petroleum products yielded from one barrel of crude oil - Divided bar ...
- Petroleum products yielded from one barrel of crude oil - Divided bar ...
- How to Draw a Divided Bar Chart in ConceptDraw PRO | Divided ...
- How to Draw a Divided Bar Chart in ConceptDraw PRO | Divided ...
- Draw A Chart Showing The Refinery Of Crude Oil
- Materials Order Bar Chart Sample
- How to Draw a Divided Bar Chart in ConceptDraw PRO | Rainfall ...
- Market Share Bar Graph
- Divided bar diagram - Template | How to Draw a Divided Bar Chart ...
- Bar Diagrams for Problem Solving. Create space science bar charts ...
- Crude oil distillation unit - PFD | Petroleum products yielded from ...
- Divided Bar Diagrams | How to Draw a Divided Bar Chart in ...
- How to Draw a Divided Bar Chart in ConceptDraw PRO | Divided ...
- Oil And Gas Production Process Flow Diagram
- Bar Chart Template for Word | Bar Chart Template | How to Draw a ...
- Bar Diagram Math | Rainfall Bar Chart | Chart Software for Better ...
- Materials Order Bar Chart
- Divided Bar Diagrams | Divided bar diagram - Template | How to ...


