Flow Chart Creator
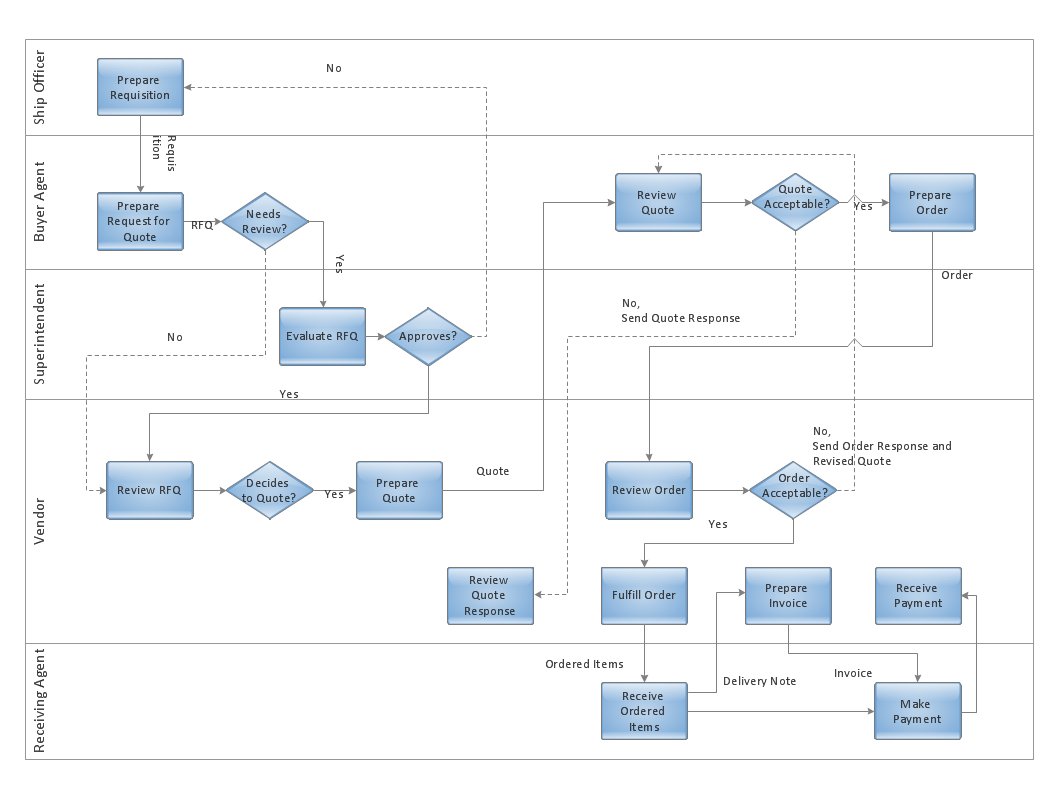
ConceptDraw DIAGRAM is a flowchart design software. There are large collections of professional flowchart symbols for process flow diagrams, standard flowchart symbols and colored basic flowchart symbols. Built-in examples and video lessons allow users to get started immediately and do drawing of virtually any type of flowchart or process flow diagramsBuild a Flowchart Quickly With AutoConnect
ConceptDraw DIAGRAM is a professional software for building flowcharts quickly with auto-connect technology.ERD Symbols and Meanings
Entity Relationship Diagram (ERD) is a popular software engineering tool for database modeling and illustration the logical structure of databases, which uses one of two notations - Chen's or Crow’s Foot. Crow's foot notation is effective when used in software engineering, information engineering, structured systems analysis and design. Each of these notations applies its own set of ERD symbols. Crow's foot diagrams use boxes to represent entities and lines between these boxes to show relationships. Varied shapes at the ends of lines depict the cardinality of a given relationship. Chen's ERD notation is more detailed way to represent entities and relationships. ConceptDraw DIAGRAM application enhanced with all-inclusive Entity-Relationship Diagram (ERD) solution allows design professional ER diagrams with Chen's or Crow’s Foot notation on your choice. It contains the full set of ready-to-use standardized ERD symbols and meanings helpful for quickly drawing, collection of predesigned ERD samples, examples and templates. ConceptDraw Pro is a great alternative to Visio for Mac users as it offers more features and can easily handle the most demanding professional needs.
Draw Flowcharts with ConceptDraw
Start design your own flowchart with ConceptDraw DIAGRAM and accomplish great results at the moment.
 Venn Diagrams
Venn Diagrams are actively used to illustrate simple set relationships in set theory and probability theory, logic and statistics, mathematics and computer science, linguistics, sociology, and marketing. Venn Diagrams are also often used to visually summarize the status and future viability of a project.
Program to Make Flow Chart
Use ConceptDraw DIAGRAM diagramming and business graphics software for drawing your own PM life cycle flow charts.Use the Best FlowChart Tool for the Job
The ConceptDraw DIAGRAM is a best flow chart tool for the job. The samples and templates included in the basic set allows users to draw any type of a flowchart. The vector stencils created by designers give ability to draw great-looking flowchart. Flowcharts give to users the ability to represent structural data visually.Technical Flow Chart Example
What illustrates a technical flow chart? Technical flow chart is a diagrammatic representation which visually illustrates the sequence of operations that must to be performed to get the problem's solution. ConceptDraw DIAGRAM enhanced with Flowcharts Solution from the "Diagrams" Area of ConceptDraw Solution is a perfect software for drawing Technical Flow Chart Example illustrating the essence and importance of the technical flow chart use.- Trading process diagram - Deployment flowchart | Flow Chart ...
- Settlement Process Flowchart. Flowchart Examples | Trading ...
- Draw Flowcharts with ConceptDraw | Use the Best FlowChart Tool ...
- Diagram Of Aid To Trade
- UML Use Case Diagram Example Registration System | Financial ...
- UML Use Case Diagram Example - Estate Agency | Financial Trade ...
- Block Diagram Of Trade
- Draw 4 Flow Charts Of The Trading Relationship With Other Countries
- Sales Process | Trading process diagram - Deployment flowchart ...
- Procedure In Home Trade
- Sales Process | Sales Steps | Trading process diagram ...
- Import process - Flowchart | Flow Chart Template | Easy Flowchart ...
- Import process - Flowchart | Process Flow Chart Symbols | Basic ...
- Flow Chart Template | Import process - Flowchart | Process Flow ...
- Financial Trade UML Use Case Diagram Example | Entity ...
- How to Draw an Organization Chart | Organizational Structure ...
- Draw And Label A Product Life Cycle Diagram
- Project —Task Trees and Dependencies | Data structure diagram ...
- Telecommunication Network Diagrams | Telecommunication ...
- A Diagram Of A Flow C


