 Organizational Charts
Organizational Charts solution extends ConceptDraw DIAGRAM software with samples, templates and library of vector stencils for drawing the org charts.
Horizontal Orgchart
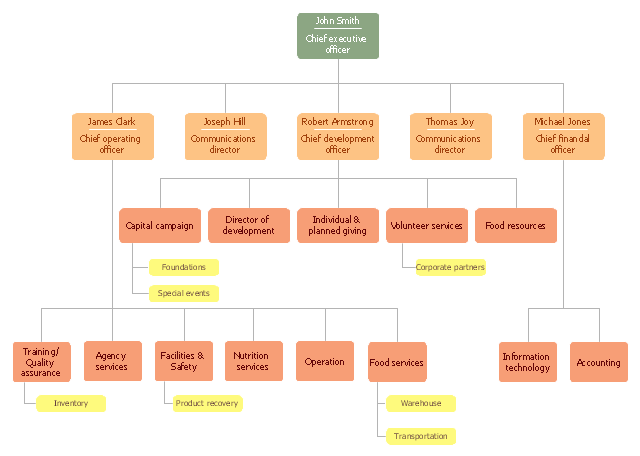
The Organizational Chart is a diagram that shows the structure of the organization and the relationships of its parts. There are many ways to present the Organizational Chart. One of them is the Horizontal Organizational Chart: the parts of the diagram are arranged from left to right, or from right to left. This sample was created in ConceptDraw DIAGRAM diagramming and vector drawing software using the Organizational Charts Solution from the Management area of ConceptDraw Solution Park."A food bank or foodbank is a non-profit, charitable organization that distributes food to those who have difficulty purchasing enough food to avoid hunger.
In the United States and Australia, food banks usually operate on the "warehouse" model. They act as food storage and distribution depots for smaller front line agencies; and usually do not themselves give out food directly to the hungry. After the food is collected, sorted, and reviewed for quality, these food banks distribute it to non-profit community or government agencies, including food pantries, food closets, soup kitchens, homeless shelters, orphanages, and schools.
Outside North America and Australia, the "front line" model is often found. Such food banks give out most or all of their food directly to the end users. For both models, the largest sources of food include for-profit growers, manufacturers, distributors and retailers who in the normal course of business have excess food that they cannot sell. Some foodbanks receive a substantial proportion of their food from individual donors, including their volunteer workers. There is considerable overlap with food salvage, food rescue and gleaning, although not with freeganism or dumpster-diving." [Food bank. Wikipedia]
The organization chart example "Foodbank" was created using the ConceptDraw PRO diagramming and vector drawing software extended with the Organizational Charts solution from the Management area of ConceptDraw Solution Park.
Restaurant Layouts
Developing Restaurant Layouts is very important and responsible moment in restaurant construction and designing. Now it's very simple and fast process thanks to the Cafe and Restaurant Floor Plans solution from the Building Plans area of ConceptDraw Solution Park.Visio Files and ConceptDraw
Visio Files and ConceptDraw. ConceptDraw DIAGRAM is compatible with MS Visio.VDX formatted files.VDX is Visio’s open XML file format, and it can be easily imported and exported by ConceptDraw DIAGRAM.Value Stream Mapping for the Lean Office
Value Stream Mapping for the lean office is a tool that uses a flow diagram to document in great detail every step of a manufacturing process.Presentation
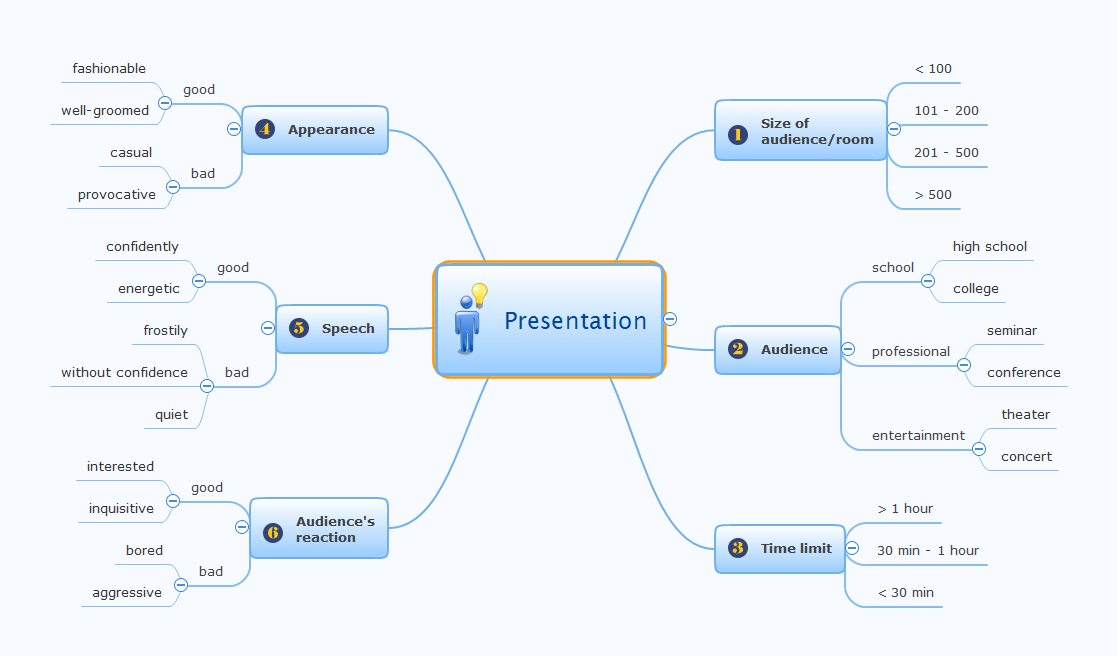
The presentations have become an integral part of live of businessmen, teachers, pupils, students. They are not only convenient and visual way of presenting information, but also provide great opportunities for development creative thinking and implementation creative abilities. Today, the presentations are widely used in schools, universities, on scientific exhibitions, conferences, seminars, in advertising projects, etc. The presentation is an important component when conducting the reports, when presenting new projects and other works. The demonstration of video on a large screen during your speech allows you to focus the audience's attention on key points and to activate not only perception on hearing, but also a visual memory. Thus, the report with presentation is much more effective than simple speech. If your presentation is bright, colorful, clear and correctly presented to the audience, the success in achievement the set goal is guaranteed, but you need to prepare well for this, efficiently work over the material and use the user-friendly software for creating presentations. While preparing a presentation, consider the features of human psychology and perception, try to use as less the text and lists, replace them with illustrative diagrams, graphs, charts, maps. Use ConceptDraw DIAGRAM and ConceptDraw MINDMAP professional software for their easy creation. The offered Mind Map helps organize the various aspects of a presentation.
 25 Typical Orgcharts
The 25 Typical Orgcharts solution contains powerful organizational structure and organizational management drawing tools, a variety of professionally designed organization chart and matrix organization structure samples, 25 templates based on various orga
 Logistics Flow Charts
Logistics Flow Charts solution extends ConceptDraw DIAGRAM functionality with opportunities of powerful logistics management software. It provides large collection of predesigned vector logistic symbols, pictograms, objects and clipart to help you design with pleasure Logistics flow chart, Logistics process flow diagram, Inventory flow chart, Warehouse flowchart, Warehouse management flow chart, Inventory control flowchart, or any other Logistics diagram. Use this solution for logistics planning, to reflect logistics activities and processes of an enterprise or firm, to depict the company's supply chains, to demonstrate the ways of enhancing the economic stability on the market, to realize logistics reforms and effective products' promotion.
- Draw A Diagram Showing The Organisational Structure Of A School
- 25 Typical Orgcharts | Draw Organogram Of A School
- School Organizational Chart And Its Function
- Draw Organisational Structure Of A School
- Draw A Diagram Showing The Organizational Structure Of A Schools
- Organogram Chart For Nigerian Primary School
- Organisational Structure Of A Secondary School In Nigeria
- How to Draw an Organization Chart | Marketing and Sales ...
- Secondary School Organogram Chart
- Nigeria Secondary School Hierarchy Chart


