HelpDesk
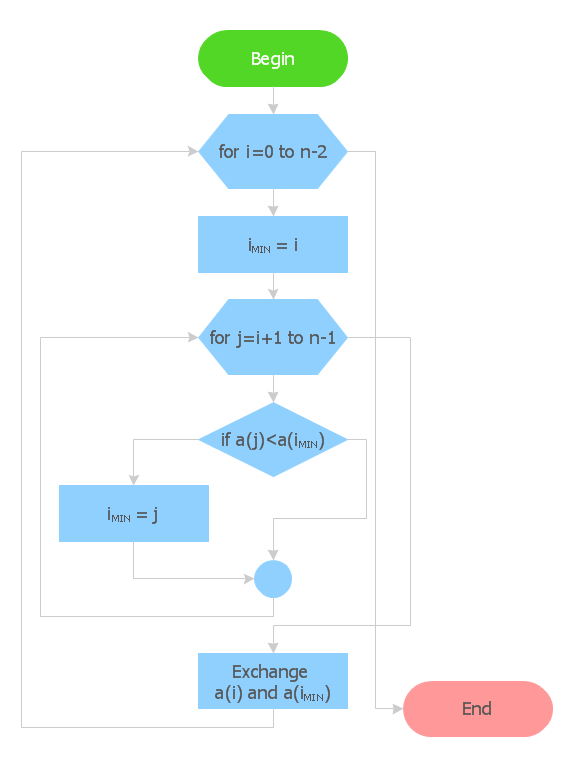
How to Create Flowchart Using Standard Flowchart Symbols
Flowcharts are used to display an algorithm for consistent execution of certain steps. Flowchart is probably the easiest way to make a graphical representation of any process. Flowcharts use the set of standard geometric symbols and arrows to define relationships. ConceptDraw PRO allows you to create professional flowchart quickly and easily. The ability to create flowcharts is contained in the Flowcharts solution. The solution provides a set of special tools for creating flowcharts.
 Winter Sports
The Winter Sports solution from Sport area of ConceptDraw Solution Park contains winter sports illustration examples, templates and vector clipart libraries.
HelpDesk
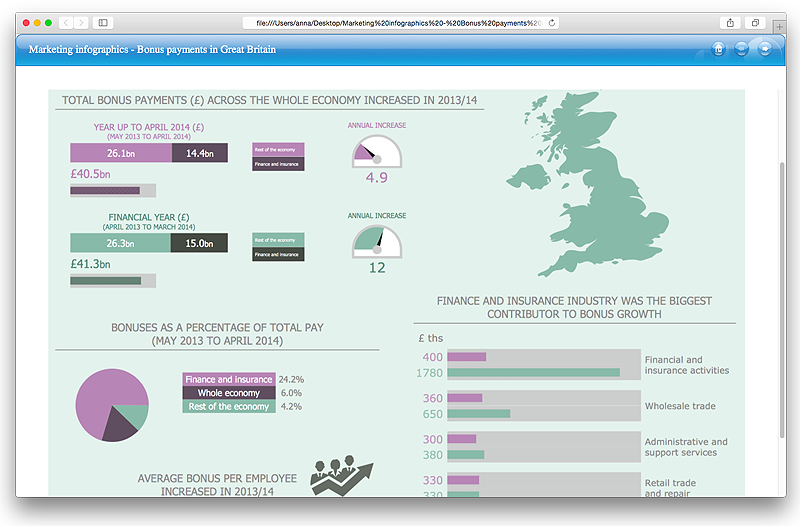
How to Make a Web Page from Infographics
Create your own original marketing illustrations and infographics, presentation slides, website, and blog pages using ConceptDraw PRO.
 ConceptDraw Solution Park
ConceptDraw Solution Park collects graphic extensions, examples and learning materials
HelpDesk
How to Create a Timeline Diagram in ConceptDraw PRO
A Timeline is a chart which displays a project plan schedule in chronological order. A Timeline is used in project management to depict project milestones and visualize project phases, and show project progress. The graphic form of a timeline makes it easy to understand critical project milestones, such as the progress of a project schedule. Timelines are particularly useful for project scheduling or project management when accompanied with a Gantt chart. It captures the main of what the project will accomplish and how it will be done. making a project timeline is one of the most important skills a project manager needs have. Making comprehensive, accurate timelines allows you getting every project off in the best way. ConceptDraw PRO allows you to draw a timeline charts using special library.HelpDesk
How to Draw a Gantt Chart Using ConceptDraw PRO
A Gantt chart is intended to provide a visualization of a project schedule. It is developed to help planning, coordinating, and tracking on project tasks implementation. One of the most critical resources for a project implementation is a time resources. Gantt chart - is one of the most convenient and popular way of graphical representation of a project tasks progress in conjunction with the corresponding time consumption. Gantt chart's function is to show project tasks completion in a progress, and to make a project manager sure that project tasks were completed on time. ConceptDraw Office is a clear and easy-to-use tool for project management. It is a very handy visual tool that helps make a project processing clear.HelpDesk
How to Draw a Pie Chart Using ConceptDraw PRO
A pie chart represents data, in a clear and easy to read round (pie) form. A circular pie chart is divided into sections (slice). Each "slice" depicts the It reflects the proportion of each component in the whole "pie". This type of chart is most often used for the visualization of statistical data. That is why pie charts are widely used in marketing. As pie charts show proportional proportional parts of a whole, they are good for various visual comparisons. For example, it is difficult to imagine a more intuitive way to show segmentation and market share. ConceptDraw PRO allows you to draw a simple and clear Pie Chart using the Pie Charts solution.- Sport Drawing Chart
- Flow Chart for Olympic Sports | How to Make a Web Page from ...
- Sport Field Plans | How To Draw Building Plans | Process Flowchart ...
- Winter Sports | Sport Field Plans | ConceptDraw Solution Park | Bar ...
- Sales Flowcharts | Chemistry | Winter Sports | Draw 20 Flowchart ...
- Flow Chart for Olympic Sports | Process Flow Chart Symbols | Sales ...
- Symbols Of Field Event Sports
- Sports Seating Chart Maker Free
- Building Drawing Software for Design Sport Fields
- Flow Chart for Olympic Sports | Flow Chart Design - How to Design a ...
- How to Draw an Organization Chart | Organizational chart - County ...
- Flow Chart for Olympic Sports | Mac Compatible Remote ...
- Building Drawing Software for Design Sport Fields | Sport Field ...
- Automobile Manufacturing Process Flow Chart Ppt
- Flow Chart for Olympic Sports | Flow Chart Design - How to Design a ...
- How to Draw an Organization Chart | ConceptDraw PRO ...
- Building Drawing Software for Design Sport Fields | Interior Design ...
- Organizational Structure | How to Draw an Organizational Chart ...
- Process Flowchart | Flow Chart for Olympic Sports | Flow Chart ...


