Solar System Symbols
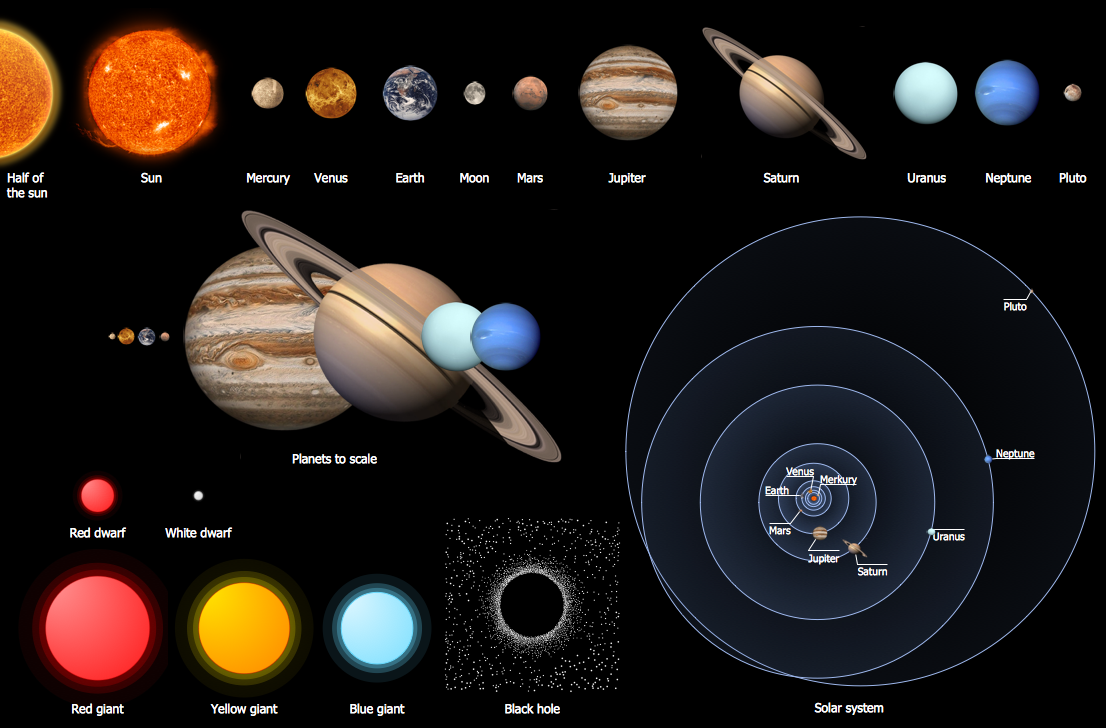
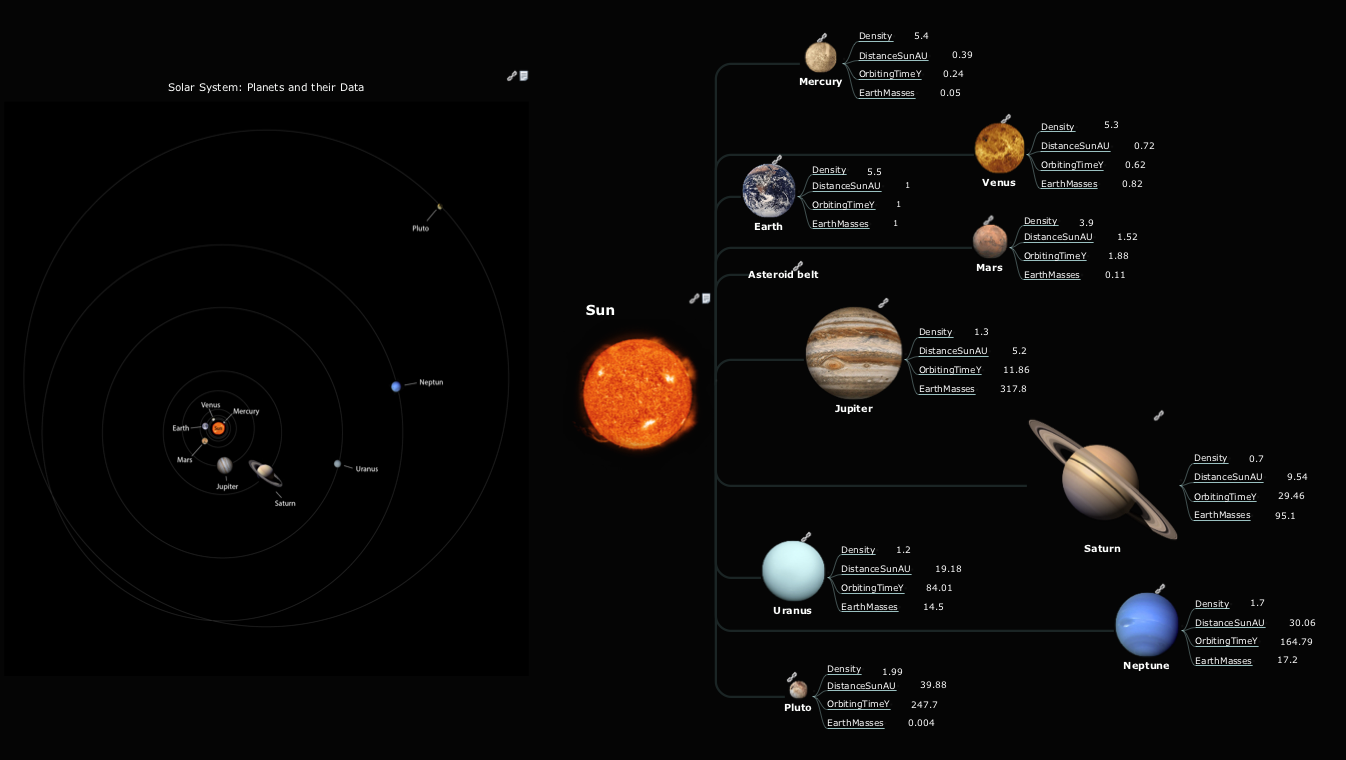
Astronomy solution provides the Stars and Planets library with wide variety of solar system symbols. You can find here vector objects of solar system, of stars and planets of the universe. To quickly draw any astronomy illustration: create new document and simply drag the needed solar system symbols from the Stars and Planets library, arrange them and add the text. You can also use the predesigned templates and samples from the ConceptDraw STORE as the base for your own sun solar system illustrations, astronomy and astrology drawings.Sun Solar System
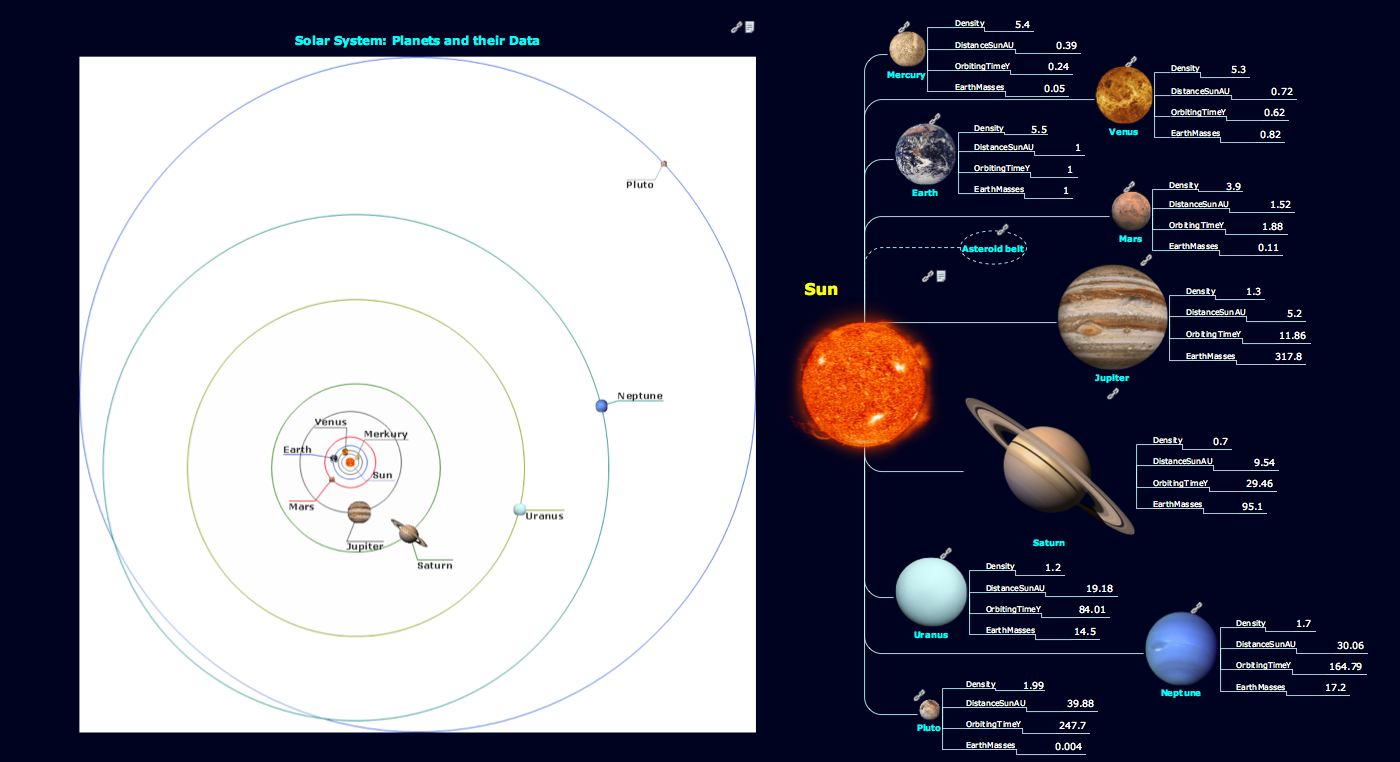
ConceptDraw DIAGRAM diagramming and vector drawing software offers the Astronomy solution with useful tools for drawing all kinds of astronomy pictures and sun solar system illustrations. The astronomy illustrations designed with ConceptDraw DIAGRAM are vector graphic documents and are available for reviewing, modifying, converting to a variety of formats (image, HTML, PDF file, MS PowerPoint Presentation, Adobe Flash or MS Visio XML), printing and send via e-mail in one moment.Business People Figures
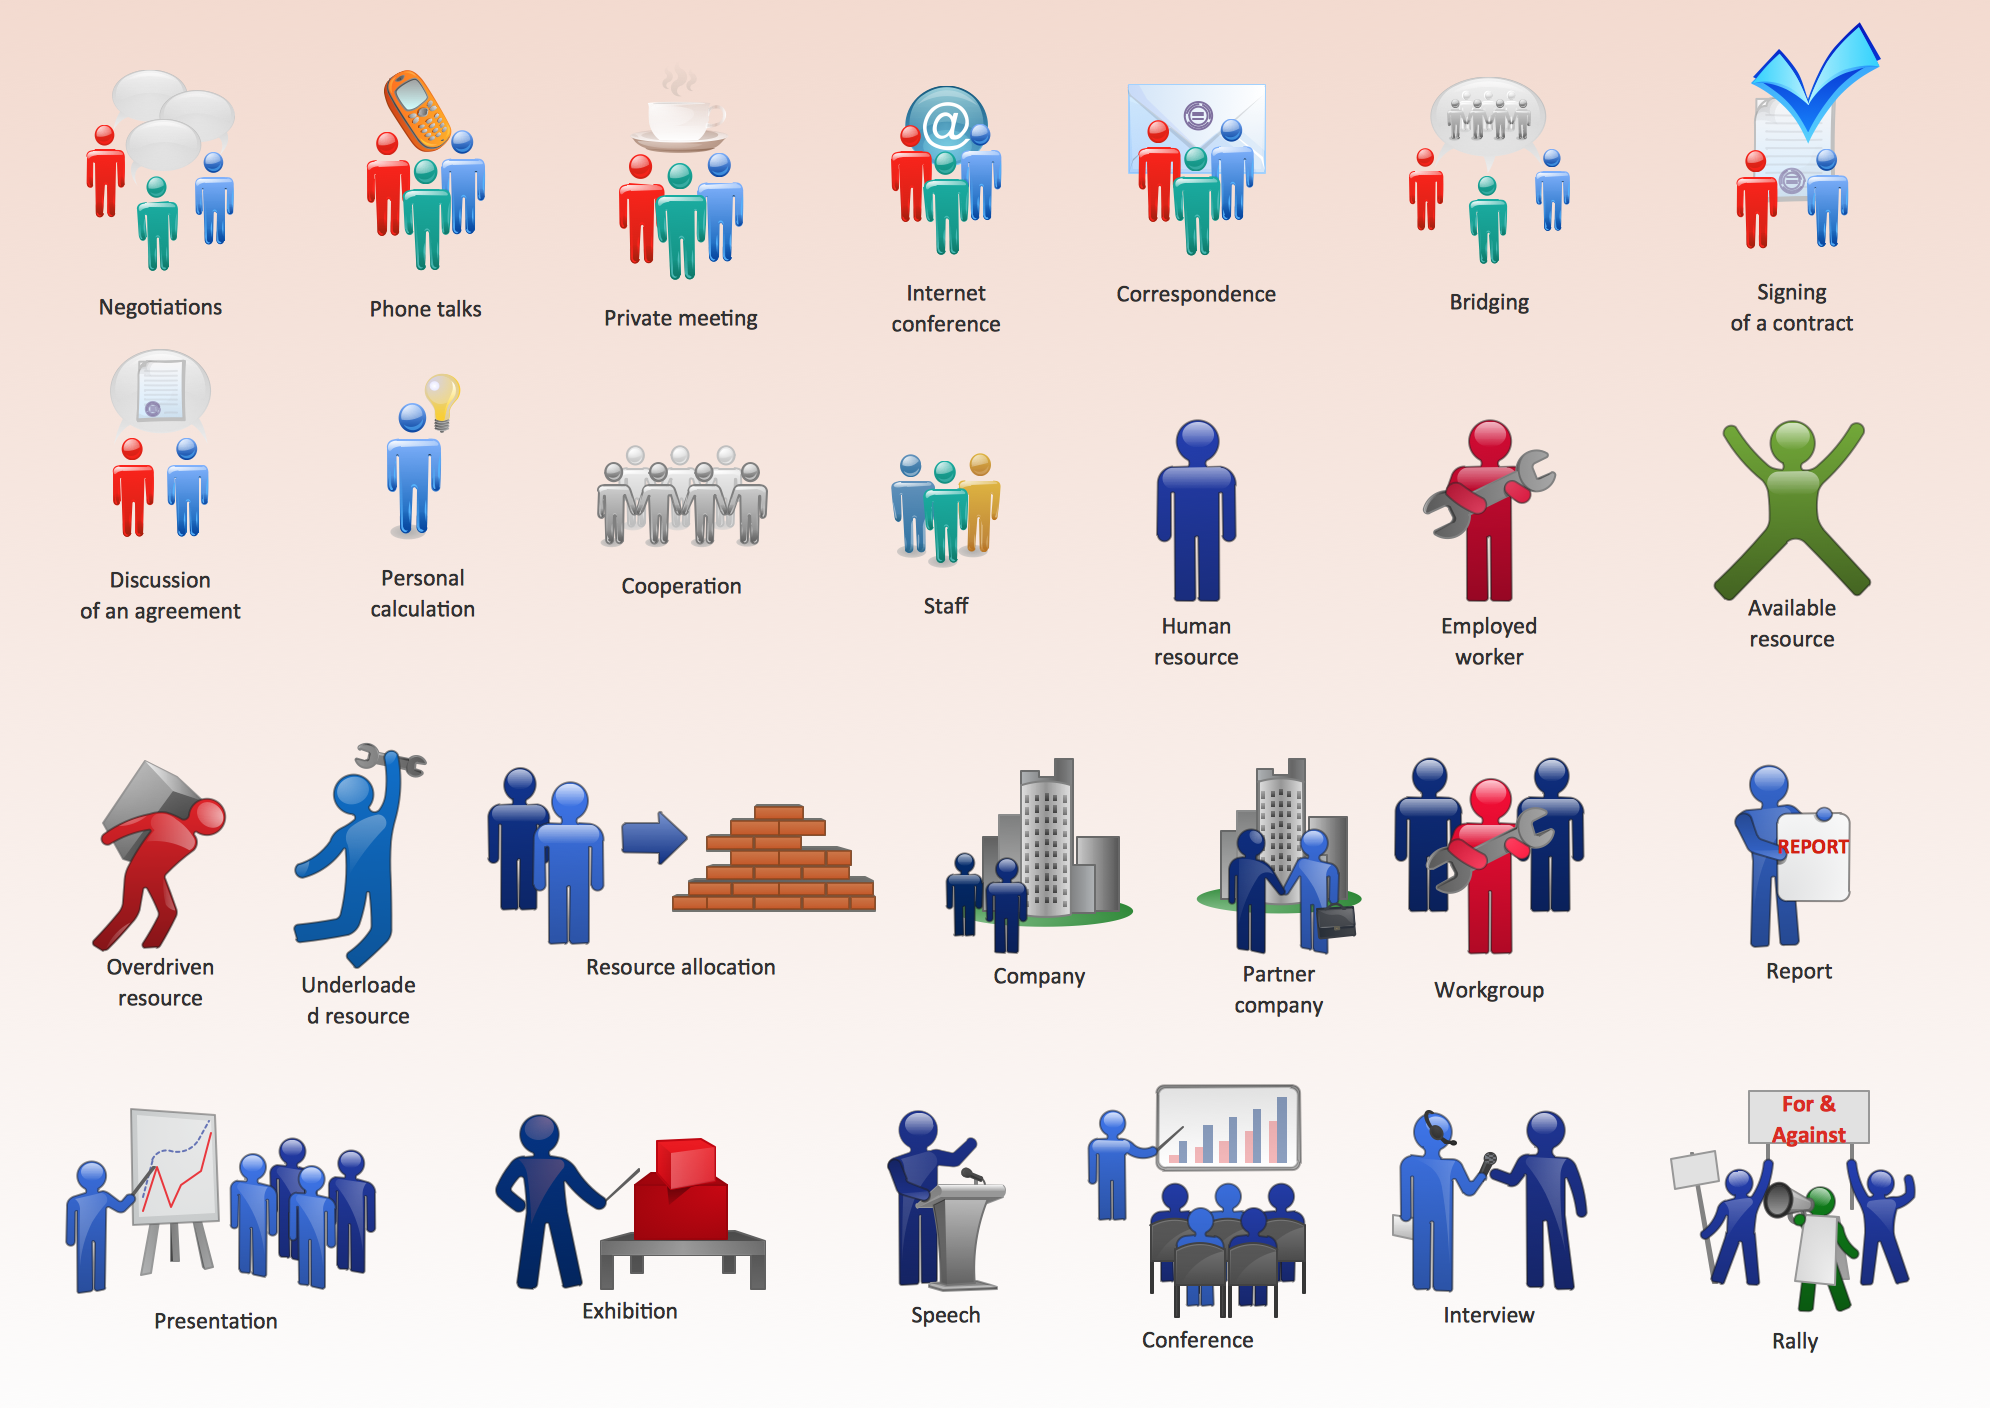
Nowdays business people’s figures are most favourite vector illustrations among presenters and designers. It is easy to make them and use, but they can make your graphics look really good looking & eye catching. Just check ConceptDraw business perople figusers pictures, you will see all kinds of silhouetes: Staff, Employed workers, Persons and Groups symbols. Best popular vector pictures are: men, dancing people, business man. Use human contours wise and it will help you to tell main idea of your design message.Biology Symbols
ConceptDraw DIAGRAM diagramming and vector drawing software extended with Biology solution from the Science and Education area offers a set of useful tools for fast and easy drawing of various biology illustrations and drawings.Biology solution provides 3 libraries with large quantity of vector biology symbols: Biochemistry of Metabolism Library, Carbohydrate Metabolism Library, Citric Acid Cycle (TCA Cycle) Library.
Astronomy and Astrology
Astronomy and astrology require from the specialists permanent drawing wide variety of illustrations, sketches. It’s convenient for astronomers and astrologers to have software that will help design them quick and easy. ConceptDraw DIAGRAM diagramming and vector drawing software extended with Astronomy solution from the Science and Education area is exactly what they need.Physics Symbols
ConceptDraw DIAGRAM diagramming and vector drawing software extended with Physics solution from the Science and Education area is a powerful software for creating various physics diagrams. Physics solution provides all tools that you can need for physics diagrams designing. It includes 3 libraries with predesigned vector physics symbols: Optics Library, Mechanics Library and Nuclear Physics Library.How to do presentation of Mind Maps via Skype conference call?
ConceptDraw MINDMAP is powerful and multifunctional mind mapping software with wide variety of relevant features, which make it comfortable for brainstorming, generating ideas, creating beautiful and professional-looking Mind Maps. ConceptDraw MINDMAP provides wide importing and exporting capabilities to variety of formats, among them MS PowerPoint, MS Word, MS Excel, FreeMind, XMind, MindJet Mindmanager, HTML, PDF, graphical formats. An innovative Skype conference call feature deserves the special attention of users, it is useful for teams, it lets to hold the presentations of Mind Maps via Skype and to collaborate in active Skype call. But how to do the presentation of Mind Map via Skype conference call by means of ConceptDraw MINDMAP software? Simply make the Skype conference call, share the presentation via Skype for active call participants using the Remote Presentation for Skype solution, keep the presentation file synchronized between all participants of Skype call. ConceptDraw MINDMAP lets also edit a Mind Map and to do slide show again with no interruption a call.Best Diagramming Software for macOS
ConceptDraw DIAGRAM creates drawings, flowcharts, block diagrams, bar charts, histograms, pie charts, divided bar diagrams, line graphs, area charts, scatter plots, circular arrows diagrams, Venn diagrams, bubble diagrams with great visual appeal on Mac OS X.
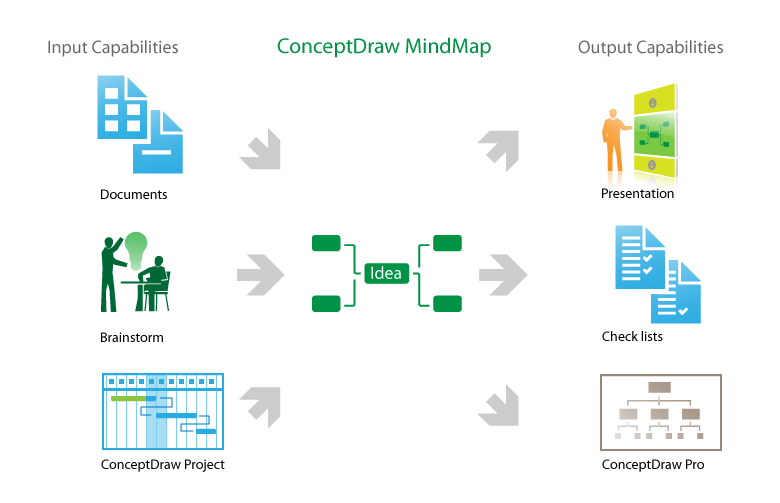
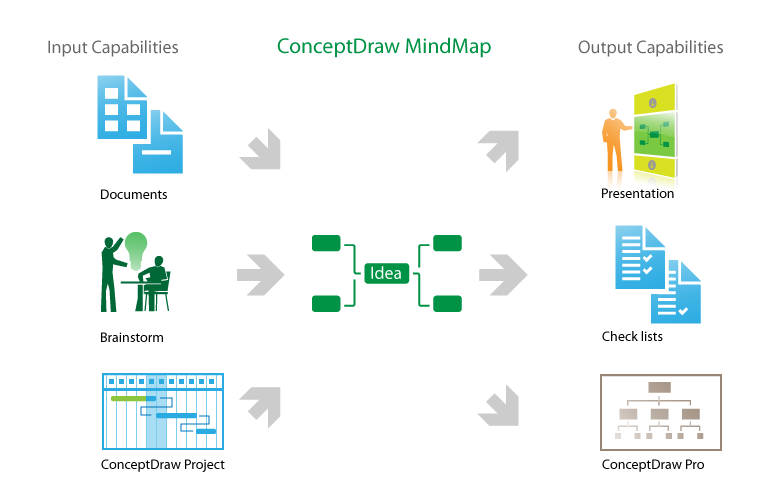
One formula of professional mind mapping : input data + output data + make great presentation
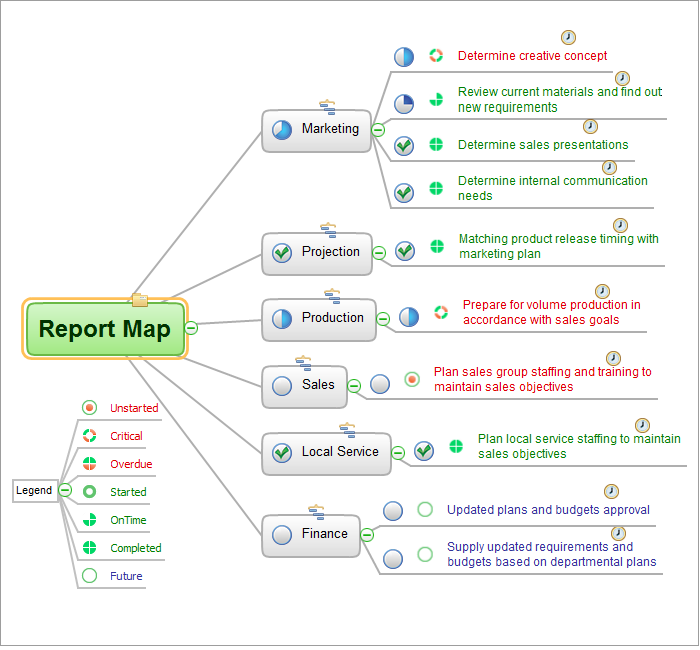
ConceptDraw MINDMAP is a powerful software from ConceptDraw Office suite, which provides a lot of tools and components for professional Mind Mapping. Besides the extensive tools for creation attractive and great-looking Mind Maps, it offers also wide import capabilities from MS Office files and mind mapping files MindJet MindManager, XMind and FreeMind, extensive export capabilities to common formats, such as PDF, HTML, different graphic formats, the possibility to generate MS Office documents, Project Management reports, PowerPoint presentations and demonstrate them via Skype conference call. Use of Skype conference call feature lets you to demonstrate the presentation's slide show and control it on computers of Skype call participants. This Report Mind Map example created in ConceptDraw MINDMAP software depicts the current project status and includes many pages and slides. This Project Status Report can be easy played as a slide show presentation on the large screen or to remote team using Skype conference call.How to Draw an Organization Chart
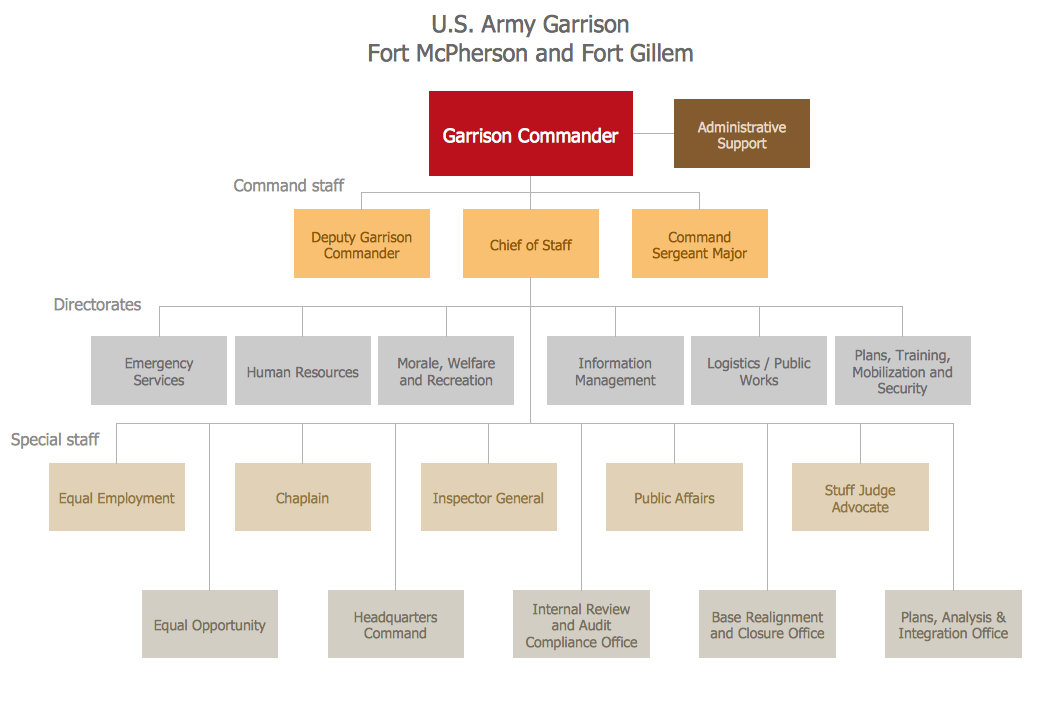
An Organizational chart is a type of diagram which visually displays the structure of an organization, relationships and relative ranks of the organization′s parts and positions. Organizational chart is constructed as an hierarchical structure, in the form of tree. How to Draw an Organization Chart the most easy and quickly? The Organizational Charts solution, innovative Tree Auto-connection mode and ConceptDraw Arrows10 Technology included in ConceptDraw DIAGRAM software are powerful drawing tools that change the way of diagrams production. Arrows10 Technology provides smart behavior for the connectors, and so quick and precise placement when drawing, and lets easy make the changes and automatic rearrangement. It helps to make the process of drawing diagrams more efficient, easier and faster. Now, you don′t need to think on how to connect or place the objects, you can concentrate fully on what to draw. See obligatory the helpful video tutorial about creation the Organization Charts and orgchart professional presentations with ConceptDraw products.Astronomy Symbols
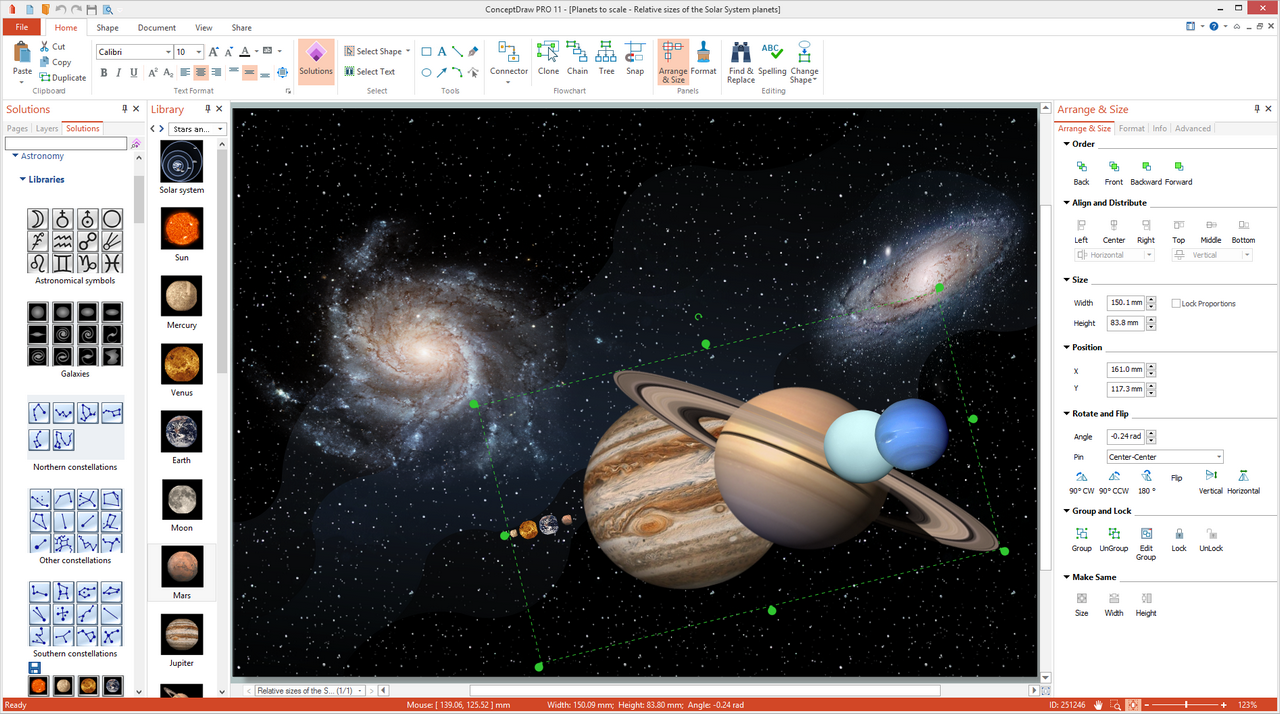
Are you an astronomer, astronomy teacher or student? And you need to draw astronomy pictures quick and easy? ConceptDraw DIAGRAM diagramming and vector drawing software extended with Astronomy solution from the Science and Education area will help you! Astronomy solution provides 7 libraries with wide variety of predesigned vector objects of astronomy symbols, celestial bodies, solar system symbols, constellations, etc.How to make great presentation via Skype? ...how it works with ConceptDraw MINDMAP?
ConceptDraw Solution Park provides a lot of useful solutions, among them Remote Presentation for Skype solution and powerful Mind Map Exchange solution. The presentation via Skype conference call is a part of Remote Presentation for Skype solution, due to it you are able to share easily your presentation via Skype and to control the slide-show process, which plays synchronously on the computers of all conference call participants. The Mind Map Exchange solution provides a lot of features for importing and exporting the documents between ConceptDraw MINDMAP software and the most popular mindmapping software tools, such as MindJet Mindmanager, Freemind, XMind and others. Thanks to all these abilities the ConceptDraw MINDMAP mind mapping software is perfect for holding the remote learning, remote training, varied web conferences, webinars and team briefings, and to represent any kind of information in a simple and convenient Mind Map form. With ConceptDraw MINDMAP it is easy to deliver the presentation session via Skype and to share the great-looking presentation documents with each conference participant.Types of Flowcharts
A Flowchart is a graphical representation of process, algorithm, workflow or step-by-step solution of the problem. It shows the steps as boxes of various kinds and connects them by arrows in a defined order depicting a flow. There are twelve main Flowchart types: Basic Flowchart, Business Process Modeling Diagram (BPMN), Cross Functional Flowchart, Data Flow Diagram (DFD), IDEF (Integrated DEFinition) Flowchart, Event-driven Process Chain (EPC) Diagram, Influence Diagram (ID), Swimlane Flowchart, Process Flow Diagram (PFD), Specification and Description Language (SDL) Diagram, Value Stream Mapping, Workflow Diagram. Using the Flowcharts solution from the Diagrams area of ConceptDraw Solution Park you can easy and quickly design a Flowchart of any of these types. This solution offers a lot of special predesigned vector symbols for each of these widely used notations. They will make the drawing process of Flowcharts much easier than ever. Pay also attention for the included collection of ready Flowchart examples, samples and quick-start templates. This is business process improvement tools. If you are looking for MS Visio for your Mac, then you are out of luck, because it hasn't been released yet. However, you can use Visio alternatives that can successfully replace its functions. ConceptDraw DIAGRAM is an alternative to MS Visio for Mac that provides powerful features and intuitive user interface for the same.
Organization Chart
ConceptDraw DIAGRAM diagramming and vector drawing software extended with 25 Typical Orgcharts solution from the Management area of ConceptDraw Solution Park offers 25 ready Organization Chart templates, 10 samples and 2 libraries with predesigned vector objects.Electrical Symbols — Stations
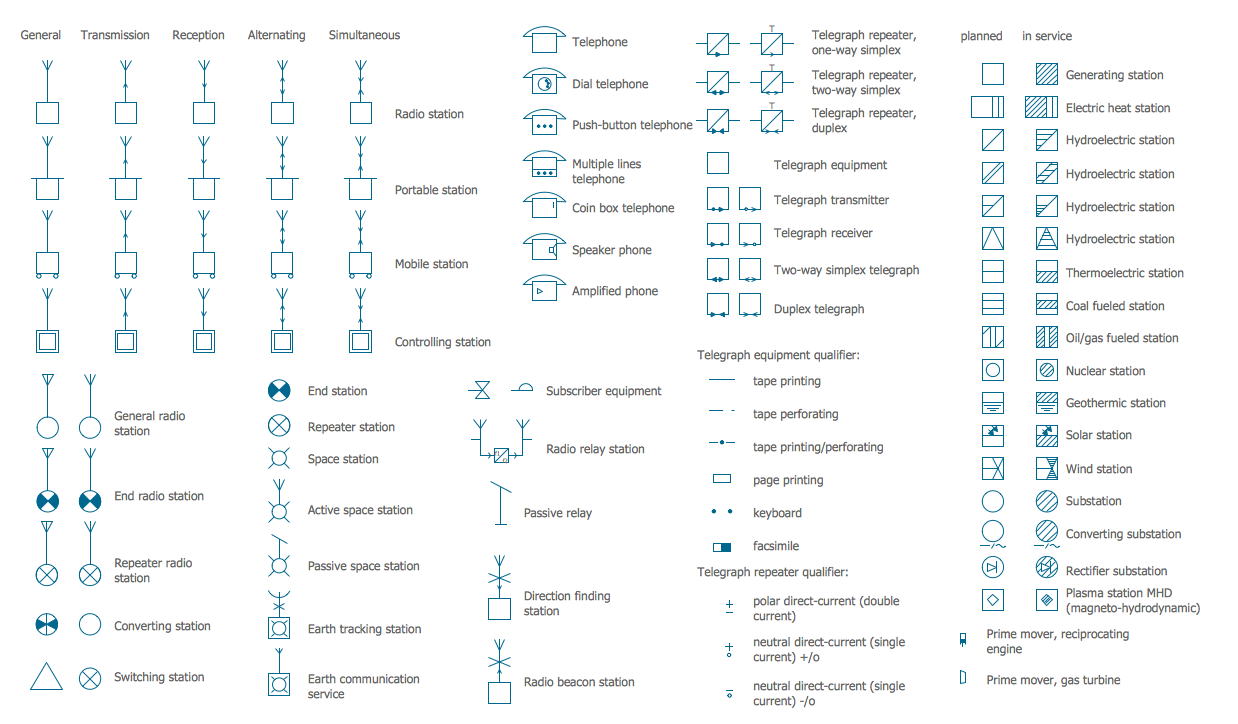
A power station is an industrial facility for the generation of electric power. Most power stations contain one or more generators, a rotating machine that converts mechanical power into electrical power. The relative motion between a magnetic field and a conductor creates an electrical current. The energy source harnessed to turn the generator varies widely. Most power stations in the world burn fossil fuels such as coal, oil, and natural gas to generate electricity. Others use nuclear power, but there is an increasing use of cleaner renewable sources such as solar, wind, wave and hydroelectric. 26 libraries of the Electrical Engineering Solution of ConceptDraw DIAGRAM make your electrical diagramming simple, efficient, and effective. You can simply and quickly drop the ready-to-use objects from libraries into your document to create the electrical diagram.UML Use Case Diagram Example - Estate Agency
UML Diagram Estate Agency. This sample was created in ConceptDraw DIAGRAM diagramming and vector drawing software using the UML Use Case Diagram library of the Rapid UML Solution from the Software Development area of ConceptDraw Solution Park. This sample shows the work of the estate agency and is used by the estate agencies, building companies, at the trainings of the estate agencies, for understanding the working processes of the estate agencies.Bar Diagrams for Problem Solving. Create space science bar charts with Bar Graphs Solution
Bar charts represent data in different categories or groups. Create bar graphs for visual solving your scientific problems and data comparison using the ConceptDraw DIAGRAM diagramming and vector drawing software extended with the Bar Graphs Solution from the Graphs and Charts area of ConceptDraw Solition Park.Best Mind Mapping Program for Making Presentations
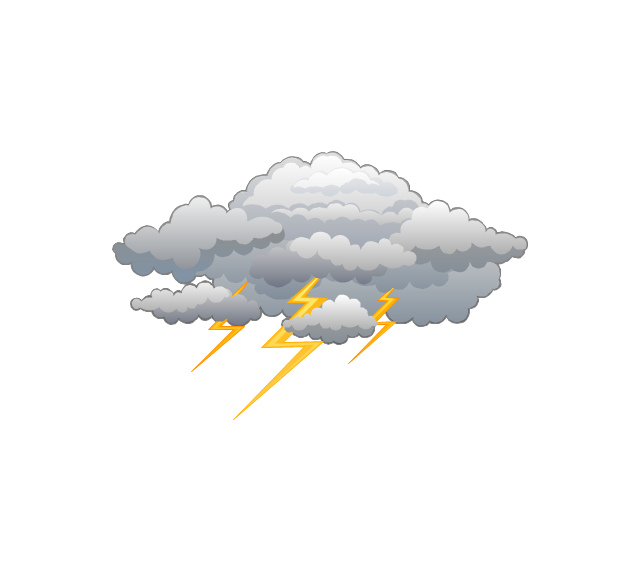
ConceptDraw MINDMAP with the ability to import presentations from Microsoft PowerPoint, as well as enhancing its existing presentation capabilities.The vector stencils library "Weather" contains 17 weather clipart images for drawing illustrations on climate to show cloudiness, air temperature, precipitation, wind.
"Weather is the state of the atmosphere, to the degree that it is hot or cold, wet or dry, calm or stormy, clear or cloudy. Most weather phenomena occur in the troposphere, just below the stratosphere. Weather generally refers to day-to-day temperature and precipitation activity, whereas climate is the term for the average atmospheric conditions over longer periods of time. When used without qualification, "weather", is generally understood to mean the weather of Earth.
Weather is driven by air pressure (temperature and moisture) differences between one place and another. These pressure and temperature differences can occur due to the sun angle at any particular spot, which varies by latitude from the tropics. The strong temperature contrast between polar and tropical air gives rise to the jet stream. Weather systems in the mid-latitudes, such as extratropical cyclones, are caused by instabilities of the jet stream flow. Because the Earth's axis is tilted relative to its orbital plane, sunlight is incident at different angles at different times of the year. On Earth's surface, temperatures usually range ±40°C (−40°F to 100°F) annually. Over thousands of years, changes in Earth's orbit affect the amount and distribution of solar energy received by the Earth and influence long-term climate and global climate change." [Weather. Wikipedia]
The clip art example "Weather - Vector stencils library" was created using the ConceptDraw PRO diagramming and vector drawing software extended with the Nature solution from the Illustration area of ConceptDraw Solution Park.
www.conceptdraw.com/ solution-park/ illustrations-nature
Infographic Maker
Infographic is a visual way of representing various information, data, knowledge in statistics, geography, journalism, education, and much more areas. ConceptDraw DIAGRAM supplied with Pictorial Infographics Solution from the “Infographics” Area, provides a set of powerful pictorial infographics tools. Thanks to them it is the best Infographic Maker.- Cooking Recipes | Draw A Figure Of Solar System
- Solar System Symbols | Sun Solar System | Astronomy Symbols ...
- Solar System Symbols
- Solar System For Drawing
- Solar System Symbols | Sun Solar System | Sketching Software ...
- Solar System Sketch Diagram
- Solar System Symbols | Astronomy Pictures | Sun Solar System ...
- Solar System Symbols | Sun Solar System | Sketching Software ...
- Sun Solar System | Skype - eLearning Learning | Sketching ...
- Sun Solar System | Skype - eLearning Learning | Sketching ...
- Solar System Symbols | Sun Solar System | Sketching Software ...
- Solar System Symbols | Astronomy | Sun Solar System | Examples ...
- Class Diagram Of Solar System
- Types of Flowcharts | Energy resources diagram | Pie Charts | Solar ...
- Constellation Chart | TQM Diagram Tool | Sketching Software ...
- Business People Figures | Solar System Symbols | Software Finance ...
- Solar System Symbols | Sun Solar System | Astronomy Pictures ...
- CERES data flow diagram | Astronomy | Stars and planets - Vector ...
- Solar System Symbols | Sketching Software | Sun Solar System ...
- Process Flowchart | Sun Solar System | Biology Drawing ...
