HelpDesk
How to Draw a Histogram in ConceptDraw PRO
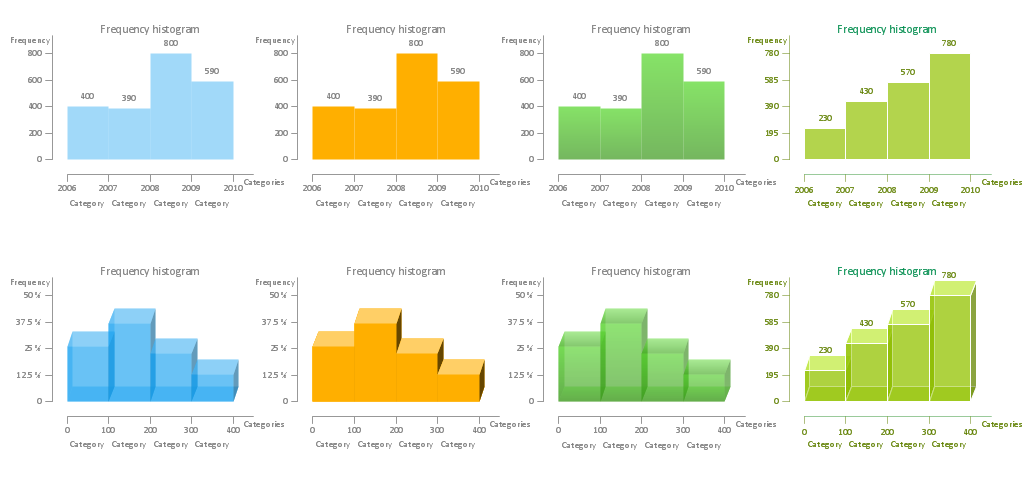
Histogram is a diagram used to visualize data through bars of variable heights. Making histogram can be helpful if you need to show data covering various periods (hours, days, weeks, etc). When the vertical column of the histogram refer to frequency it shows how many times any event happens. It is a Frequency histogram. A bar chart diagram is similar to a histogram, but in contrast to a bar chart a histogram represents the number how many times there have been certain data values. You can use a histogram to depict continual data flow such as temperature, time, etc. You can effortlessly draw histograms using the Histograms solution for CnceptDraw PRO. Making a histogram can by very useful to represent various statistical data.How Do You Make a Histogram?
How do you make a histogram usually? Drawing of histogram is quite complex and lengthy process. Usually you have a set of data and you draw free-hand your diagram according to these data. But now thanks to the ConceptDraw PRO diagramming and vector drawing software extended with Histograms solution from the Graphs and Charts Area of ConceptDraw Solution Park this process became simple and fast.How To Make Histogram in ConceptDraw PRO?
How to make histogram in ConceptDraw PRO? ConceptDraw PRO diagramming and vector drawing software is the best choice for making professional looking Histograms. ConceptDraw PRO provides Histograms solution from the Graphs and Charts Area of ConceptDraw Solution Park.How To Make a Histogram?
How to make a Histogram quick and easy? ConceptDraw PRO diagramming and vector drawing software extended with Histograms solution from the Graphs and Charts area will effectively help you in Histogram drawing.
 Histograms
How to make a Histogram? Making a Histogram is an incredibly easy process when it is done with ConceptDraw PRO. The Histograms Solution enhances ConceptDraw PRO v10 functionality with extensive drawing tools, numerous samples, and examples; also a quick-start template and library of ready vector stencils for visualization the data and professional drawing Histograms.
Histogram
ConceptDraw PRO diagramming and vector drawing software offers the Histograms solution from the Graphs and Charts area of ConceptDraw Solution Park with powerful tools to help you draw a Histogram of any complexity quick and easy.Making a Histogram
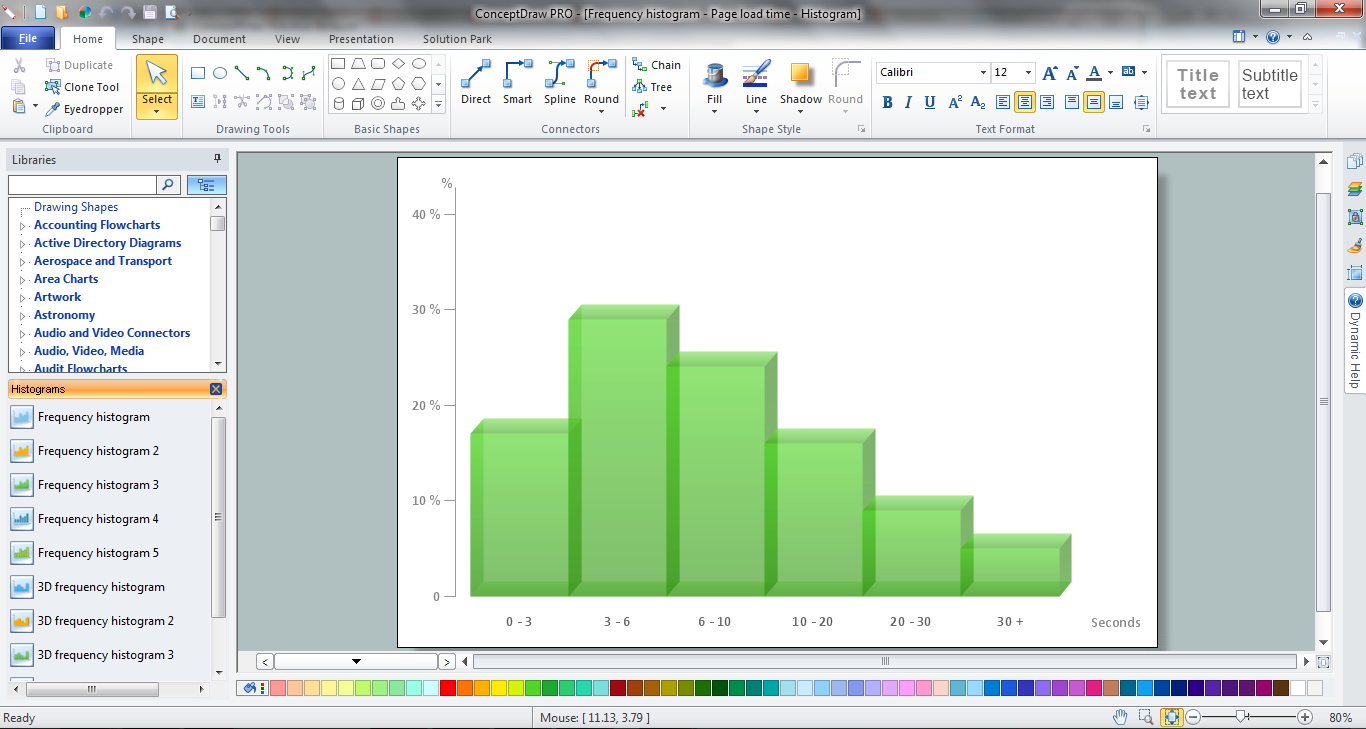
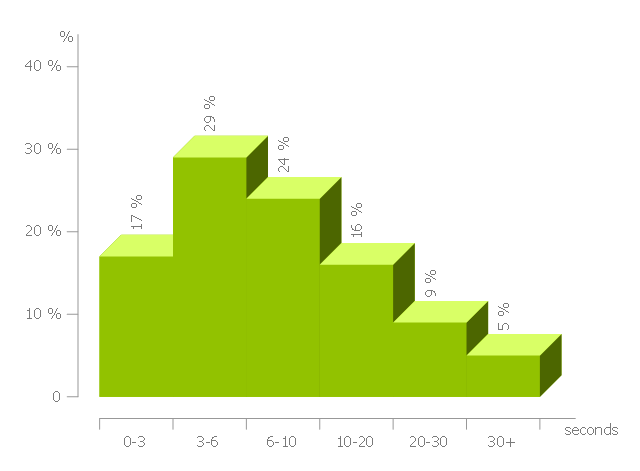
ConceptDraw PRO is a powerful diagramming and vector drawing software. Extended with Histograms solution from the Graphs and Charts area, ConceptDraw PRO became the ideal software for making a Histogram.This histogram sample shows the frequency distribution of web page load time.
"Web performance optimization, WPO, or website optimization is the field of knowledge about increasing the speed in which web pages are downloaded and displayed on the user's web browser. ...
With the average internet speed now increasing globally, it's fitting for website administrators and "webmasters" to consider the time it takes for websites to render for the visitor.
Faster website download speeds have been shown to increase visitor retention and loyalty and user satisfaction, especially for users with slow internet connections and those on mobile devices. Web performance also leads to less data travelling across the web, which in turn lowers a website's power consumption and environmental impact. Some aspects which can affect the speed of page load include Browser/ Server Cache, Image Optimization and also encryption (for example SSL), which can affect the time it takes for pages to render." [Web performance optimization. Wikipedia]
The histogram example "Page load time" was created using the ConceptDraw PRO diagramming and vector drawing software extended with the Histograms solution from the Graphs and Charts area of ConceptDraw Solution Park.
Simple Drawing Applications for Mac
ConceptDraw gives the ability to draw simple diagrams like flowcharts, block diagrams, bar charts, histograms, pie charts, divided bar diagrams, line graphs, area charts, scatter plots, circular arrows diagrams, Venn diagrams, bubble diagrams, concept maps, and others.Basic Diagramming
Try ConceptDraw program, the perfect drawing tool for creating all kinds of great-looking drawings, charts, graphs, and illustrations.
Make a Histogram
ConceptDraw PRO extended with Histograms solution from the Graphs and Charts area of ConceptDraw Solution Park lets you make a Histogram of any complexity in minutes.The Best Drawing Program for Mac
ConceptDraw PRO is the professional business graphic software for drawing diagrams and charts with great visual appeal on Mac OS X.Basic Diagramming
Mathematics is an exact science, which studies the values, spatial forms and quantitative relations. It is a science, in which is built large number of various diagrams, charts and graphs that present the material in a clear, visual and colorful form, help to analyze the information and to make certain conclusions. A diagram is a graphical representation of data using the linear segments or geometric shapes, which allows to evaluate the ratio of several values. Depending on the types of solved tasks are used the diagrams of different kinds. A graph is a diagram that shows quantitative dependencies of various processes using the curves. ConceptDraw PRO is a powerful intelligent and multifunctional vector engine for drawing different Mathematical diagrams and graphs, Mathematical illustrations, complex and simple Diagram mathematics, Flowcharts of equation solving process, Line graphs, Scatter plots, Histograms, Block diagrams, Bar charts, Divided bar diagrams, Pie charts, Area charts, Circular arrows diagrams, Venn diagrams, Bubble diagrams, Concept maps, and many others.
Best Program to Make Diagrams
Make diagrams, charts, workflows, flowcharts, org charts, project charts easily with ConceptDraw software.
Basic Diagramming
Perfect charts and graphics diagramming software with rich examples and template. ConceptDraw is ideal to draw Charts and Graphics.
Chart Examples
Easy charting software comes with beautiful chart templates and examples. This makes it easy to create professional charts without prior experience.
 Basic Diagramming
This solution extends ConceptDraw PRO software with the specific tools you need to easily draw flowcharts, block diagrams, histograms, pie charts, divided bar diagrams, line graphs, circular arrows diagrams, Venn diagrams, bubble diagrams and concept maps
Best Vector Drawing Application for Mac OS X
ConceptDraw PRO creates drawings, diagrams and charts with great visual appeal in Mac OS X.The Best Flowchart Software Available
ConceptDraw gives the ability to draw Flowchart documents. Flowcharts solutionis a powerful tool that extends ConceptDraw application for drawing business flowcharts. ConceptDraw PRO vector diagramming and business graphics software enhanced with with templates, green and interactive flowchart makers, samples and stencil libraries from ConceptDraw Solution Park which all focused to help with drawing flowcharts, block diagrams, bar charts, histograms, pie charts, divided bar diagrams, line graphs, area charts, scatter plots, circular arrows diagrams, Venn diagrams, bubble diagrams, concept maps, and others.
- How to Draw a Histogram in ConceptDraw PRO | Chart Examples ...
- Histograms | Chart Examples | Bar Chart Examples | Histogram Visio
- Chart Examples | Basic Diagramming | Best Software to Draw ...
- Histograms | Visual Presentations Made Easy with Diagramming ...
- Histogram template | Frequency histogram - Page load time | Chart ...
- Histograms | Best Multi-Platform Diagram Software | Basic ...
- Histograms | Design elements - Histograms | Histogram template ...
- Best Multi-Platform Diagram Software | The Best Drawing Program ...
- The Best Drawing Program for Mac | Best Software to Draw ...
- Design elements - Histograms | Histogram template | Design ...
- Histograms | Frequency Distribution Dashboard | Pyramid Chart ...
- Histograms | Chart Examples | Black cherry tree histogram ...
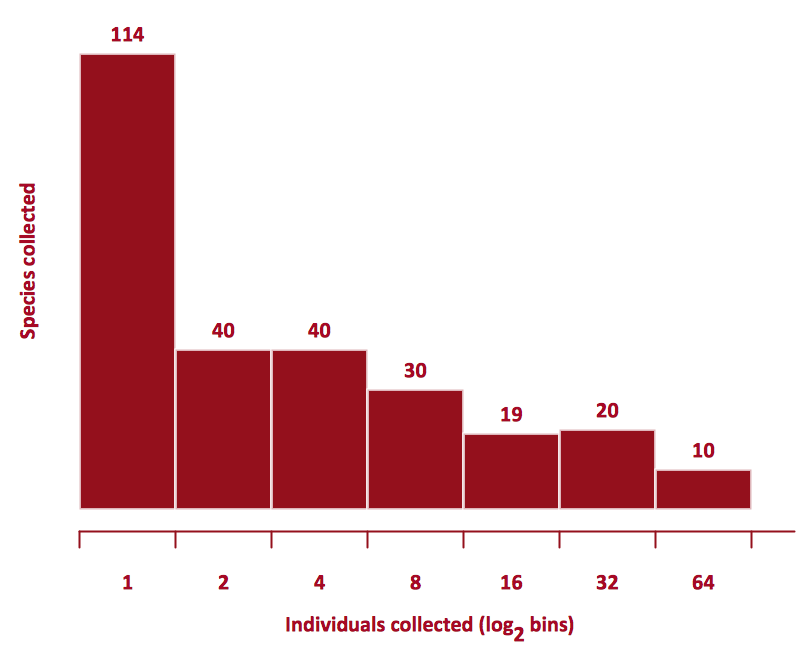
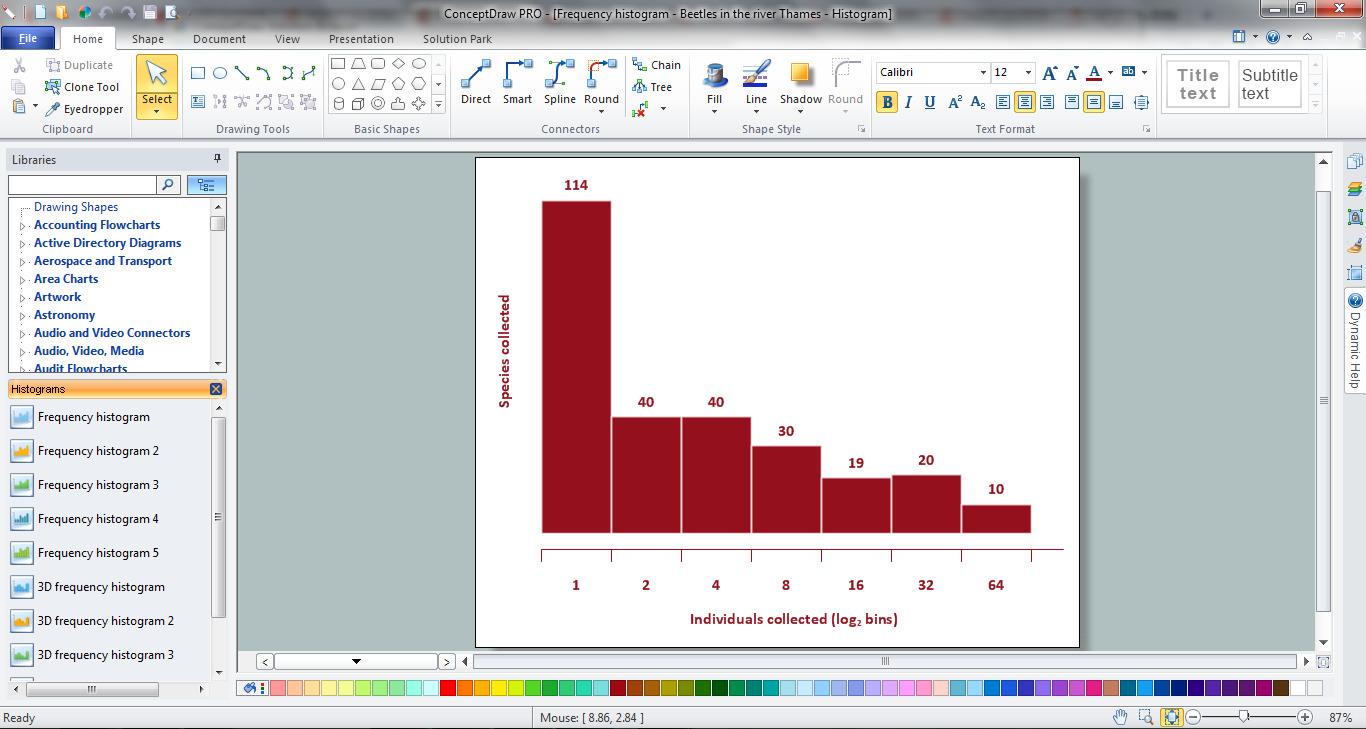
- Histograms | Chart Examples | Frequency histogram - Beetles in the ...
- The Best Drawing Program for Mac | Chart Examples | Best Multi ...
- Chart Examples | Projects HR dashboard | Column Chart Examples ...
- Histogram template | Design elements - Histograms | Basic ...
- Histograms - Vector stencils library | Graphs and Charts Area ...
- Projects HR dashboard | Simple Drawing Applications for Mac ...
- Frequency histogram - Page load time | Frequency histogram ...
- Simple Diagramming | Simple Drawing Applications for Mac | Visual ...

