Types of Flowcharts
A Flowchart is a graphical representation of process, algorithm, workflow or step-by-step solution of the problem. It shows the steps as boxes of various kinds and connects them by arrows in a defined order depicting a flow. There are twelve main Flowchart types: Basic Flowchart, Business Process Modeling Diagram (BPMN), Cross Functional Flowchart, Data Flow Diagram (DFD), IDEF (Integrated DEFinition) Flowchart, Event-driven Process Chain (EPC) Diagram, Influence Diagram (ID), Swimlane Flowchart, Process Flow Diagram (PFD), Specification and Description Language (SDL) Diagram, Value Stream Mapping, Workflow Diagram. Using the Flowcharts solution from the Diagrams area of ConceptDraw Solution Park you can easy and quickly design a Flowchart of any of these types. This solution offers a lot of special predesigned vector symbols for each of these widely used notations. They will make the drawing process of Flowcharts much easier than ever. Pay also attention for the included collection of ready Flowchart examples, samples and quick-start templates. This is business process improvement tools. If you are looking for MS Visio for your Mac, then you are out of luck, because it hasn't been released yet. However, you can use Visio alternatives that can successfully replace its functions. ConceptDraw PRO is an alternative to MS Visio for Mac that provides powerful features and intuitive user interface for the same.
 Universal Diagramming Area
This area collects solutions for drawing diagrams, charts, graphs, matrices, geographic and road maps for education, science, engineering, business.
 School and Training Plans
Planning a school and its campus layout needs to depict the premises, represent internal spaces, location of windows and direction of natural light. Detailed classroom seating chart helps you visualize location of the blackboard and desks, taking into account the specifics of the room and its lighting, with a goal to design the classroom to be comfortable for each pupil and teacher.
 Entity-Relationship Diagram (ERD)
An Entity-Relationship Diagram (ERD) is a visual presentation of entities and relationships. That type of diagrams is often used in the semi-structured or unstructured data in databases and information systems. At first glance ERD is similar to a flowch
 Artwork
Artwork solution extends ConceptDraw PRO software with illustration samples, templates and libraries of vector clipart of architecture, food, music, funny animals, aquatic fauna and transport.
 Plumbing and Piping Plans
Plumbing and Piping Plans solution extends ConceptDraw PRO v10.2.2 software with samples, templates and libraries of pipes, plumbing, and valves design elements for developing of water and plumbing systems, and for drawing Plumbing plan, Piping plan, PVC Pipe plan, PVC Pipe furniture plan, Plumbing layout plan, Plumbing floor plan, Half pipe plans, Pipe bender plans.
 Continent Maps
Continent Maps solution extends ConceptDraw PRO software with templates, samples and libraries of vector stencils for drawing the thematic maps of continents, state maps of USA and Australia.
Chemistry Symbols and Meanings
Chemistry solution offers 5 libraries with large collection of vector chemistry symbols and meanings, chemistry equation symbols, organic chemistry symbols, and chemical clipart: Chemical Elements Library, Chemical Drawings Library, Conformations Library, Laboratory Equipment Library, Periodic Table of Chemical Elements Library.Astronomy and Astrology
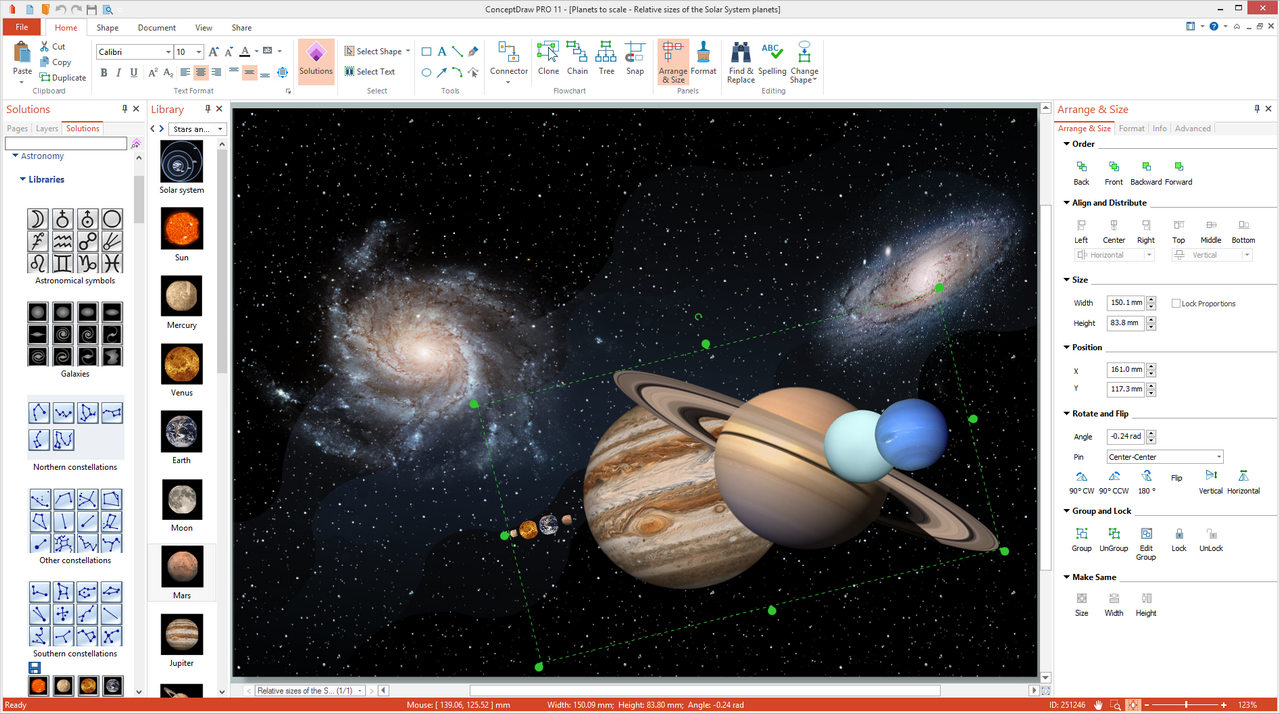
Astronomy and astrology require from the specialists permanent drawing wide variety of illustrations, sketches. It’s convenient for astronomers and astrologers to have software that will help design them quick and easy. ConceptDraw PRO diagramming and vector drawing software extended with Astronomy solution from the Science and Education area is exactly what they need.
 Chemistry
This solution extends ConceptDraw PRO software with samples, template and libraries of vector stencils for drawing the Chemistry Illustrations for science and education.
 Basic Floor Plans
Detailed floor plan is the basis of any building project, whether a home, office, business center, restaurant, shop store, or any other building or premise. Basic Floor Plans solution is a perfect tool to visualize your creative projects, architectural and floor plans ideas.
 Chemical and Process Engineering
This chemical engineering solution extends ConceptDraw PRO v.9.5 (or later) with process flow diagram symbols, samples, process diagrams templates and libraries of design elements for creating process and instrumentation diagrams, block flow diagrams (BFD
 Reflected Ceiling Plans
Reflected Ceiling Plans solution is effective tool for architects, designers, electricians, and other people which every day need convenient tool for representing their ceiling ideas. Use it to create without efforts professional Reflected Ceiling plans and Reflective Ceiling plans, showing the location of light fixtures, drywall or t-bar ceiling patterns, lighting panels, and HVAC grilles and diffusers that may be suspended from the ceiling.
 Electric and Telecom Plans
This solution extends ConceptDraw PRO software with samples, templates and libraries of vector stencils for drawing the Electric and Telecom Plans.
- Physics Apparatus Drawing On Chart Paper
- Physics Model That Drawn On Chart Paper
- Simple Physics Chart Paper Drawing
- Physics Chart Papers
- Physics Drawings To Draw In Chart Paper
- Mechanical Engineering | Diagram Of Physics Appartus On Chart ...
- Mechanical Engineering | Physics Diagrams | Apparatus Using ...
- Chemistry Chart Paper
- Best Chart Paper For Physics
- Physics Diagrams | How to Draw Physics Diagrams in ConceptDraw ...
- Bio Flowchart Lite | Chemistry | Chart Paper Drawing In Chemistry
- Simple Software To Draw Physics And Chemistry Apparatus
- How to Draw Physics Diagrams in ConceptDraw PRO | Physics ...
- Chem Chart Paper Easy Draw
- School Physics Chart Designs
- Chemical Chart Physics
- Physics Diagrams | Process Flow Chart Symbols | ConceptDraw ...
- Mechanical Engineering | Apparatus Of Physics Drawing
- Drawings For Physics Chart


