"Wheelchair curling is an adaptation of curling for athletes with a disability affecting their lower limbs or gait. Wheelchair curling is governed by the World Curling Federation, and is one of the sports in the Winter Paralympic Games.
Wheelchair curling is played with the same rocks and on the same ice as regular curling, though the rocks are thrown from a stationary wheelchair and there is no sweeping. Rocks may be thrown by hand while leaning over the side of the wheelchair, or pushed by a delivery stick. This is a pole with a bracket that fits over the rock handle, allowing the rock to be pushed while applying correct rotation. ...
Wheelchair curling began in Europe in the late 1990s and in North America in 2002. The first World Wheelchair Curling Championship was held in Sursee, Switzerland in 2002, and was won by the host nation who beat Canada 7 - 6 in the final. It started as a Paralympic sport at the 2006 Winter Paralympics in Turin, Italy." [Wheelchair curling. Wikipedia]
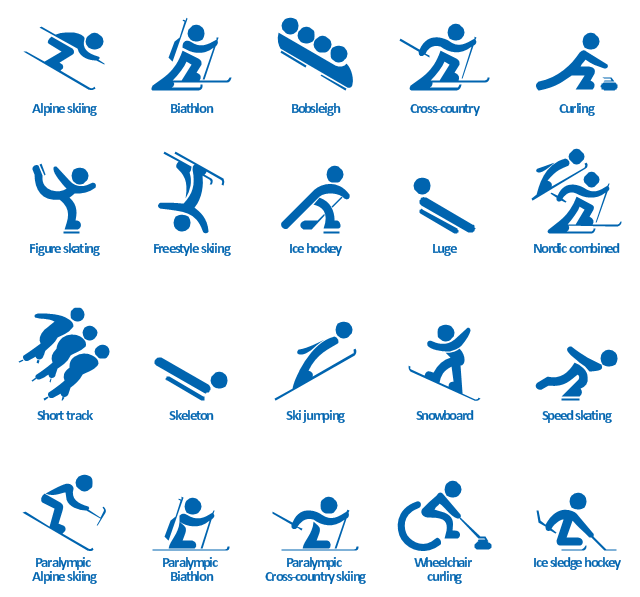
The vector icon example "Wheelchair curling" represents one of 20 symbols from the Winter sports pictograms library for the ConceptDraw PRO diagramming and vector drawing software.
The design elements library Winter sports pictograms is included in the Winter Sports solution from the Sport area of ConceptDraw Solution Park.
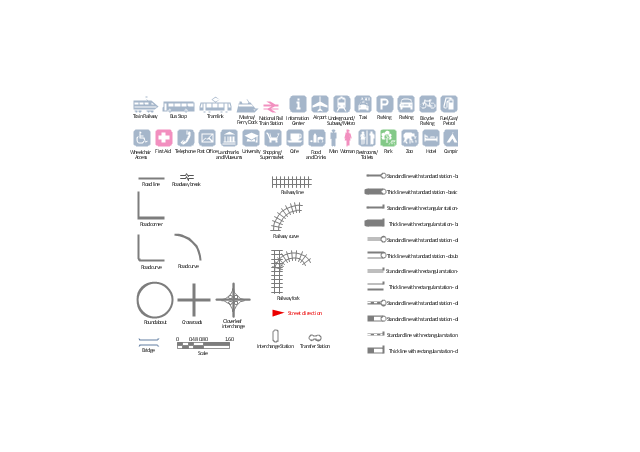
The vector stencils library "Transport map" contains 96 pictograms for drawing transport maps.
Use it in your spatial infographics for visual representation of transport schemes and plans as metro maps in the ConceptDraw PRO diagramming and vector drawing software extended with the Spatial Infographics solution from the area "What is Infographics" of ConceptDraw Solution Park.
Use it in your spatial infographics for visual representation of transport schemes and plans as metro maps in the ConceptDraw PRO diagramming and vector drawing software extended with the Spatial Infographics solution from the area "What is Infographics" of ConceptDraw Solution Park.
The vector stencils library "People pictograms" contains 20 icons of men and women symbols. Use it to draw your pictorial infograms. The example "People pictograms - Vector stencils library" was created using the ConceptDraw PRO diagramming and vector drawing software extended with the Pictorial infographics solution from the area "What is infographics" in ConceptDraw Solution Park.
The vector stencils library "Transport map" contains 96 signs and pictograms for drawing road and transit maps.
"A transit map is a topological map in the form of a schematic diagram used to illustrate the routes and stations within a public transport system - whether this be bus lines, tramways, rapid transit, commuter rail or ferry routes. The main components are color coded lines to indicate each line or service, with named icons to indicate stations or stops.
Transit maps can be found in the transit vehicles, at the platforms or in printed timetables. Their primary function is to help users to efficiently use the public transport system, including which stations function as interchange between lines. Unlike conventional maps, transit maps are usually not geographically accurate - instead they use straight lines and fixed angles, and often illustrate a fixed distance between stations, compressing those in the outer area of the system and expanding those close to the center." [Transit map. Wikipedia]
The pictograms example "Design elements - Transport map" was created using the ConceptDraw PRO diagramming and vector drawing software extended with the Spatial Infographics solution from the Maps area of ConceptDraw Solution Park.
The vector stencils library "Winter sports pictograms" contains 20 pictograms of winter sports.
Use it to draw sport illustrations and infographics in the ConceptDraw PRO diagramming and vector drawing software extended with the Winter Sports solution from the Sport area of ConceptDraw Solution Park.
Use it to draw sport illustrations and infographics in the ConceptDraw PRO diagramming and vector drawing software extended with the Winter Sports solution from the Sport area of ConceptDraw Solution Park.
The vector stencils library "Winter sports pictograms" contains 20 symbols of Winter Olympic sports: Alpine skiing, Alpine skiing paralympic, Biathlon, Biathlon paralympic, Bobsleigh, Cross-country, Cross-country skiing paralympic, Curling, Wheelchair curling, Figure skating, Freestyle skiing, Ice hockey, Ice sledge hockey, Luge, Nordic combined, Short track, Skeleton, Ski jumping, Snowboard, Speed skating.
The design elements library "Winter sports pictograms" for the ConceptDraw PRO diagramming and vector drawing software is included in the Winter Sports solution from the Sport area of ConceptDraw Solution Park.
The design elements library "Winter sports pictograms" for the ConceptDraw PRO diagramming and vector drawing software is included in the Winter Sports solution from the Sport area of ConceptDraw Solution Park.
The vector stencils library "Landmarks" contains 69 landmark symbols of buildings, waterways, scale and directional indicators for labeling transportation and directional maps, road and route maps, street and transit maps, locator and tourist maps.
The pictograms example "Landmarks - Vector stencils library" was created using the ConceptDraw PRO diagramming and vector drawing software extended with the Directional Maps solution from the Maps area of ConceptDraw Solution Park.
The pictograms example "Landmarks - Vector stencils library" was created using the ConceptDraw PRO diagramming and vector drawing software extended with the Directional Maps solution from the Maps area of ConceptDraw Solution Park.
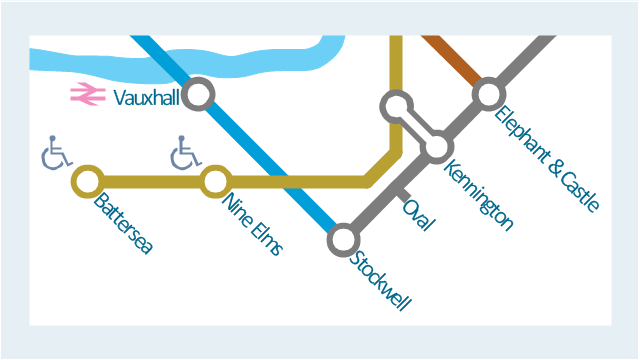
This spatial infographic example was created on the base of the tube map from the Transport for London website.
[tfl.gov.uk/ assets/ images/ general/ 24746-nle-gallery-tube-map.jpg]
"The Tube map is a schematic transit map of the lines and stations of London's public rapid transit railway systems, namely the London Underground (commonly known as the Tube, hence the name), Docklands Light Railway, London Overground and Emirates Air Line, as well as being incorporated into Greater London connections maps.
As a schematic diagram, it shows not necessarily the geographic but rather the relative positions of stations along the lines, stations' connective relations with each other and fare zones. The basic design concepts have been widely adopted for other network maps around the world, especially that of mapping topologically rather than geographically." [Tube map. Wikipedia]
The spatial infographics example "Metro map - Northern line extension to Battersea via Nine Elms" was created using the ConceptDraw PRO diagramming and vector drawing software extended with the Spatial Infographics solution from the area "What is Infographics" of ConceptDraw Solution Park.
"Paralympic biathlon is an adaptation of biathlon for athletes with a disability. Paralympic biathlon is one of two Nordic skiing disciplines in the Winter Paralympic Games. It is governed by the International Paralympic Committee.
Paralympic biathlon includes standing events, sitting events (for wheelchair users), and events for visually impaired athletes.
Visually impaired athletes use a rifle that use sound to indicate to the athlete how accurate their aim is, and shoots a laser beam at the target." [Paralympic biathlon. Wikipedia]
The vector icon example "Biathlon, paralympic" represents one of 20 symbols from the Winter sports pictograms library for the ConceptDraw PRO diagramming and vector drawing software.
The design elements library Winter sports pictograms is included in the Winter Sports solution from the Sport area of ConceptDraw Solution Park.
HelpDesk
How to Draw a Pictorial Chart in ConceptDraw PRO
Pictorial Infographics is used to visually present data comparison. Pictorial charts use relative sizes or repetitions of the same icon, picture, or symbol to show data relation. Using a Pictorial chart to show business data patterns and trends will add much more efficiency to your business communications. Finding the right tool for the job can sometimes be tricky. Developing sophisticated and effective infographics can require toolsthat may span many different products. Fortunately, ConceptDraw PRO has everything you need to create polished Pictorial Infographics that beautifully and accurately represent your story, no matter how complex it may be.How to Draw Pictorial Chart. How to Use Infograms
How to draw pictorial chart quick, easy and effective? ConceptDraw PRO offers the unique Pictorial Infographics Solution that will help you! Pictorial Infographics solution contains large number of libraries with variety of predesigned vector pictograms that allows you design infographics in minutes. There are available 10 libraries with 197 vector pictograms.Pictorial Chart
You want design Pictorial Chart or Infographic? And you need powerful infographic software? Then ConceptDraw PRO diagramming and vector drawing software extended with Pictorial Infographics Solution from the “What are Infographics” Area is exactly what you need.Infographic Maker
Infographic is a visual way of representing various information, data, knowledge in statistics, geography, journalism, education, and much more areas. ConceptDraw PRO supplied with Pictorial Infographics Solution from the “What are Infographics” Area, provides a set of powerful pictorial infographics tools. Thanks to them it is the best Infographic Maker.Design Pictorial Infographics. Design Infographics
In the course of recent decades data visualization went through significant development and has become an indispensable tool of journalism, business intelligence and science. The way visual information may be conveyed is not limited simply to static or dynamic representation, it can also be interactive. Infographics can be conditionally divided into several general levels. Primarily, this is level of visualization of information, its interpretation and association on any ground. Second level can be defined as a visualization of knowledge, depiction of thoughts and ideas in the form of images or diagrams. Finally, the level of data visualization, which processes data arrays in charts, enabling the information to be more clearly perceived. You can also identify the main approaches to the creation of infographics: exploratory and narrative. Exploratory method insists on minimalist design in favor of data precision without unnecessary details and is common for scientific researches and ana- Biathlon, paralympic - Winter sports pictograms | Wheelchair curling ...
- Wheelchair curling - Winter sports pictograms | Winter sports ...
- Wheelchair curling - Winter sports pictograms | Transport map ...
- Wheelchair curling - Winter sports pictograms | Curling sheet ...
- Geography - Vector stencils library | Wheelchair curling - Winter ...
- Wheelchair For Visio
- Curling sheet | Wheelchair curling - Winter sports pictograms ...
- Wheelchair curling - Winter sports pictograms | iPhone User ...
- Biathlon, paralympic - Winter sports pictograms | Design elements ...
- Packaging, loading, customs - Vector stencils library | Wheelchair ...
- Wheelchair curling - Winter sports pictograms | Curling - Winter ...
- Alpine skiing, paralympic - Winter sports pictograms | Wheelchair ...
- Office Concepts | Landscape Plan | Emergency Plan | Electric Power ...
- Shopping pictograms - Vector stencils library | Shopping pictograms ...
- Building Drawing Software for Design Sport Fields | Design ...
- Sochi 2014 Olympics - Men's hockey tournament schedule ...
- How to draw Metro Map style infographics? (Los Angeles ...
- Nordic Track Ski Drawing
- Nordic Skier Drawing
- Defensive Strategy Diagram – 46 Defence | Downloading the Old ...
