Drawing a Nature Scene
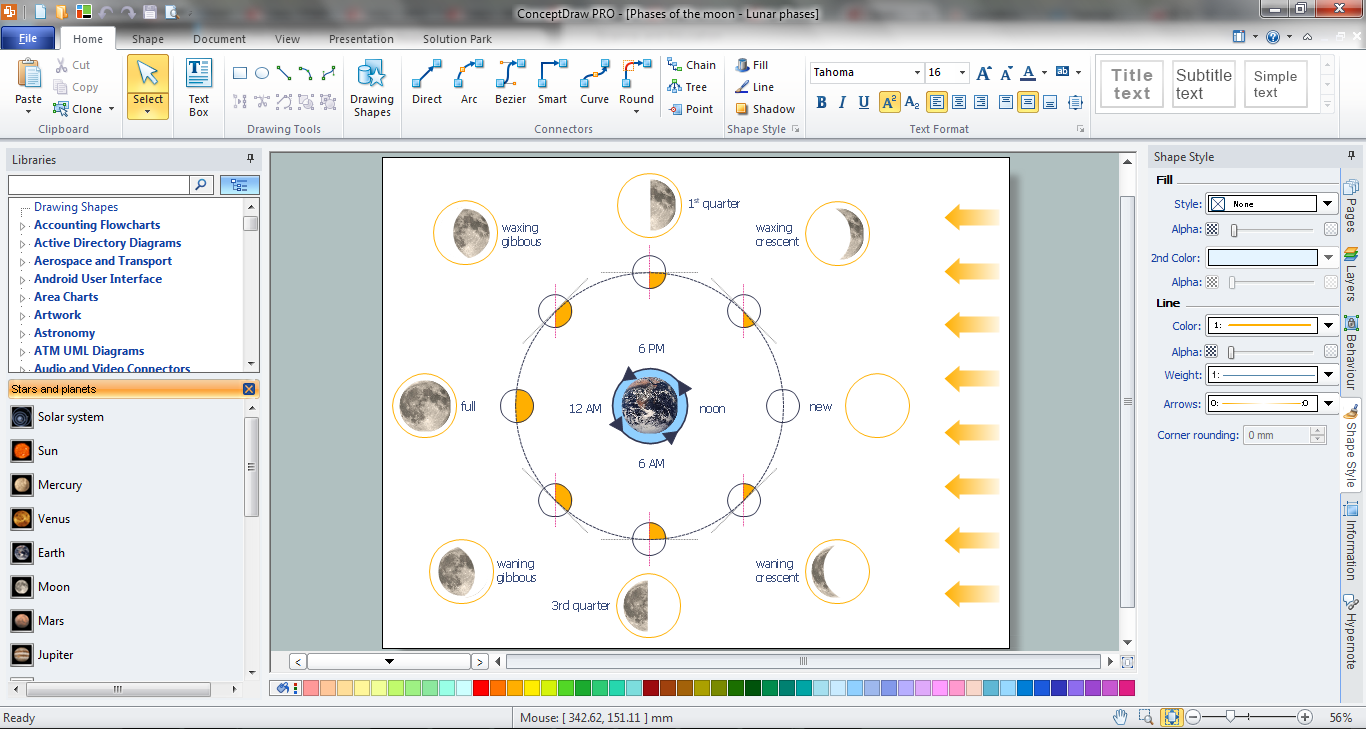
ConceptDraw PRO is a drawings software for creating Nature scenes. Nature solution from ConceptDraw Solution Park expands this software with a new library that contains 17 vector objects and samples illustration files.Beautiful Nature Scene: Drawing
The Nature Solution addition to ConceptDraw Solution Park for ConceptDraw PRO includes new libraries that provide a wide range nature objects and it can be used to augment documentation and graphics. Draw beautiful nature scenes using ConceptDraw PRO software with Nature solution.Beauty in nature Illustrations and Clipart
Nature solution expands our software possibilities to create beautiful illustrations and cliparts with the new library which contains 17 vector objects.
 Nature
This solution extends ConceptDraw PRO software with samples, templates and libraries of vector clipart for drawing the Nature illustrations. Use it to make professional-looking documents, presentations and websites illustrated with color scalable vector c
Illustration Software
No science can't exist without illustrations, and especially astronomy! Illustrations help to visualize knowledge, natural phenomenons which are studied by astronomy, they equally effective help in work, during the learning process and on the conferences. Now we have professional astronomy illustration software - ConceptDraw PRO illustration and sketching software with templates, samples and libraries of a variety of astronomy symbols, including constellations, galaxies, stars, and planet vector shapes; a whole host of celestial bodies. When drawing scientific and educational astronomy illustrations, astronomy pictures and diagrams, can help you reach for the stars!The vector stencils library "Weather" contains 17 weather clipart images for drawing illustrations on climate to show cloudiness, air temperature, precipitation, wind.
"Weather is the state of the atmosphere, to the degree that it is hot or cold, wet or dry, calm or stormy, clear or cloudy. Most weather phenomena occur in the troposphere, just below the stratosphere. Weather generally refers to day-to-day temperature and precipitation activity, whereas climate is the term for the average atmospheric conditions over longer periods of time. When used without qualification, "weather", is generally understood to mean the weather of Earth.
Weather is driven by air pressure (temperature and moisture) differences between one place and another. These pressure and temperature differences can occur due to the sun angle at any particular spot, which varies by latitude from the tropics. The strong temperature contrast between polar and tropical air gives rise to the jet stream. Weather systems in the mid-latitudes, such as extratropical cyclones, are caused by instabilities of the jet stream flow. Because the Earth's axis is tilted relative to its orbital plane, sunlight is incident at different angles at different times of the year. On Earth's surface, temperatures usually range ±40°C (−40°F to 100°F) annually. Over thousands of years, changes in Earth's orbit affect the amount and distribution of solar energy received by the Earth and influence long-term climate and global climate change." [Weather. Wikipedia]
The clip art example "Weather - Vector stencils library" was created using the ConceptDraw PRO diagramming and vector drawing software extended with the Nature solution from the Illustration area of ConceptDraw Solution Park.
www.conceptdraw.com/ solution-park/ illustrations-nature
Geo Map - Africa
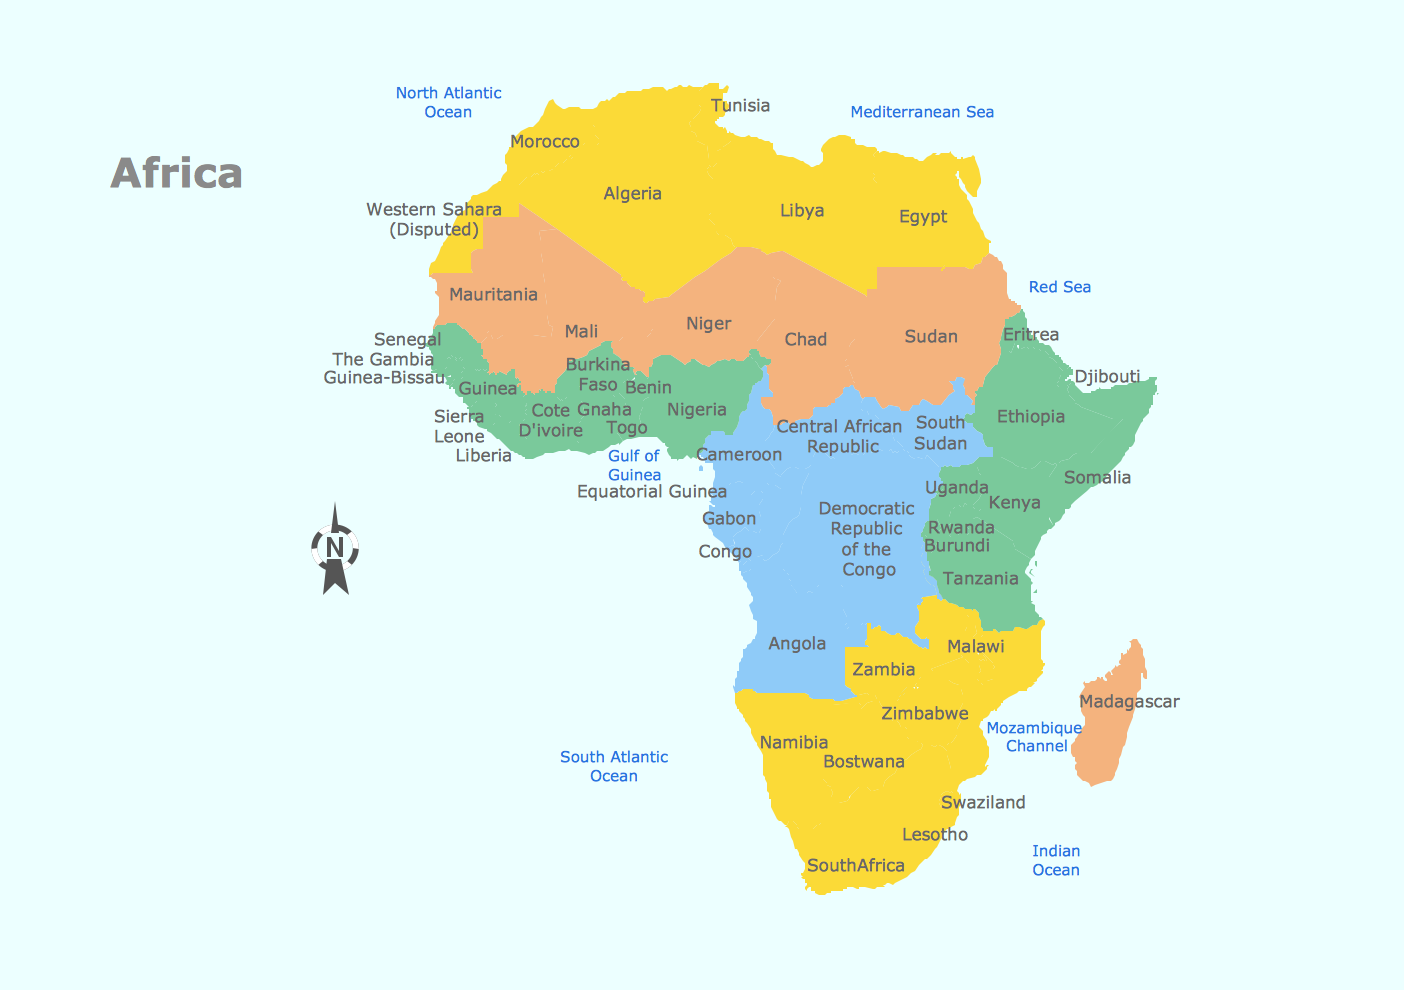
Africa has 54 fully recognized sovereign states, 9 territories and two de facto independent states with limited or no recognition. Vector design elements library Africa contains country map contours, geographical maps, cartograms and thematic maps for ConceptDraw PRO diagramming and vector drawing software. To help visualize the business and thematic information connected with geographic areas, locations or customs. All ConceptDraw PRO documents are vector graphic files and are available for reviewing, modifying, and converting to a variety of formats: image, HTML, PDF file, MS PowerPoint Presentation, Adobe Flash, MS Visio (.VDX, .VSDX).The vector stencils library "Ecology pictograms" contains 20 icons of eco symbols. Use it to draw your ecological infographics. The example "Ecology pictograms - Vector stencils library" was created using the ConceptDraw PRO diagramming and vector drawing software extended with the Pictorial infographics solution from the area "What is infographics" in ConceptDraw Solution Park.
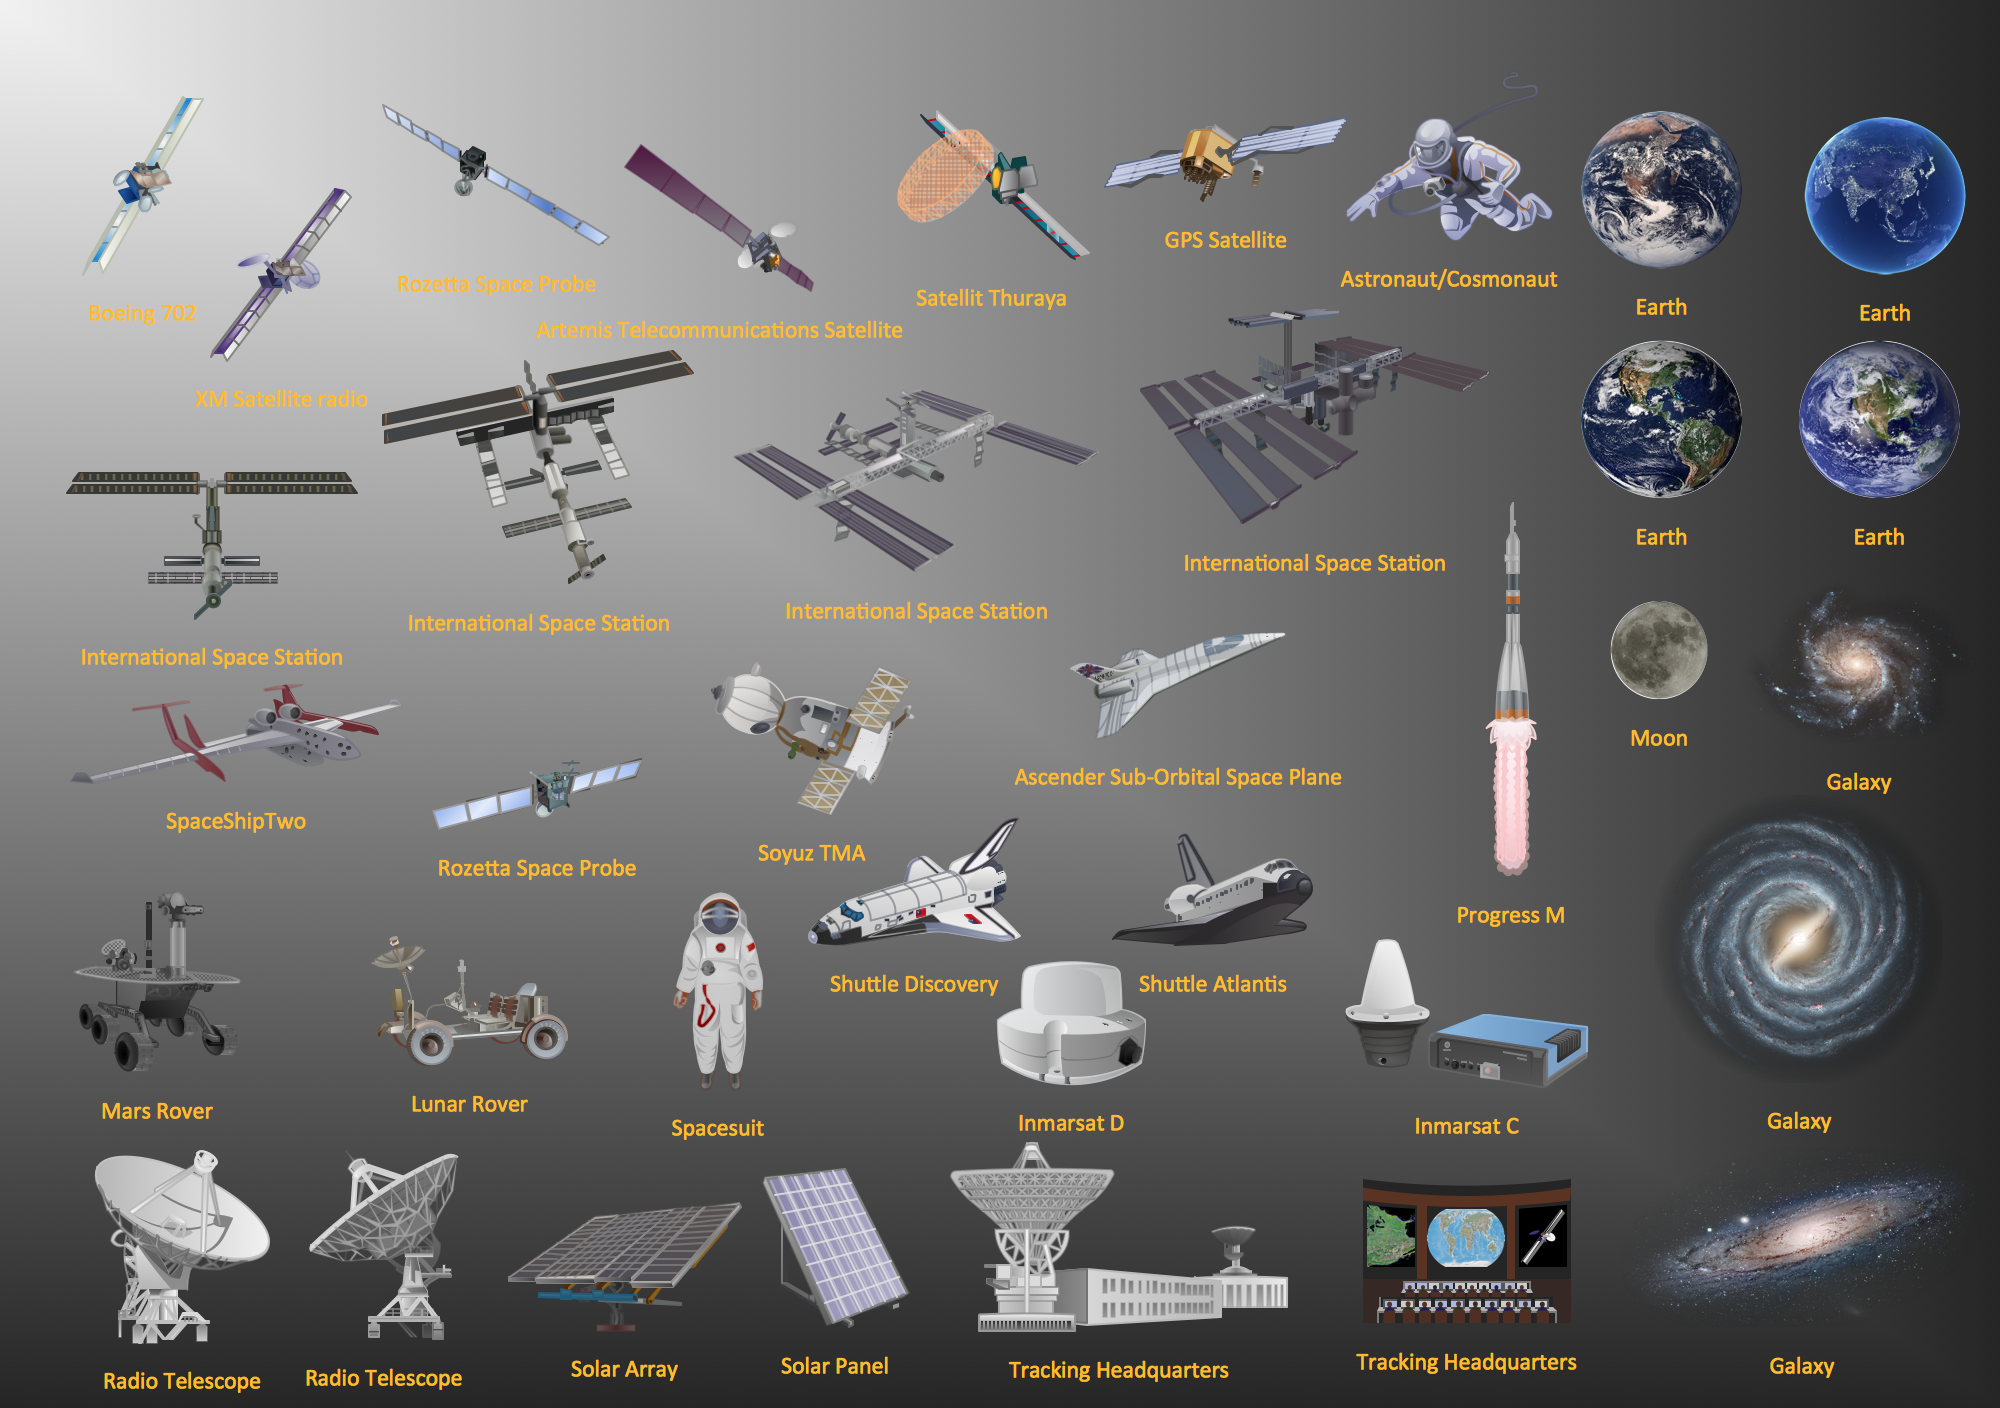
Aerospace - Design Elements
Samples, templates and libraries contain vector clip art for drawing the Aerospace Illustrations.Bar Diagrams for Problem Solving. Create space science bar charts with Bar Graphs Solution
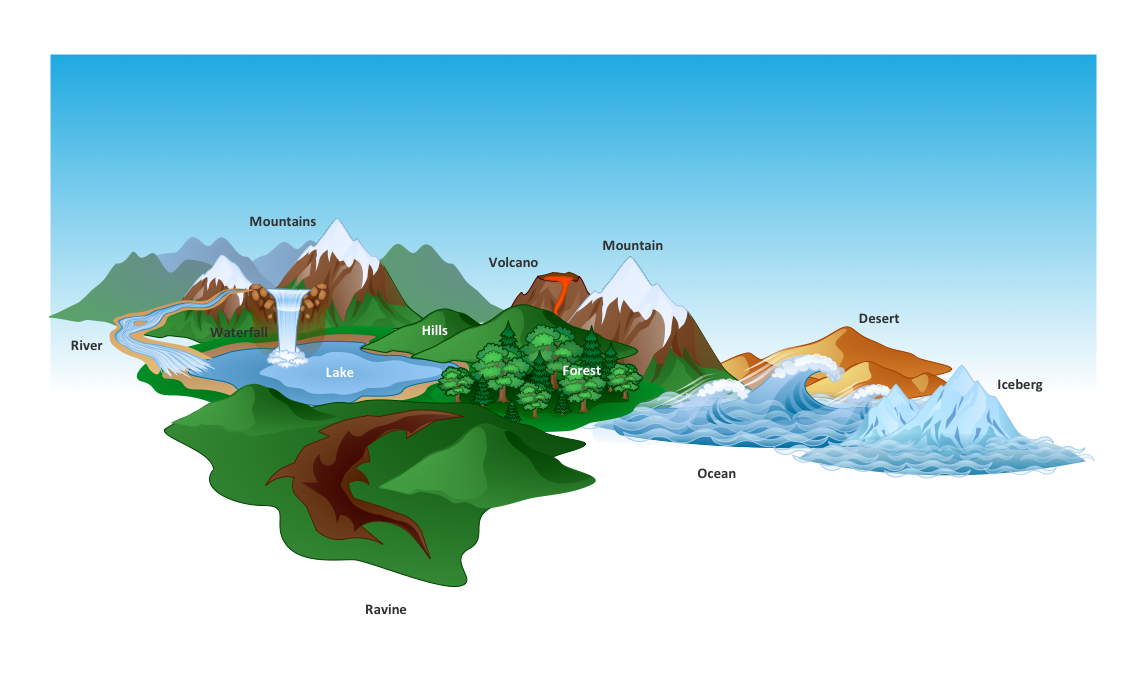
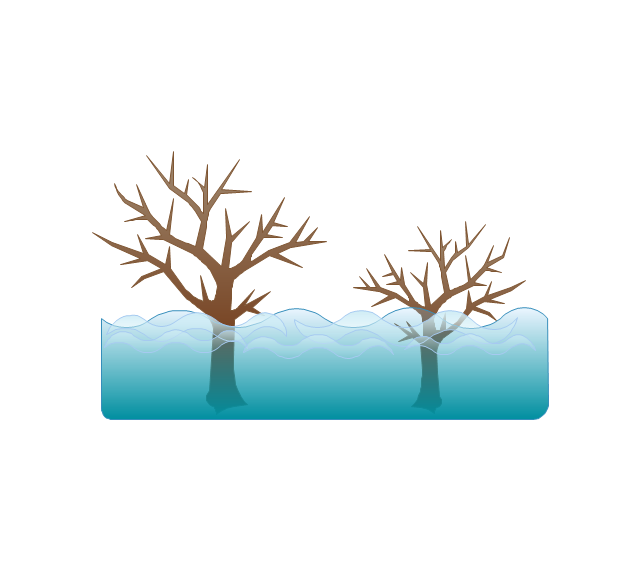
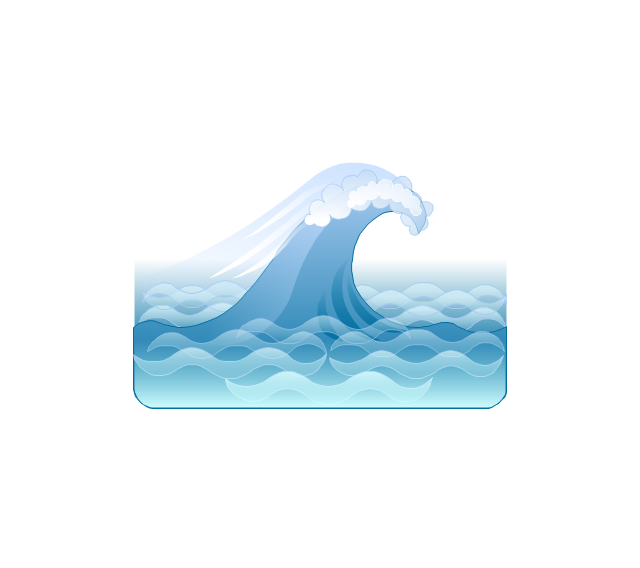
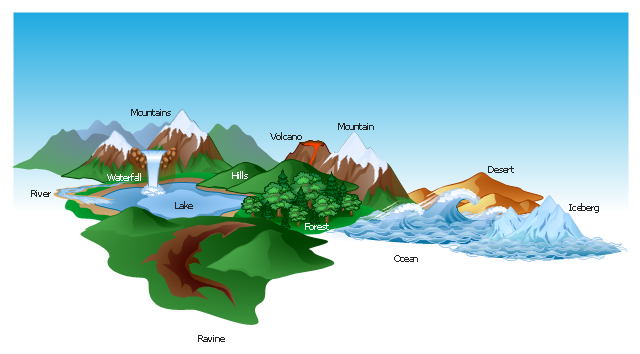
Bar charts represent data in different categories or groups. Create bar graphs for visual solving your scientific problems and data comparison using the ConceptDraw PRO diagramming and vector drawing software extended with the Bar Graphs Solution from the Graphs and Charts area of ConceptDraw Solition Park.The vector clipart library Geography contains 14 images of geographical features: ocean, forest, river, lake, waterfall, mountains, ravine, volcano, desert, hills, iceberg, trees.
Use the design elements library Geography to draw illustrations with landform images using the ConceptDraw PRO diagramming and vector drawing software.
"A landform in the earth sciences comprises a geomorphological unit, and is largely defined by its surface form and location in the landscape. As part of the terrain a landform is an element of topography. Landform elements also include land such as hills, mountains, plateaus,canyons,valleys, seascape and oceanic waterbody interface features such as bays, peninsulas, seas and so forth, including sub-aqueous terrain features such as mid-ocean ridges, volcanoes,and the great ocean basins." [Landform. Wikipedia]
This landscape illustration example is included in the Nature solution from the Illustration area of ConceptDraw Solution Park.
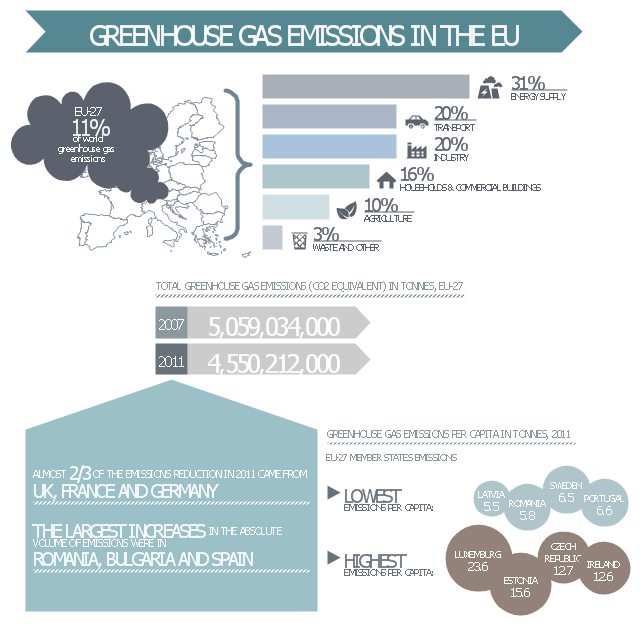
This ecology infographic example was created on the base of the infographics "Greenhouse gas emissions in the EU" from the Debating Europe website. [debatingeurope.eu/ wp-content/ uploads/ 2013/ 06/ TH_ 2_ social.png]
"A greenhouse gas (sometimes abbreviated GHG) is a gas in an atmosphere that absorbs and emits radiation within the thermal infrared range. This process is the fundamental cause of the greenhouse effect. The primary greenhouse gases in the Earth's atmosphere are water vapor, carbon dioxide, methane, nitrous oxide, and ozone. Greenhouse gases greatly affect the temperature of the Earth; without them, Earth's surface would average about 33 °C colder, which is about 59 °F below the present average of 14 °C (57 °F)." [Greenhouse gas. Wikipedia]
The ecology infographic example "EU greenhouse gas emissions" was created using the ConceptDraw PRO diagramming and vector drawing software extended with the Management Infographics solition from the area "Business Infographics" in ConceptDraw Solution Park.
Used Solutions
 Aerospace and Transport
This solution extends ConceptDraw PRO software with templates, samples and library of vector clipart for drawing the Aerospace and Transport Illustrations. It contains clipart of aerospace objects and transportation vehicles, office buildings and anci
- Drawing a Nature Scene | Nature | Earth Movement Flow Chart
- Water cycle diagram | Drawing a Nature Scene | Nature | Digram ...
- Drawing a Nature Scene | Nature | Draw A Flow Chart Of Earths ...
- Nature | Flow Chart Of Earth Movement
- Nature | Chart On Movements Of Earth
- Nature | Flow Chart For Earth Movement
- Nature | Aerospace and Transport | Circular Diagram Of The Earth
- Map Software | How to Draw a Natural Landscape | Beautiful Nature ...
- Sample Earth System Illustrations
- Beautiful Nature Scene: Drawing | How to Draw a Natural ...
- Beauty in nature Illustrations and Clipart | Weather - Vector stencils ...
- Design elements - Geography | Geography - Vector stencils library ...
- Geo Map - Africa | Beautiful Nature Scene: Drawing | World ...
- Map Software | How to Draw a Natural Landscape | Nature ...
- Water cycle diagram | Drawing Illustration | Drawing a Nature ...
- How to Draw a Natural Landscape | Drawing Illustration | Drawing ...
- How to Draw a Natural Landscape | Design elements - Geography ...
- Water cycle diagram | Drawing a Nature Scene | Drawing Illustration ...
- Drawing a Nature Scene | Beauty in nature Illustrations and Clipart ...
- Water cycle diagram | Beauty in nature Illustrations and Clipart ...

