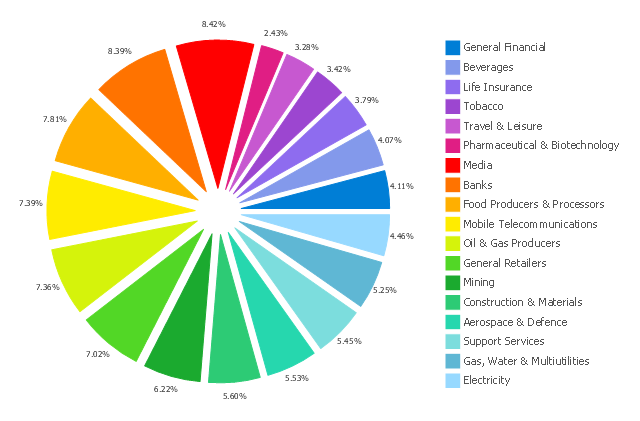
This exploded pie chart sample shows the economic sector weightings. It was designed on the base of the Wikimedia Commons file: Badpie.png [commons.wikimedia.org/ wiki/ File:Badpie.png].
This image is available under the Creative Commons Attribution-ShareAlike 3.0 Unported License [creativecommons.org/ licenses/ by-sa/ 3.0/ ].
"The classical breakdown of all economic sectors follows:
Primary: Involves the retrieval and production of raw materials, such as corn, coal, wood and iron. (A coal miner and a fisherman would be workers in the primary sector.)
Secondary: Involves the transformation of raw or intermediate materials into goods e.g. manufacturing steel into cars, or textiles into clothing. (A builder and a dressmaker would be workers in the secondary sector.)
Tertiary: Involves the supplying of services to consumers and businesses, such as baby-sitting, cinema and banking. (A shopkeeper and an accountant would be workers in the tertiary sector.)
In the 20th century, it began to be argued that traditional tertiary services could be further distinguished from "quaternary" and quinary service sectors." [Economic sector. Wikipedia]
The exploded pie chart example "Economic sector weightings" was created using the ConceptDraw PRO diagramming and vector drawing software extended with the Pie Charts solution of the Graphs and Charts area in ConceptDraw Solution Park.
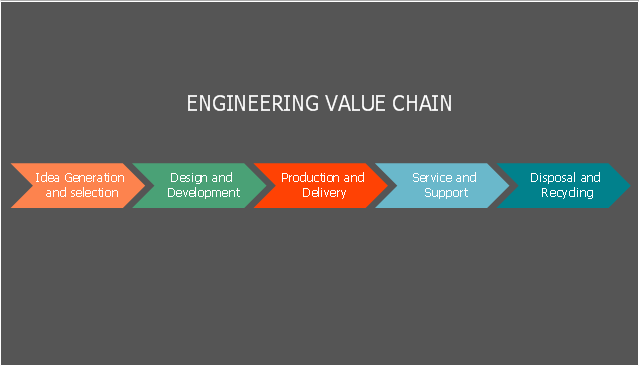
This step chart sample was created on the base of the webpage from the website Invest Punjab (Invest Punjab,
Punjab Bureau of Investment Promotion).
"Opportunities in Agro and Food Processing sector in Punjab:
(1) “Food Bowl of India” - Leading food producer of India with intensive cultivation of 2-3 crops per year.
(2) Highly mechanized agricultural practices with irrigation network available to 98% of the cultivable land.
(3) Robust infrastructure and a well developed ecosystem." [progressivepunjab.gov.in/ opportunitiesdetails.aspx?id=7]
The step chart example "Opportunities in agro and food processing sector in Punjab" was created using the ConceptDraw PRO diagramming and vector drawing software extended with the Marketing Diagrams solution from the Marketing area of ConceptDraw Solution Park.
- Draw A Flow Chart To Show The Primary Sector Of Any Good The
- Draw A Picture That Represent Tertiary Sector
- Draw A Picture That Represents A Product Of Primary Secondary ...
- Tertiary Sector Drawing Photos
- Stakeholder Onion Diagrams | Draw Or Design A Picture That ...
- Economic sector weightings | Primary Secondary And Tertiary ...
- Draw Are Pictures That Represents Primary Sector Secondary
- Primary Sector Secondary Sector Tertiary Sector Diagram That Can
- Graph Representation Of Primary Secondary And Tertiary Sector

