Business diagrams & Org Charts with ConceptDraw DIAGRAM
The business diagrams are in great demand, they describe the business processes, business tasks and activities which are executed to achieve specific organizational and business goals, increase productivity, reduce costs and errors. They let research and better understand the business processes. ConceptDraw DIAGRAM is a powerful professional cross-platform business graphics and business flowcharting tool which contains hundreds of built-in collections of task-specific vector stencils and templates. They will help you to visualize and structure information, create various Business flowcharts, maps and diagrams with minimal efforts, and add them to your documents and presentations to make them successful. Among them are Data flow diagrams, Organization charts, Business process workflow diagrams, Audit flowcharts, Cause and Effect diagrams, IDEF business process diagrams, Cross-functional flowcharts, PERT charts, Timeline diagrams, Calendars, Marketing diagrams, Pyramids, Target diagrams, Venn diagrams, Comparison charts, Analysis charts, Dashboards, and many more. Being a cross-platform application, ConceptDraw DIAGRAM is very secure, handy, free of bloatware and one of the best alternatives to Visio for Mac users.
Simple & Fast Diagram Software
It is so simple making the drawing process easier and faster. you just need to choose the right drawing software. ConceptDraw Arrows10 Technology - This is so easy and fast to draw any type of diagram with any degree of complexity.
Network Diagramming Software for Design Rack Diagrams
Rack Diagrams visualize the rack mounting of computer and network equipment as the drawing of frontal view of the rack with equipment installed. They are used for choosing the equipment or racks to buy, and help to organize equipment on the racks virtually, without the real installation. Network Diagramming Software - ConceptDraw DIAGRAM is perfect for software designers and software developers who need to draw Rack Diagrams.
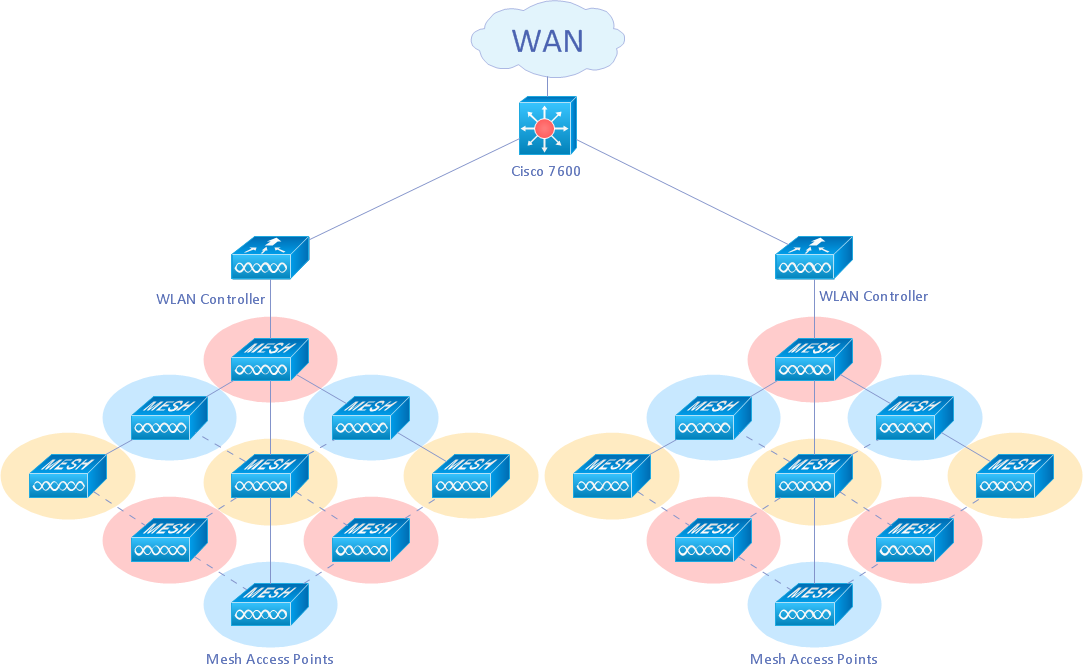
Wireless Network Drawing
The Wireless Network solution helps users to quickly transition from an idea to the implementation of a wireless computer network. ConceptDraw DIAGRAM is well placed to provide experienced and comprehensive assistance in the workplace. The vector stencils, examples, and templates included to solution is a strong toolset for network engineer.HelpDesk
How to Draw a Chemical Process Flow Diagram
Process Flow Diagram widely used in modeling of processes in the chemical industry. A Chemical Process Flow diagram (PFD) is a specialized type of flowchart. With the help of Chemical Process Flow Diagram engineers can easily specify the general scheme of the processes and chemical plant equipment. Chemical Process Flow Diagram displays the real scheme of the chemical process, the relationship between the equipment and the technical characteristics of the process. Chemical Process Flow Diagram illustrates the connections between the basic equipment as well as the overall structure of pipelines and other supporting equipment. The purpose of the PFD is to build the image of the basic idea of the chemical process. ConceptDraw DIAGRAM together with its Chemical and Process Engineering solution delivers the possibility to design Chemical Process Flow diagrams. It is designed for chemical industry engineers and designers.ConceptDraw DIAGRAM ER Diagram Tool
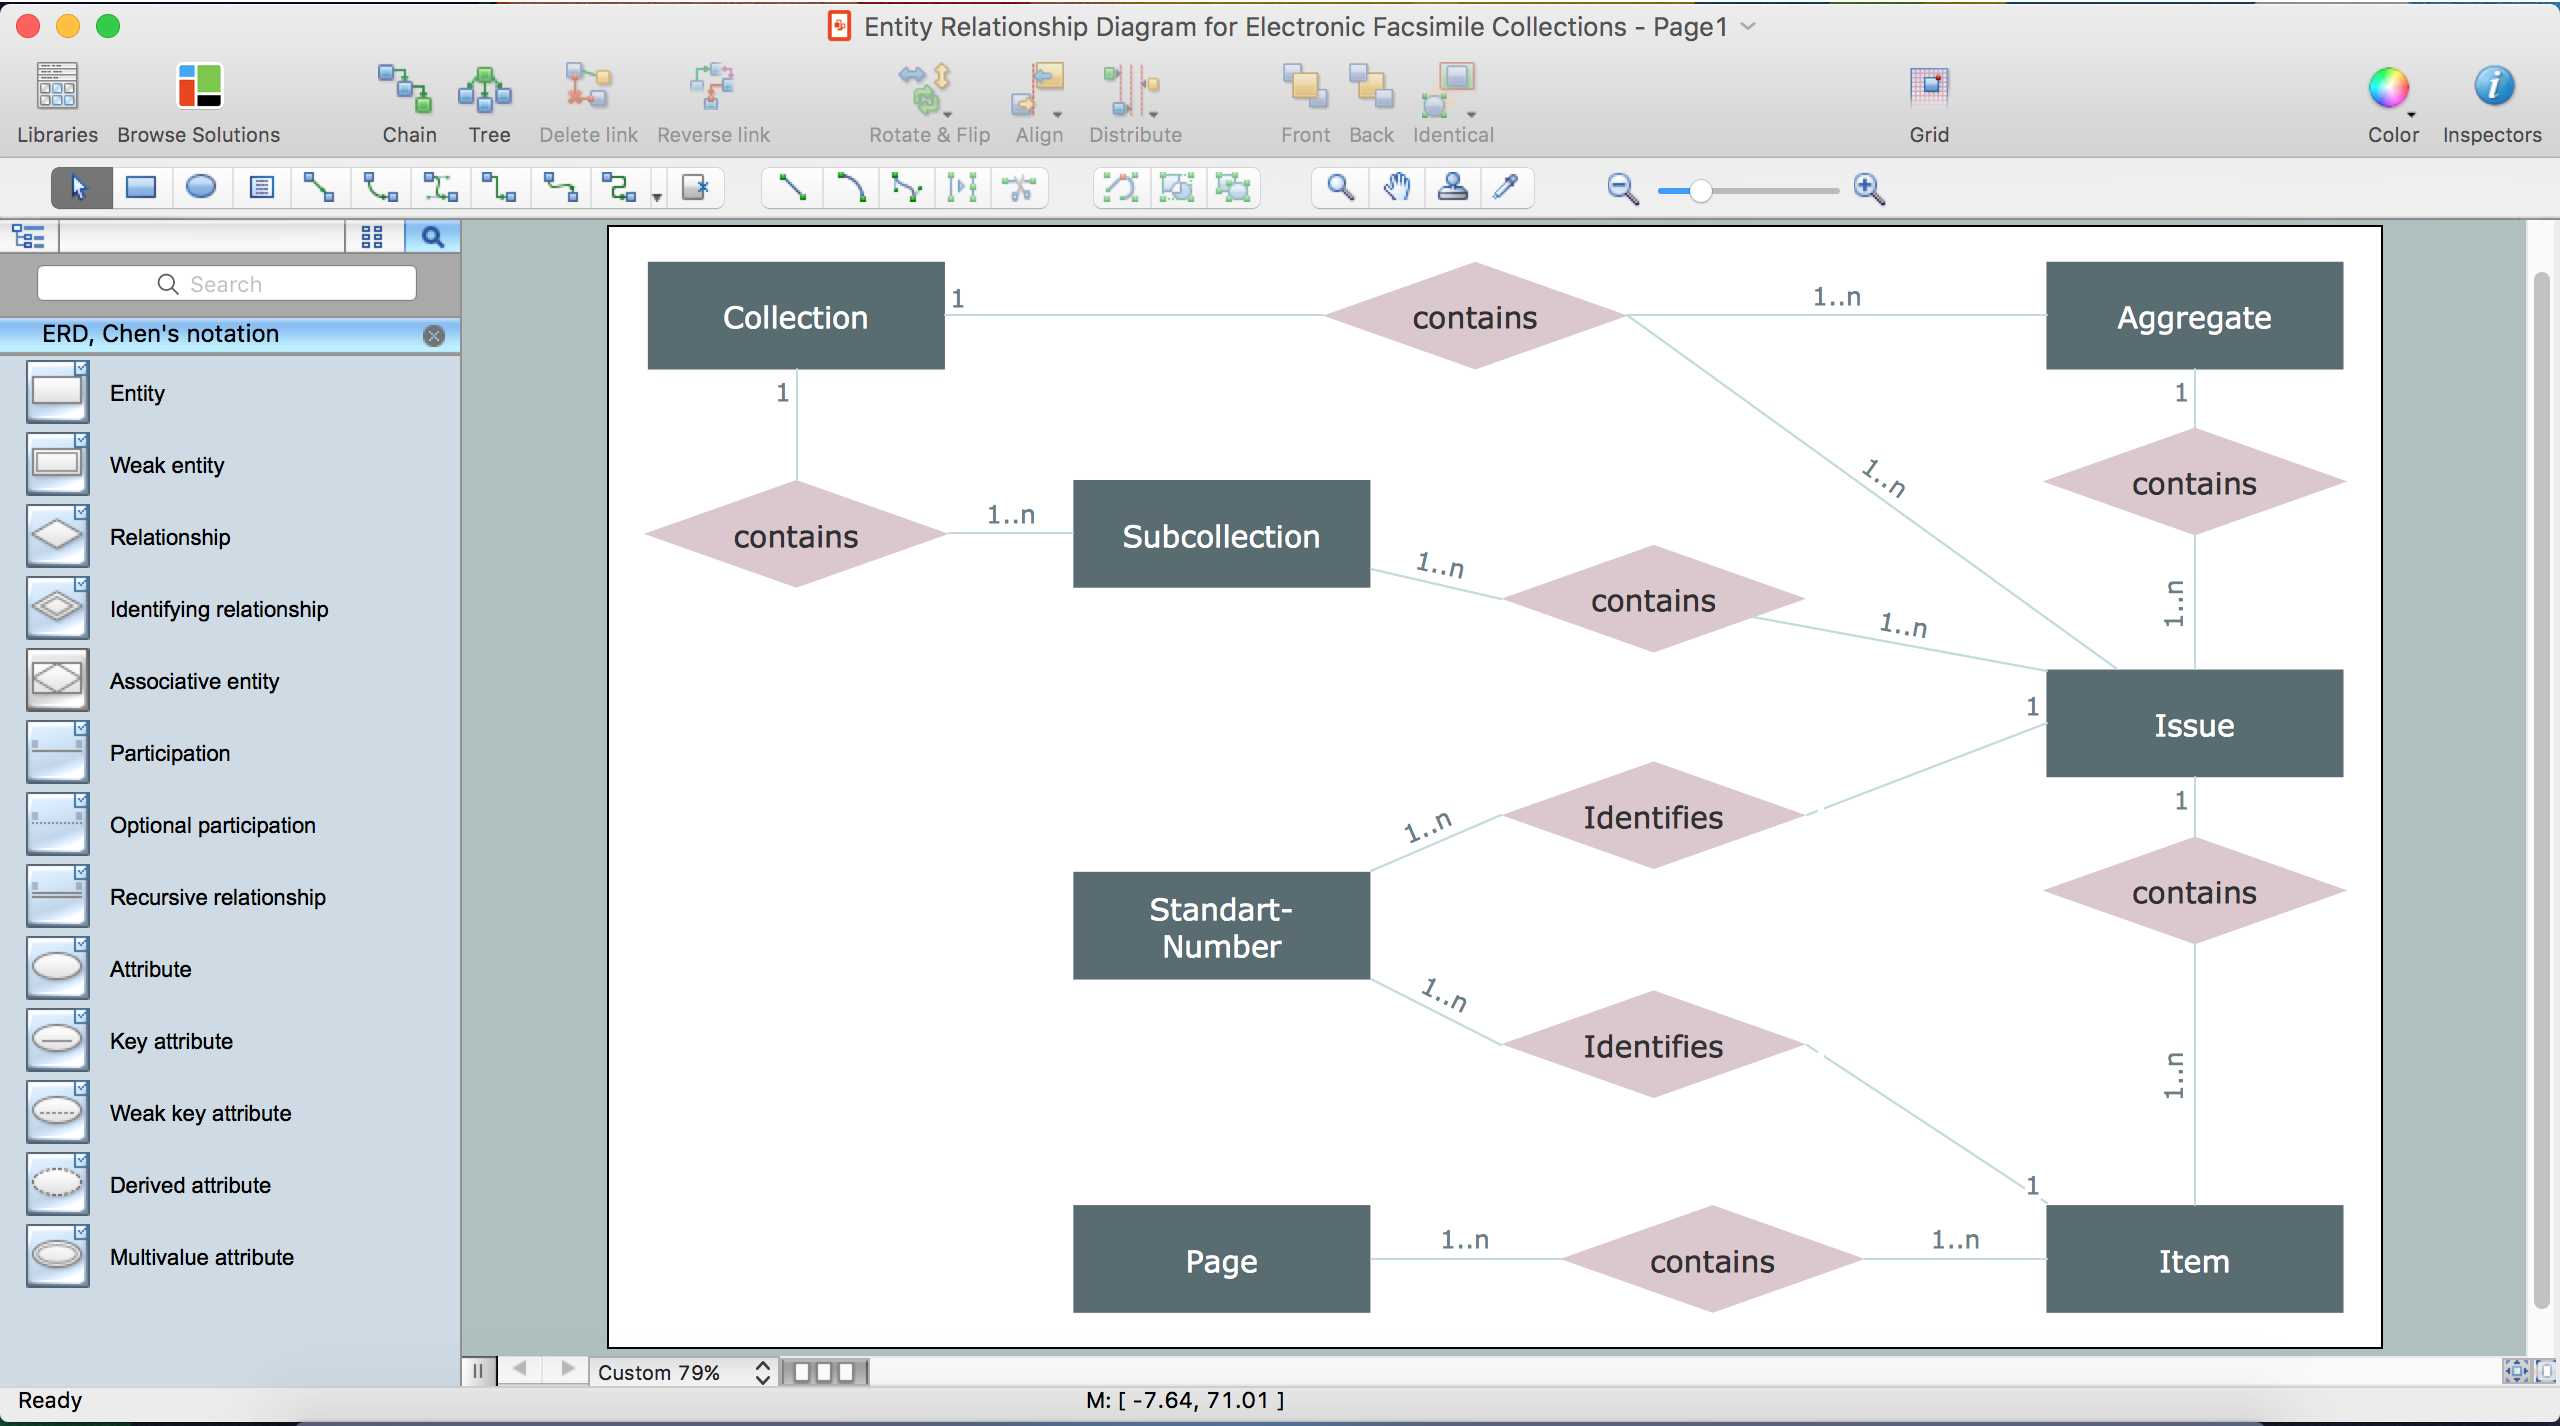
Entity-relationship model, also called ER-model, is the main tool of domain modeling on the stage of conceptual design. The modeling of domain data structures is based on the use of graphical tools - Entity-Relationship diagrams (ER-diagrams). The core concepts of ER-Diagram are entity, attribute and relationship. ER-diagram lets visually represent the entities, helps effectively document all properties of designed system and to detail the data storages. To represent the elements at ER-model are commonly used Chen’s notation and Crow’s foot notation, each has its pros and cons. The entity on ER-diagram is represented in the form of rectangle, which specifies its name. An attribute is a property of the entity and relationship is an interaction between the entities. The relationship between two entities is called binary, between more than two entities - ternary. Specific software, such as ConceptDraw DIAGRAM with Entity-Relationship Diagram (ERD) solution from ConceptDraw Solution Park is helpful for easy creation Entity-Relationship Diagrams.Building Drawing Software for Designing Plumbing
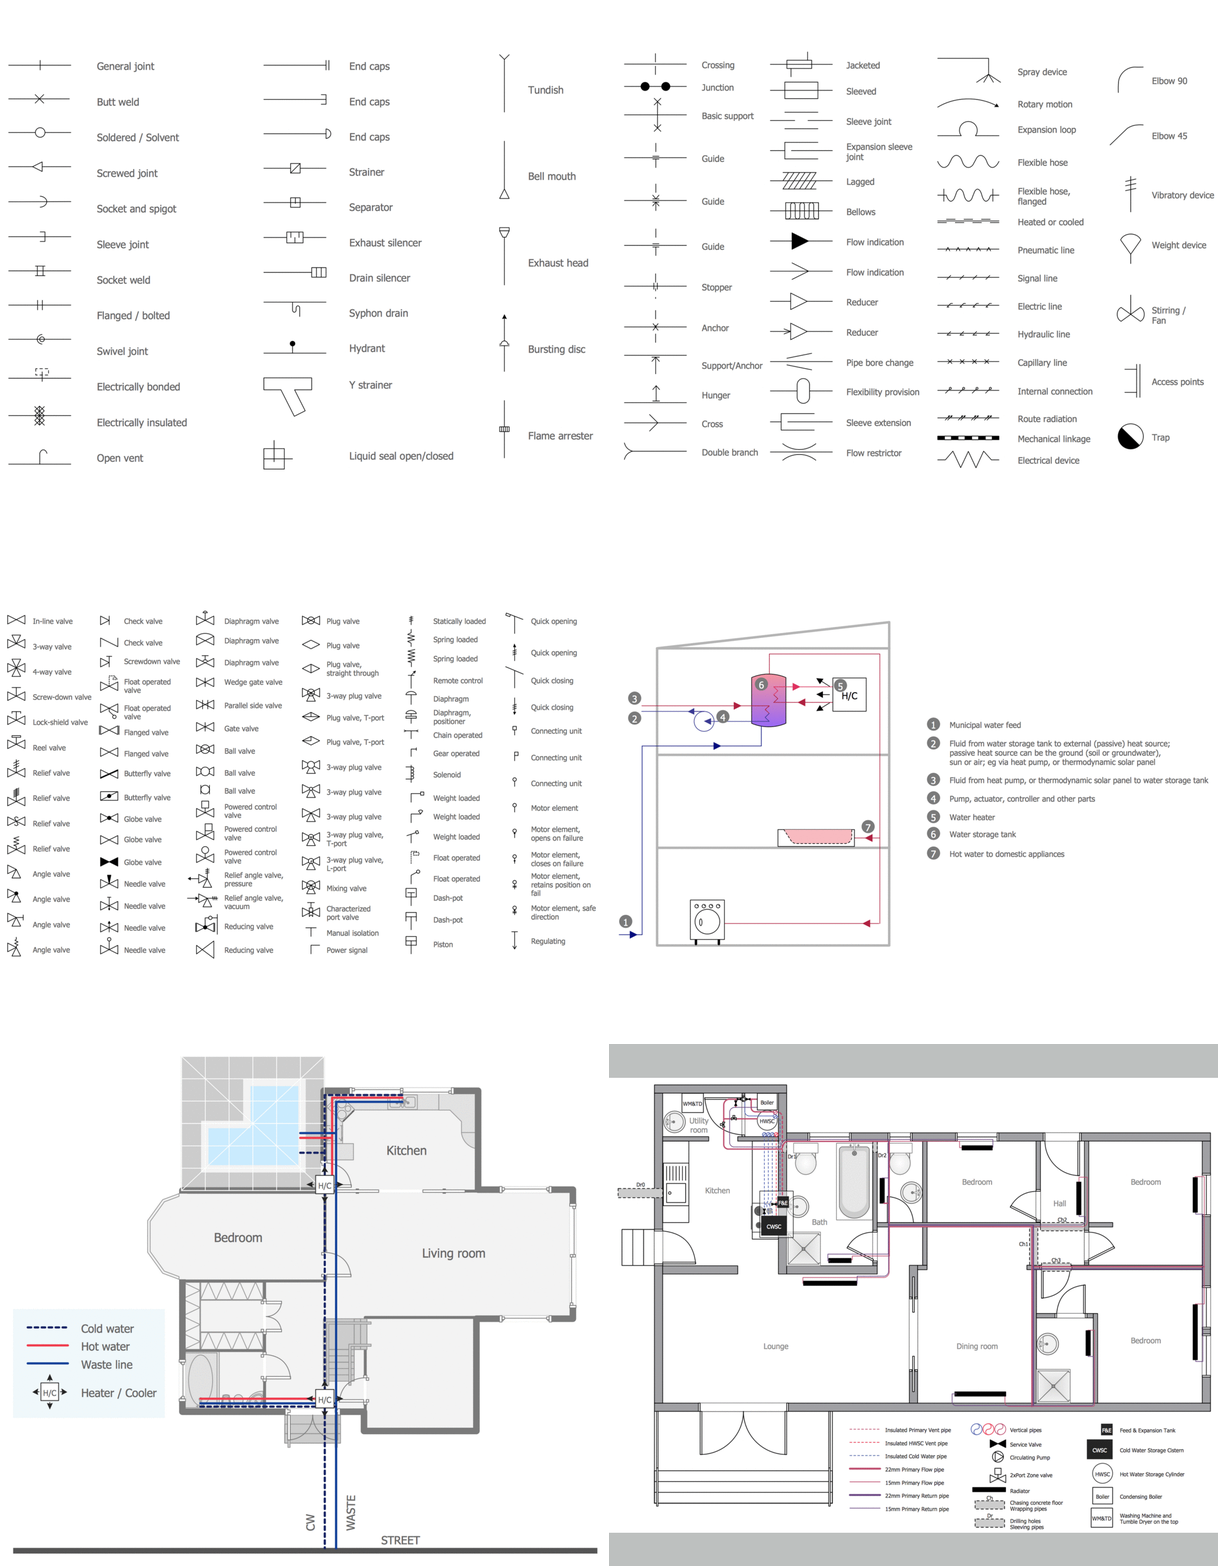
The construction project for any building obligatory must include the plans for systems of water supplying, sewerage, lighting and heating. From one side these are the documents required and indispensable for the construction, but from the other side this is a way of correct and effective selection of equipment, and subsequent its installation. Correctly performed calculations for these systems ensure a reliable, energy-efficient and cost-effective work. At this each project is fully individual decision taking into account all nuances - from the features of building to the personal preferences. ConceptDraw DIAGRAM is a powerful building drawing software for designing Plumbing, Piping, Lighting and other building plans thanks to the included Plumbing and Piping Plans solution and other solutions from Building Plans area. Plumbing and Piping Plans solution includes variety of libraries with different design elements of pipes, valves and other sanitary equipment and helps easy develop the annotated schematics and diagrams of plumbing systems, piping, and waste water.
Drawing ER diagrams on a Mac
The drawing of ER diagrams on a Mac, PC with Windows or on the computer with cross-platform environment is smooth and incredibly easy when you have professional ERD drawing software tool well-suited for both these platforms. ConceptDraw DIAGRAM software extended with Entity-Relationship Diagram (ERD) solution from Software Development Area of ConceptDraw Solution Park is certainly the best tool for drawing ER diagrams. Use the powerful drawing tools of the Entity-Relationship Diagram (ERD) solution, built-in templates, samples, examples and 2 libraries ERD Chen's Notation and ERD Crow’s Foot Notation with numerous predesigned vector objects for easy drawing the ER diagram of any type that you need. A few simple steps will allow you to achieve the best result and design great-looking ER diagram: drag the required vector objects from the libraries offered by Entity-Relationship Diagram (ERD) Solution on your document, connect them in a needed order, apply the commands from the Action menus of these objects, edit the diagram's style with Line, Fill, Shadow and Text tools.HelpDesk
How to Create a Cloud Computing Diagram
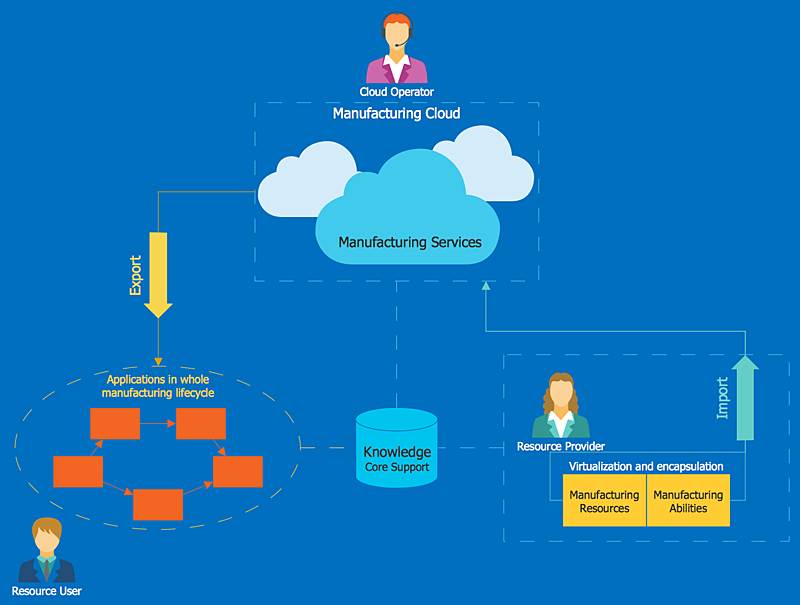
Cloud computing is a model of remote access to shared computing resources that are physically distributed in many remote devices. Cloud Computing is a technology that allows using the Internet to place computing resources and the provision of such services to customers. Using cloud computing means assigning responsibilities on applications and data storage service among special systems, which have a very high level of reliability and unlimited resources. The result is reducing the cost of service and providing users with ready-to-use service. ConceptDraw's Cloud Computing Diagrams solution allows you to visualize cloud computing models of any configuration and complexity.Draw Diagram on Mac
Professional diagramming software for mac helps you create Cause and Effect diagram known as Fishbone diagram or Ishikawa diagram from ConceptDraw Business Solution. You will be offered to use templates, samples or draw your diagram using ConceptDraw Arrows10 Technology- Data Flow Diagram Drawing Tool Online
- Draw A Sketch Of System Development Cycle
- Draw An Er Diagram Using Word
- Tool To Draw Conceptual Model
- Chemical and Process Engineering | How to Draw a Chemical ...
- ConceptDraw PRO ER Diagram Tool | How to Draw ER Diagrams ...
- Technical Drawing Software | Process Flow Diagram Symbols ...
- Drawing ER diagrams on a Mac | ER diagram tool for OS X | What's ...
- Mechanical Drawing Symbols | Mechanical Engineering ...
- Network Diagram Software (PRO) | Drawing Tool On Drawing ...


_Win_Mac.png)
