CORRECTIVE ACTIONS PLANNING. Risk Diagram (PDPC)
Risk Diagram (PDPC) - ConceptDraw Office suite is a software for Risks Diagram making. This diagram identifies possible risks in accomplishing corrective actions. With the Risks Diagram, one analyzes each action separately in a tree of all actions and develops a preventive action in response of each potential obstacles or circumstances which may be a risk.
The Action Plan
Action Plan - For the action planning define people and groups involvement in corrective actions by roles, identify logical sequences of scheduled actions and critical path of problem solving, identify possible risks of action plan and propose preventive actions. ConceptDraw Office suite is a software for decision making and action plan.
Corrective Action Planning
One of the stages of the problem's solving process scenario is Corrective Action Planning. Corrective action planning define people and groups involvement in corrective actions by roles, identify logical sequences of scheduled actions and critical path of problem solving, identify possible risks of action plan and propose preventive actions.
Decision Making
Decision Making - ConceptDraw Office suite provides visual tools that are given support on the stage of the decision making. The Seven Management and Planning Tools is a set for such diagrams: Affinity Diagram, Relations Diagram, Prioritization Matrix, Root Cause Tree Diagram, Involvement Matrix, PERT Chart, Risk Diagram (PDPC).
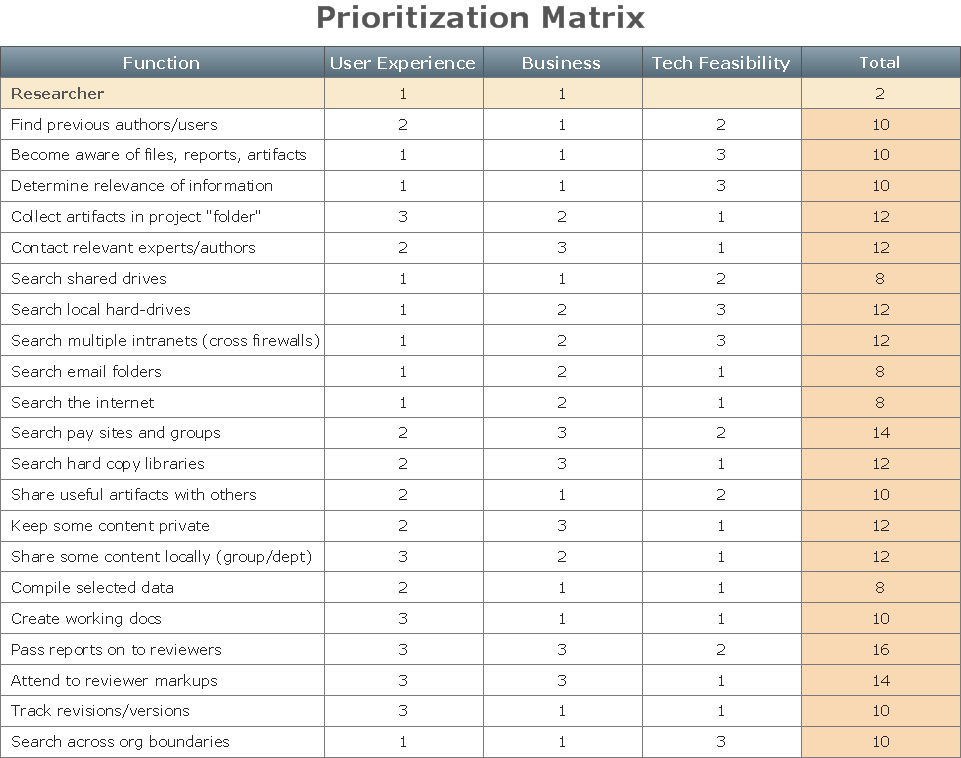
Prioritization Matrix
You can design the Prioritization Matrix by hand on the paper, but we offer you the most easier way - to use the ConceptDraw PRO diagramming and vector drawing software extended with Seven Management and Planning Tools Solution from the Management Area.Cross-Functional Flowchart
Use of Cross-Functional Flowchart is a clear way of showing each team member’s responsibilities and how processes get shared or transferred between different responsible people, teams and departments. Use the best flowchart maker ConceptDraw PRO with a range of standardized cross-functional flowchart symbols to create the Cross-Functional Flowcharts simply and to visualize the relationship between a business process and the functional units responsible for that process. To draw the most quickly Cross-Functional Flowcharts, Cross Functional Process Maps, or Cross Functional Process Flow Diagrams, start with a Cross-functional flowchart samples and templates from ConceptDraw Solution Park. The ConceptDraw Arrows10 and RapidDraw technologies will be also useful for you in drawing. ConceptDraw PRO supports designing both types - horizontal and vertical Cross-functional flowcharts. A vertical layout makes the accents mainly on the functional units while a horizontal layout - on the process. If you need a Visio alternative in Mac OS X, try ConceptDraw PRO. Its interface is very intuitive and it’s actually much easier to use than Visio, yet somehow it’s just as powerful if not more so. ConceptDraw PRO performs professional quality work and seamless Visio interaction.
 Entity-Relationship Diagram (ERD)
Entity-Relationship Diagram (ERD) solution extends ConceptDraw PRO software with templates, samples and libraries of vector stencils from drawing the ER-diagrams by Chen's and crow’s foot notations.
 Calendars
Calendars solution extends ConceptDraw PRO software with templates, samples and library of vector stencils for drawing the business calendars and schedules.
- Prioritization matrix - Health care problems | Seven Management ...
- PROBLEM ANALYSIS. Prioritization Matrix | Prioritization Matrix ...
- CORRECTIVE ACTIONS PLANNING PERT Chart | Corrective Action ...
- Relationships Analysis | PROBLEM ANALYSIS. Relations Diagram ...
- CORRECTIVE ACTIONS PLANNING. Risk Diagram (PDPC ...
- CORRECTIVE ACTIONS PLANNING. Risk Diagram (PDPC) | The ...
- PROBLEM ANALYSIS. Root Cause Analysis Tree Diagram ...
- Affinity Diagram In Healthcare
- Schedule Planning Pert Chart Software
- Health Planning Diagram
- Corrective Action Planning
- CORRECTIVE ACTIONS PLANNING. Risk Diagram (PDPC) | How ...
- Using Fishbone Diagrams for Problem Solving | Relations diagram ...
- PROBLEM ANALYSIS. Root Cause Analysis Tree Diagram ...
- UML Sequence Diagram Example. SVG Vectored UML Diagrams ...
- PROBLEM ANALYSIS. Root Cause Analysis Tree Diagram ...
- Diagram Of Health Management
- PROBLEM ANALYSIS. Prioritization Matrix | Problem solving ...
- The Action Plan
- CORRECTIVE ACTIONS PLANNING. Risk Diagram (PDPC ...


