 Entity-Relationship Diagram (ERD)
An Entity-Relationship Diagram (ERD) is a visual presentation of entities and relationships. That type of diagrams is often used in the semi-structured or unstructured data in databases and information systems. At first glance ERD is similar to a flowch
Language School E-Learning
E-Learning in Schools: Online Language Teaching tools. E-Learning software for remote presentations with Skype. Best practices for eLearning.
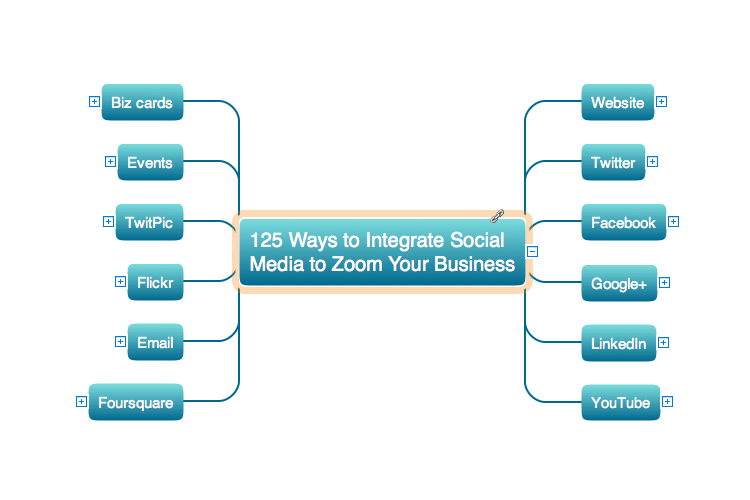
How it works : eLearning
Online Tools for eLearning: How to Make Online Trainings. Remote Presentations via Skype. Mind map that allows professors and teachers at all levels of the education collaborate in real time.
Skype as eLearning Platform
eLearning Solutions: Free Platform for Remote Learning. Skype as a remote education tool. Digital Learning Technologies.
eLearning for Leadership
Digital Learning Tools & Technologies. Online training with Skype for effective classrooms. Changing perceptions of leadership and learning.
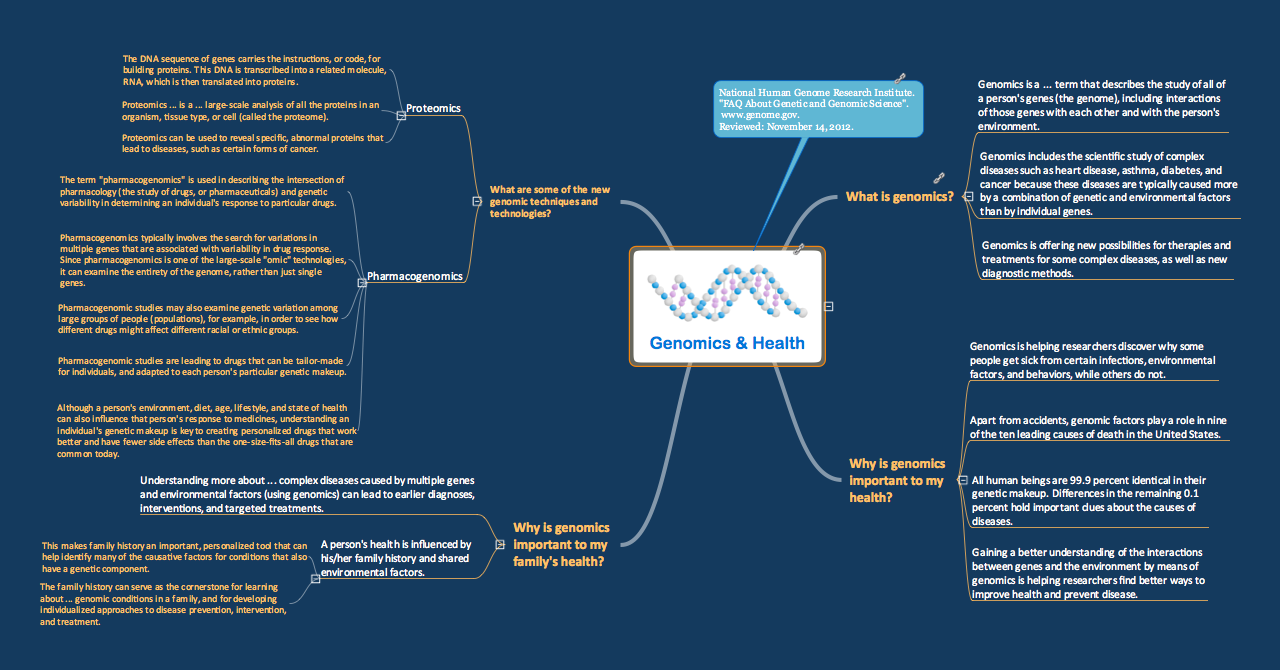
How Teachers Use Skype for eLearning
Teachers use Skype in the classroom to enrich experiences for students. Using mind mapping software in virtual classrooms for brainstorming and presentation make an effective way to gather information and track results.
Example of DFD for Online Store (Data Flow Diagram)
Data Flow Diagram (DFD) is a methodology of graphical structural analysis and information systems design, which describes the sources external in respect to the system, recipients of data, logical functions, data flows and data stores that are accessed. DFDs allow to identify relationships between various system's components and are effectively used in business analysis and information systems analysis. They are useful for system’s high-level details modeling, to show how the input data are transformed to output results via the sequence of functional transformations. For description of DFD diagrams are uses two notations — Yourdon and Gane-Sarson, which differ in syntax. Online Store DFD example illustrates the Data Flow Diagram for online store, the interactions between Customers, Visitors, Sellers, depicts User databases and the flows of Website Information. ConceptDraw DIAGRAM enhanced with Data Flow Diagrams solution lets you to draw clear and simple example of DFD for Online Store using special libraries of predesigned DFD symbols.
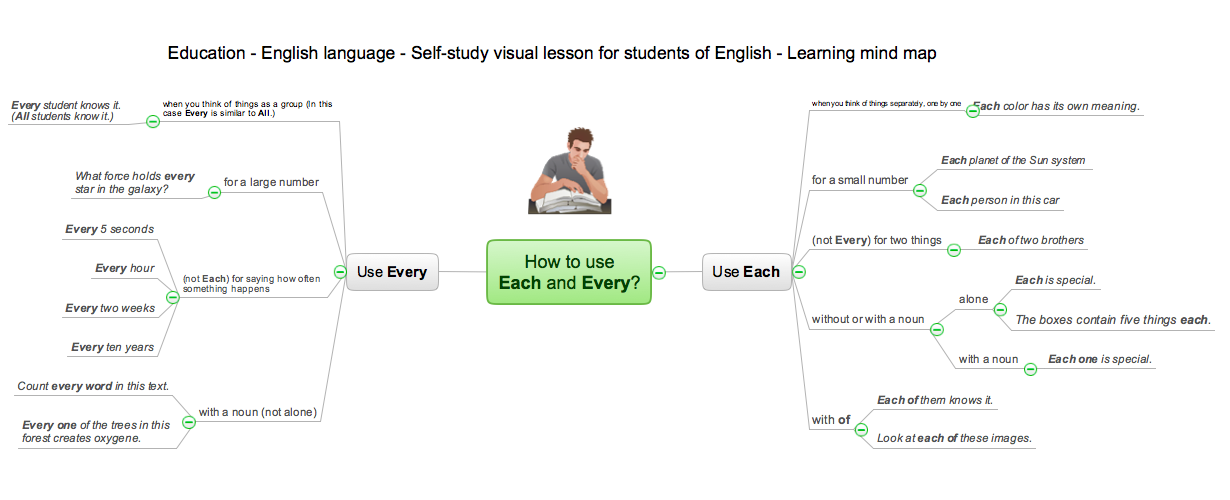
eLearning - Easy English on Skype
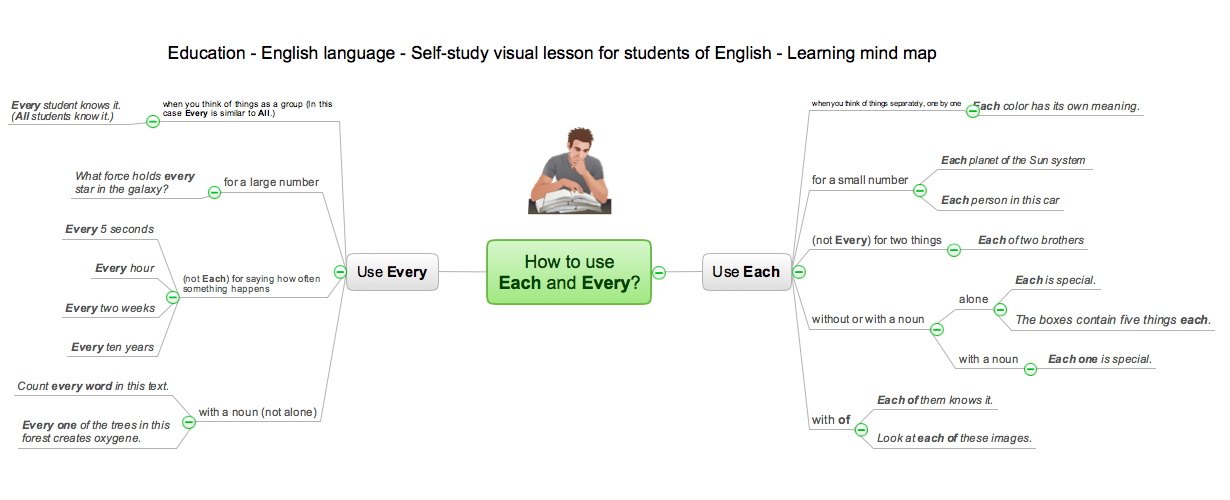
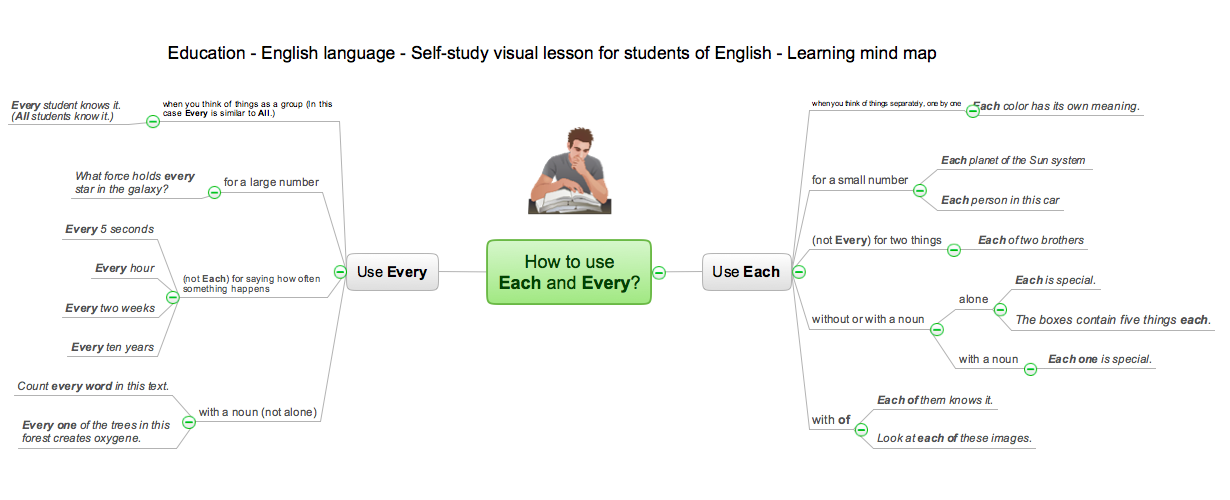
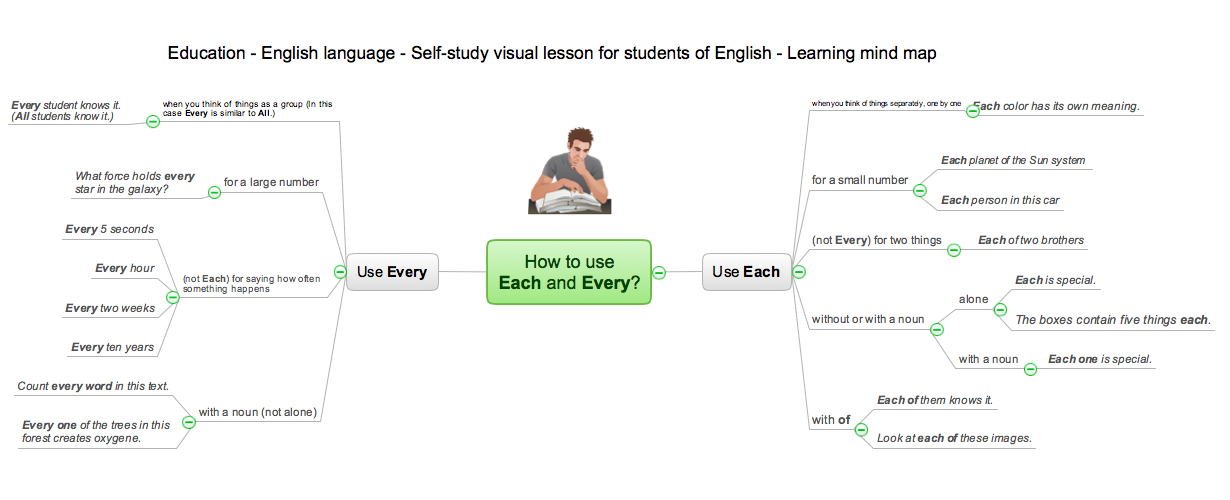
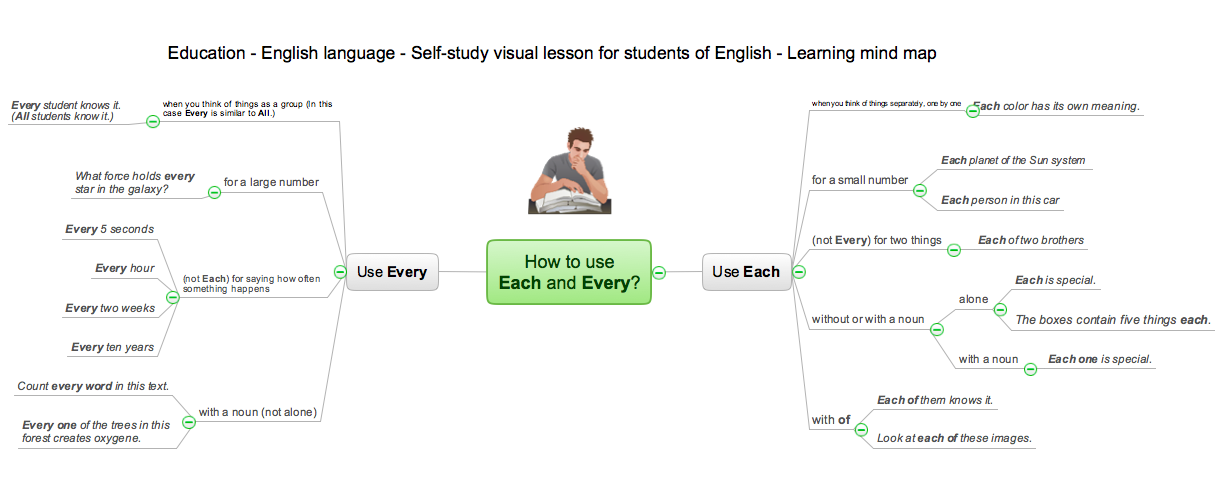
Learning English On-line using Skype. Mind map as a presentation makes it powerful tool for eLearning. E-Learning tools are slideshows, presentations, videos, mind maps.
eLearning - International Teaching Community
eLearning Solutions for Teachers: Connecting Students Worldwide. Free Platform for Remote Learning. Skype as a remote education tool. Remote collaboration and presentation.
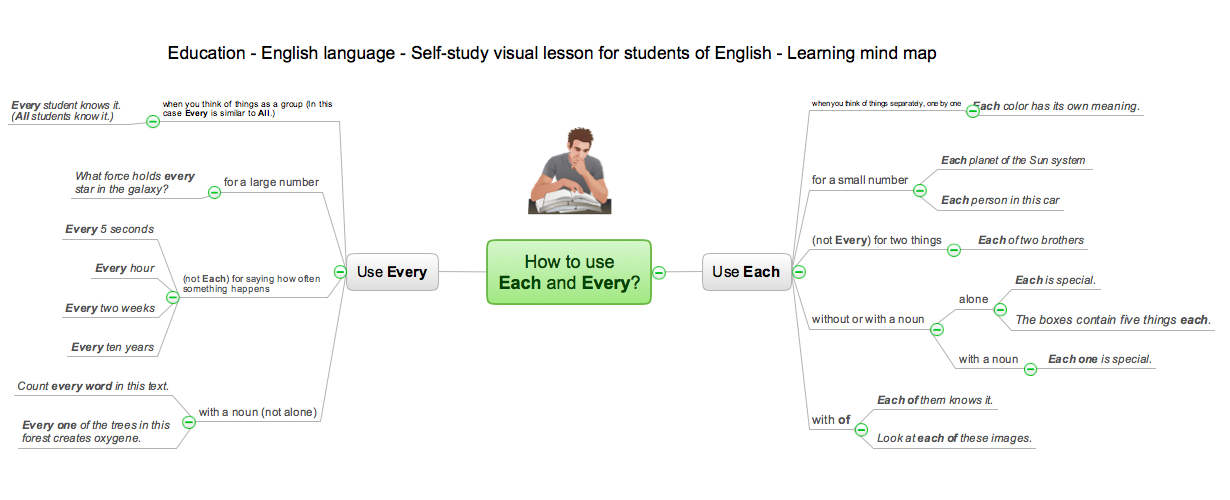
eLearning: Speaking English
Innovative Education Solutions: English Speaking Online Classroom. How to study Online with live teacher at real time.
- ER Diagram Of E Learning System
- Erd E Learning
- eLearning for Skype | Entity-Relationship Diagram ( ERD ) | E-R ...
- eLearning for Skype | Entity-Relationship Diagram ( ERD ) | Entity ...
- eLearning for Skype | Entity-Relationship Diagram ( ERD ) | Fishbone ...
- Activity Diagram For E Learning System
- Elearning Erd
- Wireless Networks | E R Diagram For Distance Learning
- Remote Presentation for Skype | eLearning for Skype | How to ...
- Sample Erd Model For An E Learning System
