This site uses cookies. By continuing to browse the ConceptDraw site you are agreeing to our Use of Site Cookies.

Astronomy and Astrology

Astronomy and astrology require from the specialists permanent drawing wide variety of illustrations, sketches. It’s convenient for astronomers and astrologers to have software that will help design them quick and easy. ConceptDraw DIAGRAM diagramming and vector drawing software extended with Astronomy solution from the Science and Education area is exactly what they need.

Physics Symbols

ConceptDraw DIAGRAM diagramming and vector drawing software extended with Physics solution from the Science and Education area is a powerful software for creating various physics diagrams. Physics solution provides all tools that you can need for physics diagrams designing. It includes 3 libraries with predesigned vector physics symbols: Optics Library, Mechanics Library and Nuclear Physics Library.

directional map, maps and directions, maps driving directions, map directions, directions map, maps & directions, direction map, map driving directions, direction maps Directional Maps

directional map, maps and directions, maps driving directions, map directions, directions map, maps & directions, direction map, map driving directions, direction maps
Directional Maps solution extends ConceptDraw DIAGRAM software with templates, samples and libraries of vector stencils for drawing the directional, location, site, transit, road and route maps, plans and schemes.
The vector stencils library "Astronomical symbols" contains 58 astronomical symbols and astrological signs of Solar system planets, stars, Sun, Moon, Earth, constellations, Mercury, Venus, Mars, Saturn, Jupiter, Uranus, Neptune, comet, Zodiac signs.
"Astronomical symbols are symbols used to represent various celestial objects, theoretical constructs and observational events in astronomy. The earliest forms of these symbols appear in Greek papyri of late antiquity. The Byzantine codices in which the Greek papyri were preserved continued and extended the inventory of astronomical symbols. New symbols were further invented to represent many just-discovered planets and minor planets discovered in the 18th-20th centuries.
All these symbols were once commonly used by professional astronomers, amateur astronomers, and astrologers. While they are still commonly used in almanacs and astrological publications, their occurrence in published research and texts on astronomy is relatively infrequent, with some exceptions such as the Sun and Earth symbols appearing in astronomical constants, and certain zodiacal signs used to represent the solstices and equinoxes." [Astronomical symbols. Wikipedia]
The pictograms example "Design elements - Astronomical symbols" was created using the ConceptDraw PRO diagramming and vector drawing software extended with the Astronomy solution from the Science and Education area of ConceptDraw Solution Park.
Astronomical signs
Astronomical signs, Venus, V, Uranus, U, Taurus, Tau, Sun, Star, Solar radius, Solar mass, Solar luminosity, Solar effective temperature 	, Scorpius, Sco, Saturn, S, Sagittarius, Sgr, Quadrature, Pisces, Psc, Opposition, New moon, Neptune, Moon, or last-quarter moon, Moon, or first-quarter moon, Mercury, Me, Mars, Ma, Leo, Jupiter, J, Gemini, Gem, Full moon, Earth, E, Descending node, Conjunction, Comet, Capricornus, Cap	, Cancer, Cnc, Ascending node, Aries, Ari, Aquarius, Aqr, 9 Metis, 8 Flora, 7 Iris, 6 Hebe, 5 Astraea, 4 Vesta, 37 Fides, 3 Juno, 29 Amphitrite, 28 Bellona, 26 Proserpina, 2 Pallas, 19 Fortuna, 18 Melpomene, 17 Thetis, 16 Psyche, 15 Eunomia, 14 Irene, 134340 Pluto, 13 Egeria, 12 Victoria, 11 Parthenope, 10 Hygeia, 1 Ceres,

Illustration Software

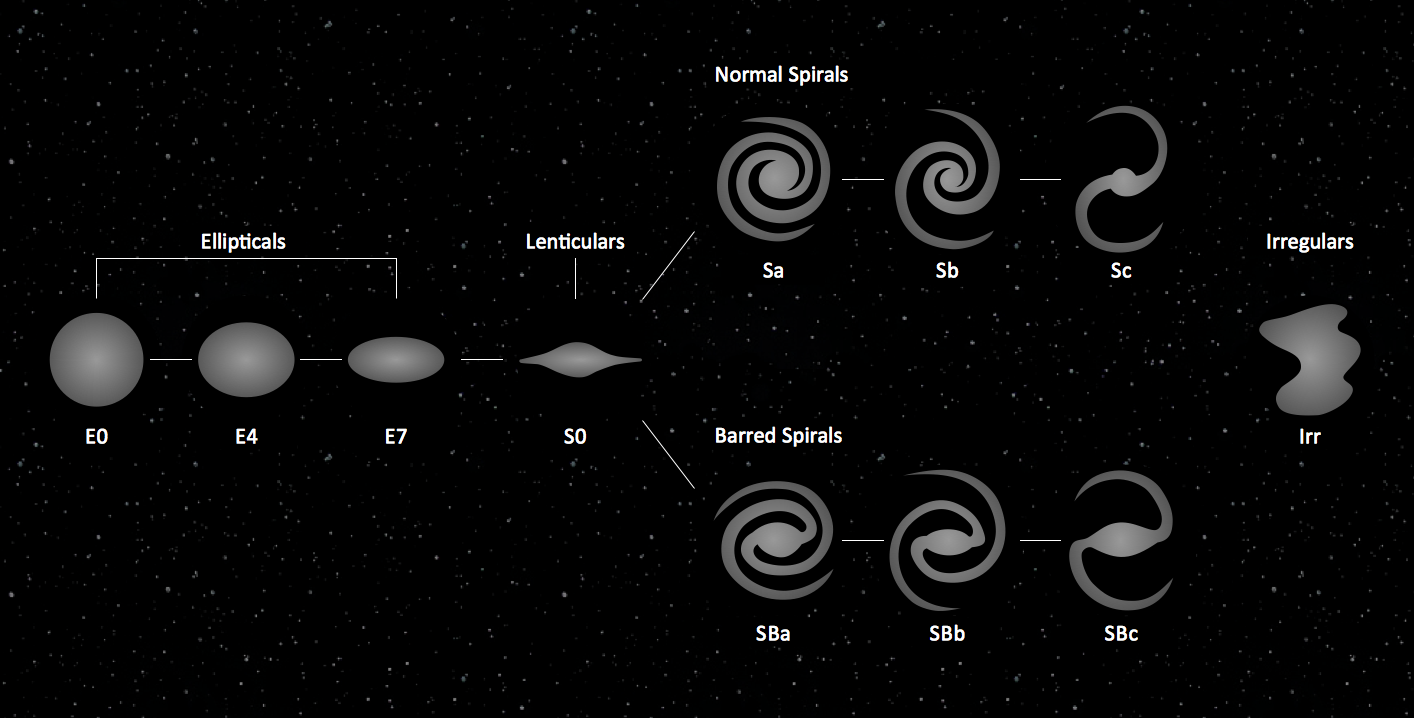
No science can't exist without illustrations, and especially astronomy! Illustrations help to visualize knowledge, natural phenomenons which are studied by astronomy, they equally effective help in work, during the learning process and on the conferences. Now we have professional astronomy illustration software - ConceptDraw DIAGRAM illustration and sketching software with templates, samples and libraries of a variety of astronomy symbols, including constellations, galaxies, stars, and planet vector shapes; a whole host of celestial bodies. When drawing scientific and educational astronomy illustrations, astronomy pictures and diagrams, can help you reach for the stars!
"In association football, the formation describes how the players in a team are positioned on the pitch. Different formations can be used depending on whether a team wishes to play more attacking or defensive football. ...
The WM system was created in the mid-1920s by Herbert Chapman of Arsenal to counter a change in the offside law in 1925. The change had reduced the number of opposition players that attackers needed between themselves and the goal-line from three to two. This led to the introduction of a centre-back to stop the opposing centre-forward, and tried to balance defensive and offensive playing. The formation became so successful that by the late-1930s most English clubs had adopted the WM. Retrospectively, the WM has either been described as a 3–2–5 or as a 3–4–3, or more precisely a 3–2–2–3 reflecting the letters which symbolised it. The gap in the centre of the formation between the two wing halves and the two inside forwards allowed Arsenal to counter-attack effectively. The W-M was subsequently adapted by several English sides, but none could apply it in quite the same way Chapman had. This was mainly due to the comparative rarity of Alex James in the English game. He was one of the earliest playmakers in the history of the game, and the hub around which Chapman's Arsenal revolved." [Formation (association football). Wikipedia]
The diagram example "Association football (soccer) formation 3-2-5 (WM)" was created using the ConceptDraw PRO diagramming and vector drawing software extended with the Football solution from the Sport area of ConceptDraw Solution Park.
www.conceptdraw.com/ solution-park/ sport-soccer
Association football (soccer) formation diagram
Association football  (soccer) formation diagram, midfielder, wide midfield, right midfield, midfielder, wide midfield, left midfield, left wing, midfielder, centre midfield, goalkeeper, end zone view football field, end zone view soccer field, defender, right-back, full-backs, defender, left-back, full-backs,
Used Solutions

user interface design examples, gui software, graphical user interface examples, user interface examples macOS User Interface

user interface design examples, gui software, graphical user interface examples, user interface examples
macOS User Interface solution extends the ConceptDraw DIAGRAM functionality with powerful GUI software graphic design features and tools. It provides an extensive range of multifarious macOS Sierra user interface design examples, samples and templates, and wide variety of libraries, containing a lot of pre-designed vector objects of Mac Apps icons, buttons, dialogs, menu bars, indicators, pointers, controls, toolbars, menus, and other elements for fast and simple designing high standard user interfaces of any complexity for new macOS Sierra.

Sales Process

ConceptDraw DIAGRAM is effective software for a variety of activity fields. Now, extended with Sales Flowcharts solution from the Marketing area of ConceptDraw Solution Park it become also useful in the field of sales. It helps to design professional looking Sales Flowcharts, Sales Process Flowcharts, Sales Process Maps, Plans and Diagrams to effectively realize the process of selling a product or service, and to display the sales results.

Music Notation

Music notation is the symbols used to record and perform music. It helps players to play music correctly, even if they have never heard it before. ConceptDraw DIAGRAM charting and vector drawing software enhanced with Piano Sheet Music solution is a powerful design software to draw musical sheets. The solution includes all necessary drawing tools, professionally designed quick-start templates, attractive samples, and libraries with music notation vector design elements. Simply drag the needed elements from the solution libraries to one of the pre-made sheet music templates and get an excellent result in minutes.

Astronomy Symbols

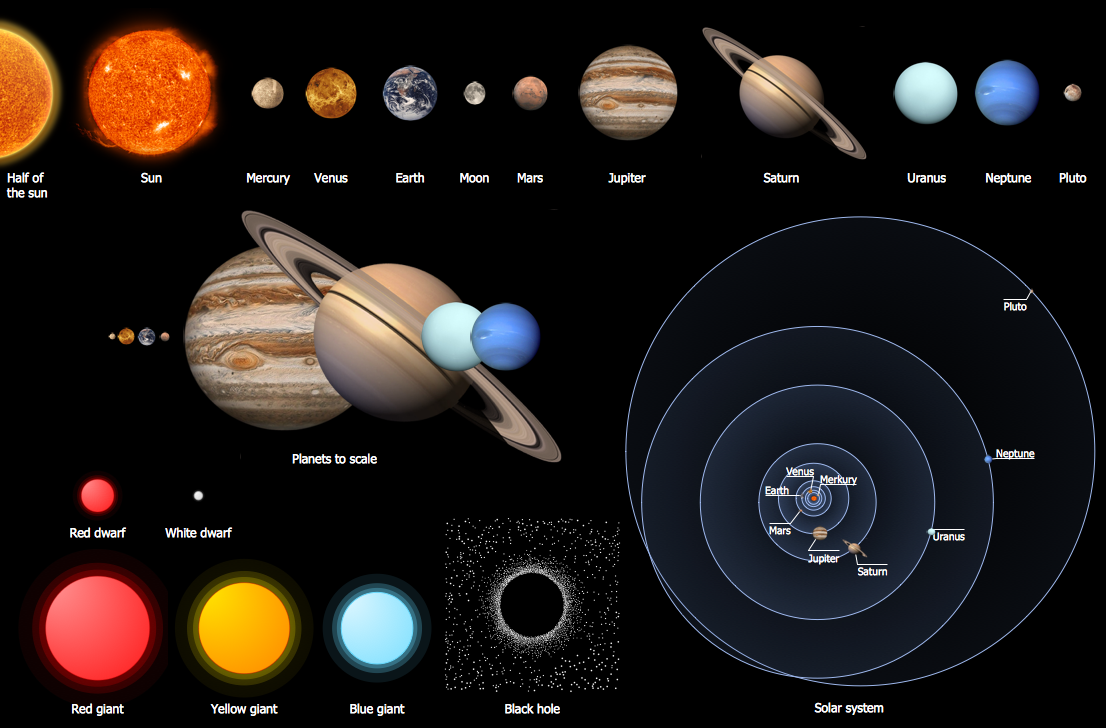
Are you an astronomer, astronomy teacher or student? And you need to draw astronomy pictures quick and easy? ConceptDraw DIAGRAM diagramming and vector drawing software extended with Astronomy solution from the Science and Education area will help you! Astronomy solution provides 7 libraries with wide variety of predesigned vector objects of astronomy symbols, celestial bodies, solar system symbols, constellations, etc.

Process Flow Chart Symbols

Process Flow Chart is a visual diagram which shows the processes and relationships between the major components in a system, and uses for this the special process flow chart symbols: special shapes to represent different types of actions and process steps, lines and arrows to represent relationships and sequence of steps. It often named process flow diagram, it use colored flowchart symbols. It is incredibly convenient to use the ConceptDraw DIAGRAM software extended with Flowcharts Solution from the "Diagrams" Area of ConceptDraw Solution Park for designing professional looking Process Flow Charts.

Ice Hockey Offside Diagram

"Offsides" is a very basic sports term, which can be very hard to explain to a novice. The fundamental concepts in sports can be extremely difficult to convey without a drawing, that's why we included an Offsides Sample in the Hockey solution. Explaining with ConceptDraw in your playbook is easier than ever before!

Sun Solar System

ConceptDraw DIAGRAM diagramming and vector drawing software offers the Astronomy solution with useful tools for drawing all kinds of astronomy pictures and sun solar system illustrations. The astronomy illustrations designed with ConceptDraw DIAGRAM are vector graphic documents and are available for reviewing, modifying, converting to a variety of formats (image, HTML, PDF file, MS PowerPoint Presentation, Adobe Flash or MS Visio XML), printing and send via e-mail in one moment.

Venn diagram, draw logical relations Venn Diagrams

Venn diagram, draw logical relations
Venn Diagrams are actively used to illustrate simple set relationships in set theory and probability theory, logic and statistics, mathematics and computer science, linguistics, sociology, and marketing. Venn Diagrams are also often used to visually summarize the status and future viability of a project.

audio clipart, video clipart, photo camera clipart, CCTV Audio, Video, Media

audio clipart, video clipart, photo camera clipart, CCTV
Use it to make professional-looking documents, impressive presentations, and efficient websites with colorful and vivid illustrations and schematics of digital audio, video and photo gadgets and devices, audio video connections and configurations, S Video connection, HD and 3D television systems, home entertainment systems, Closed-circuit television (CCTV) surveillance systems. All audio video schematics, drawings and illustrations designed in ConceptDraw DIAGRAM are professional looking, clear and understandable for all thanks to applying the most commonly used standards of designations, and are effective for demonstrating in front of a small audience and on the big screens.
This chemical drawing example shows structural formulas of organic molecules - polycyclic aromatic hydrocarbons (PAHs), also known as poly-aromatic hydrocarbons or polynuclear aromatic hydrocarbons: naphthalene, anthracene, triphenylene, acenaphthylene, phenanthrene, pyrene.
"Polycyclic aromatic hydrocarbons (PAHs), also known as poly-aromatic hydrocarbons or polynuclear aromatic hydrocarbons, are fused aromatic rings and do not contain heteroatoms or carry substituents. Naphthalene is the simplest example of a PAH. PAHs occur in oil, coal, and tar deposits, and are produced as byproducts of fuel burning (whether fossil fuel or biomass).
They are potent atmospheric pollutants. Some compounds have been identified as carcinogenic, mutagenic, and teratogenic. PAHs are also found in cooked foods. Studies have shown that high levels of PAHs are found, for example, in meat cooked at high temperatures such as grilling or barbecuing, and in smoked fish.
They are also found in the interstellar medium, in comets, and in meteorites and are a candidate molecule to act as a basis for the earliest forms of life." [Polycyclic aromatic hydrocarbon. Wikipedia]
The chemical drawing example "PAH compounds" was created using the ConceptDraw PRO diagramming and vector drawing software extended with the Chemistry solution from the Science and Education area of ConceptDraw Solution Park.
PAH compounds
PAH compounds, triphenylene, pyrene, phenanthrene, naphthalene, anthracene, acenaphthylene,

bubble diagram, circle-spoke diagram, marketing diagrams, circular arrows diagrams, segmented cycle diagram, Venn diagram, draw logical relations Business Diagrams

bubble diagram, circle-spoke diagram, marketing diagrams, circular arrows diagrams, segmented cycle diagram, Venn diagram, draw logical relations
The Business Diagrams Solution extends ConceptDraw DIAGRAM with an extensive collection of professionally designed illustrative samples and a wide variety of vector stencils libraries, which are the real help for all business-related people, business analysts, business managers, business advisers, marketing experts, PR managers, knowledge workers, scientists, and other stakeholders allowing them to design the bright, neat, expressive and attractive Bubble Diagrams, Circle-Spoke Diagrams, Circular Arrows Diagrams, and Venn Diagrams with different quantity of sets in just minutes; and then successfully use them in documents, reports, statistical summaries, and presentations of any style.

Heating Plan

Heating is a system of raising the temperature in some enclosed space or group of spaces to provide comfort for people keeping inside them. Public Utilities solution helps in the development of innovative strategies and technologies in the public utility field, creating detailed infographics and diagrams concerning heating, plumbing, energy supply, etc. Design easily heating plan, schematics of arrangement heating equipment in the buildings, diagrams of transferring heat from hot water, steam, or electric resistors to the space.

Yourdon and Coad Diagram

The vector stencils library Yourdon and Coad Notation from the solution OOAD contains specific symbols of the Yourdon and Coad notation such as data store symbol, data process symbol, loop symbol for ConceptDraw DIAGRAM diagramming and vector drawing software. The OOAD solution is contained in the Software Development area of ConceptDraw Solution Park.

CCTV Surveillance System Diagram. CCTV Network Diagram Example

Creating CCTV system diagrams is quick and easy with ConceptDraw DIAGRAM diagramming software enhanced with Audio, Video, Media solution from ConceptDraw Solution Park. It contains library of vector cliparts of video and TV devices and different digital gadgets for drawing this kind of diagrams.