Project — Assigning Resources
Users new to ConceptDraw PROJECT will find the Basic lessons an essential platform for familiarizing themselves with the program′s functions. Learn how to assign resources to tasks in ConceptDraw PROJECT with this comprehensive video lesson.
"Project planning is part of project management, which relates to the use of schedules such as Gantt charts to plan and subsequently report progress within the project environment.
Initially, the project scope is defined and the appropriate methods for completing the project are determined. Following this step, the durations for the various tasks necessary to complete the work are listed and grouped into a work breakdown structure. Project planning is often used to organize different areas of a project, including project plans, work loads and the management of teams and individuals. The logical dependencies between tasks are defined using an activity network diagram that enables identification of the critical path. Float or slack time in the schedule can be calculated using project management software. Then the necessary resources can be estimated and costs for each activity can be allocated to each resource, giving the total project cost. At this stage, the project schedule may be optimized to achieve the appropriate balance between resource usage and project duration to comply with the project objectives. Once established and agreed, the project schedule becomes what is known as the baseline schedule. Progress will be measured against the baseline schedule throughout the life of the project. Analyzing progress compared to the baseline schedule is known as earned value management.
The inputs of the project planning phase include the project charter and the concept proposal. The outputs of the project planning phase include the project requirements, the project schedule, and the project management plan." [Project planning. Wikipedia]
The flow chart example "Project planning process" was created using the ConceptDraw PRO diagramming and vector drawing software extended with the Flowcharts solution from the area "What is a Diagram" of ConceptDraw Solution Park.
Collaboration in a Project Team
Create with our data flow diagram software perfect data flow diagrams. Download data flow diagram software for FREE. Use hundreds of data flow diagram examples.Sales Steps
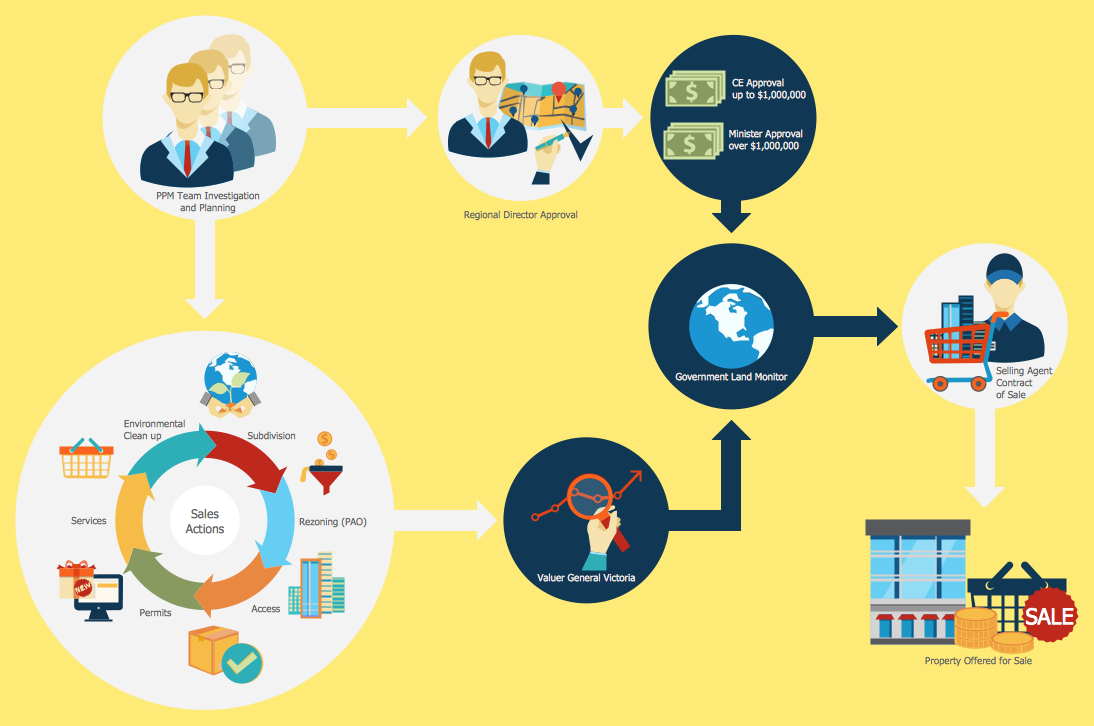
Helps to create professionally looking and detailed Sales Flowcharts with all sales steps visually represented on them. Use the Sales Flowcharts Solution for ConceptDraw PRO software to create your own Sales Flowcharts of any complexity quickly, easily and effectively to use them successfully in your work activity. ConceptDraw PRO diagramming and vector drawing software supplied with unique Sales Flowcharts solution from the Marketing area of ConceptDraw Solution Park allows fast and easy visualize all sales steps of the sales process on a sales process Map or sales process flowchart, and then realize them easily.DFD Flowchart Symbols
A Data Flow Diagram (DFD) is a graphical technique which allows effectively model and analyze the information processes and systems. The ability to fast and easy create the DFDs is made possible with Data Flow Diagrams solution from the Software Development area of ConceptDraw Solution Park. For designing the Data Flow Diagrams are used simple DFD flowchart symbols which are connected each other by arrows depicting the data flow from one step to another.Organization Chart
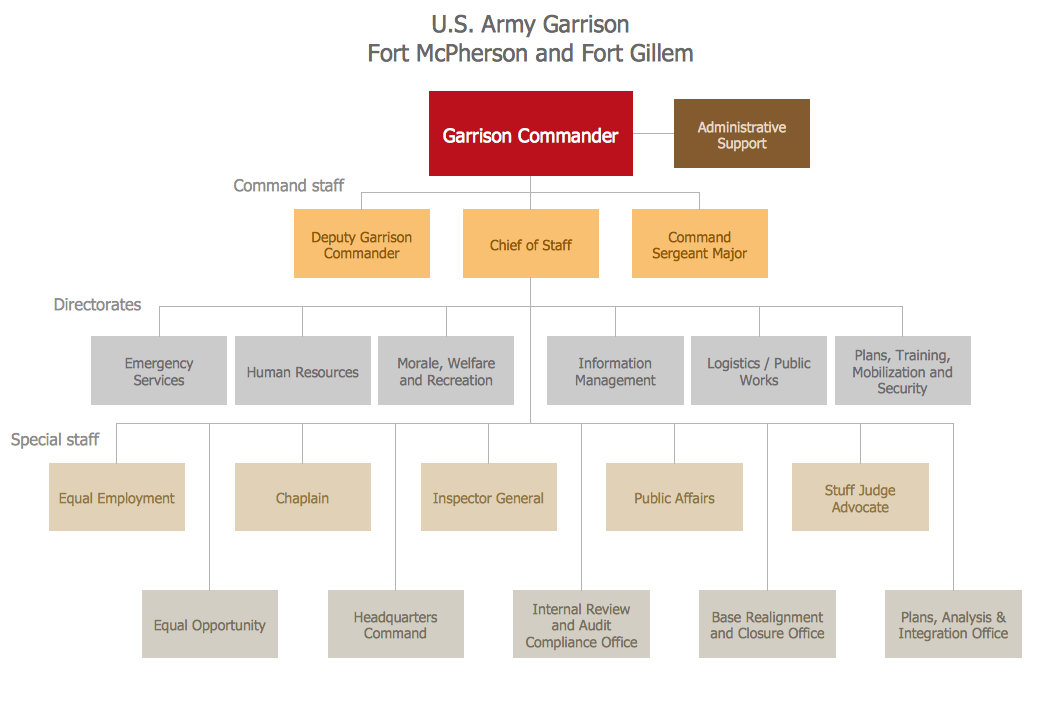
ConceptDraw PRO diagramming and vector drawing software extended with 25 Typical Orgcharts solution from the Management area of ConceptDraw Solution Park offers 25 ready Organization Chart templates, 10 samples and 2 libraries with predesigned vector objects.Business Process Modeling with ConceptDraw
Business Process Modeling Notation -BPMN- is a set of standard symbols that allow you to create a graphical view of a business process. The symbols were developed to help users develop standard, unified structure of processes, and any messages shared between these processes. This is essense of business process improvement tools.Business Process Management
ConceptDraw RapidDraw technology is a simple point-and-click design that helps create professional, presentation-ready business process diagrams quickly and efficiently.Dealing with Difficult People
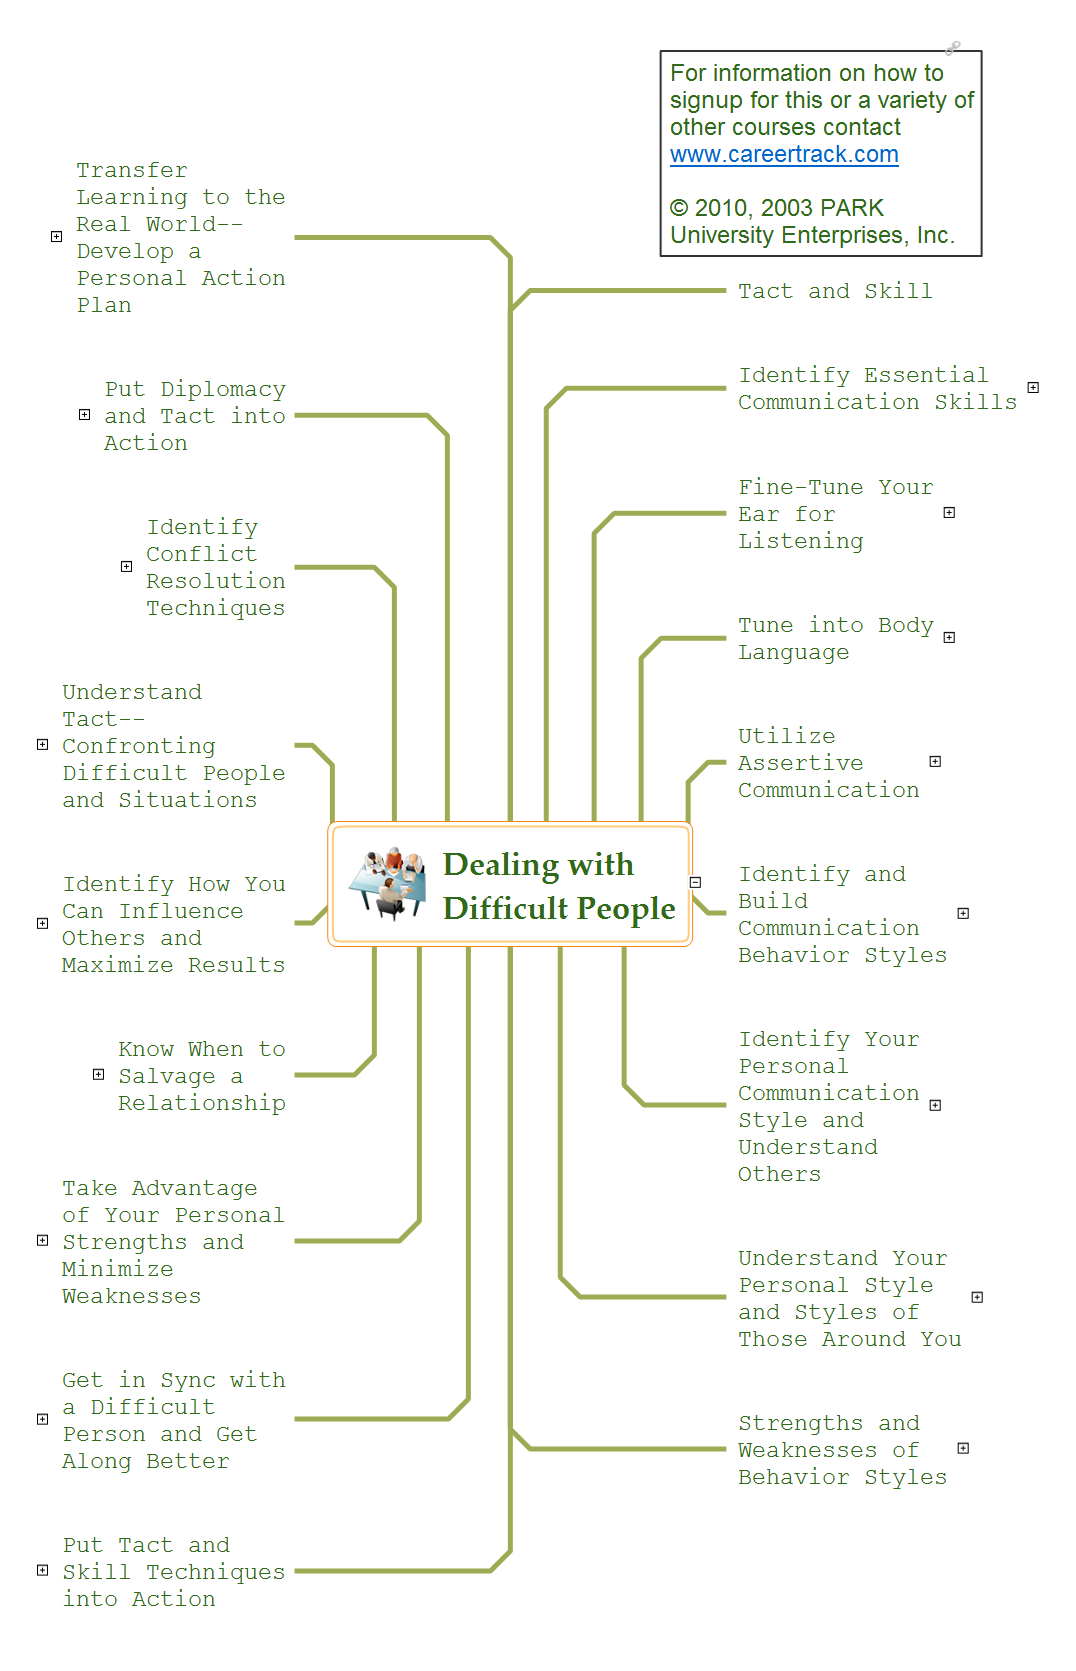
Every day we communicate with many people, but sometimes we meet the people with a complex character that do not go towards, in spite of all our efforts. There are about twelve types of people that are recognized as difficult. What we need to do when dealing with a difficult person? Anyway you must realize that you can not avoid the meeting with people, who consciously or unconsciously, will complicate your life. No matter where you are faced with a difficult person - at work, study, or in other occasions, it is needed try to find a compromise, you can use special approaches to dealing with difficult people. The key point in detecting the approach to difficult people is to realize that the person is difficult to communicate, to stay flexible and calm, retain neutrality, to apply to a specific person an individual approach, given its features, hidden needs and interests, and also your own priorities in this situation. Mind Map is a useful way to describe various approaches that you need to take when dealing with difficult people. Make it easy in ConceptDraw MINDMAP software.Software Work Flow Process in Project Management with Diagram
This sample was created in ConceptDraw PRO diagramming and vector drawing software using the Workflow Diagrams Solution from the Software Development area of ConceptDraw Solution Park.This sample shows the Workflow Diagram that clearly illustrates stages a BPM consists of and relations between all parts of business. The Workflow Diagrams are used to represent the transferring of data during the work process, to study and analysis the working processes, and to optimize a workflow.
 School and Training Plans
Planning a school and its campus layout needs to depict the premises, represent internal spaces, location of windows and direction of natural light. Detailed classroom seating chart helps you visualize location of the blackboard and desks, taking into account the specifics of the room and its lighting, with a goal to design the classroom to be comfortable for each pupil and teacher.
Program Structure Diagram
Program Structure Diagram - The Software Development solution from ConceptDraw Solution Park provides the stensils libraries of language level shapes and memory objects for drawing the structural diagrams of programs and memory objects using the ConceptDraw PRO diagramming and vector drawing software.
 Rapid UML
Rapid UML solution extends ConceptDraw PRO software with templates, samples and libraries of vector stencils for quick drawing the UML diagrams using Rapid Draw technology.
 Rapid UML
Rapid UML solution extends ConceptDraw PRO software with templates, samples and libraries of vector stencils for quick drawing the UML diagrams using Rapid Draw technology.
- How to Plan and Allocate Resources in Your Project with ...
- Project planning process - Flowchart | Audit Process Flowchart ...
- Project planning process - Flowchart | Audit planning flowchart ...
- Project planning process - Flowchart | Process Flowchart | TQM ...
- Project planning process - Flowchart | Auditing Process. Audit ...
- Flowchart Symbols Accounting. Activity-based costing (ABC ...
- Project planning process - Flowchart | Top 5 Android Flow Chart ...
- Project management life cycle - Flowchart | Sample Project ...
- Project planning process - Flowchart
- What Are Flow Chart Of Environment Resources Management
- Flowchart Symbols Accounting. Activity-based costing (ABC ...
- Contoh Flowchart | Project planning process - Flowchart | Technical ...
- Project planning process - Flowchart
- Types of Flowchart - Overview | Process Flowchart | HR ...
- Auditing Process. Audit Planning Process | Easy Flowchart Program ...
- Block diagram - Planning process | Auditing Process. Audit Planning ...
- Process Flowchart | Technical Flow Chart | Flowchart Definition ...
- How to Create Multiple Projects Schedule on OS X | How to Create ...
- Block diagram - Planning process | Project planning process ...


