HelpDesk
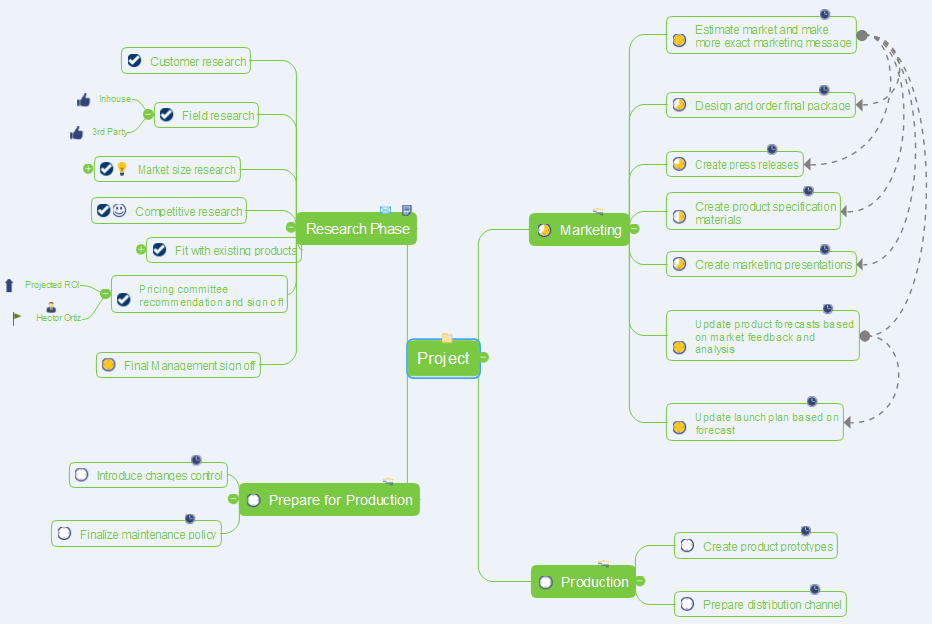
How to Make a Project Tasks Mind Map from Brainstorm
Start project with creating a mind map, structuring ideas captured during a brainstorming session.
HelpDesk
How to Draw a Fishbone Diagram with ConceptDraw PRO
Fishbone (Ishikawa) Diagram is often used in business to determine the cause of some problem. A Fishbone diagram is also called cause-and-effect diagram.The main goal of the Fishbone diagram is to illustrate in a graphical way the relationship between a given outcome and all the factors that influence this outcome. The complete diagram resembles a fish skeleton as its name implies. Cause and Effect analysis is used in management to identify the possible causes of a problem in order to eliminate them. The ability to create a Fishbone Diagram is supported by the Fishbone Diagram solution.
 Computer Network Diagrams
Computer Network Diagrams solution extends ConceptDraw PRO software with samples, templates and libraries of vector icons and objects of computer network devices and network components to help you create professional-looking Computer Network Diagrams, to plan simple home networks and complex computer network configurations for large buildings, to represent their schemes in a comprehensible graphical view, to document computer networks configurations, to depict the interactions between network's components, the used protocols and topologies, to represent physical and logical network structures, to compare visually different topologies and to depict their combinations, to represent in details the network structure with help of schemes, to study and analyze the network configurations, to communicate effectively to engineers, stakeholders and end-users, to track network working and troubleshoot, if necessary.
 Seating Plans
The correct and convenient arrangement of tables, chairs and other furniture in auditoriums, theaters, cinemas, banquet halls, restaurants, and many other premises and buildings which accommodate large quantity of people, has great value and in many cases requires drawing detailed plans. The Seating Plans Solution is specially developed for their easy construction.
 Plumbing and Piping Plans
Plumbing and Piping Plans solution extends ConceptDraw PRO v10.2.2 software with samples, templates and libraries of pipes, plumbing, and valves design elements for developing of water and plumbing systems, and for drawing Plumbing plan, Piping plan, PVC Pipe plan, PVC Pipe furniture plan, Plumbing layout plan, Plumbing floor plan, Half pipe plans, Pipe bender plans.
 Fault Tree Analysis Diagrams
This solution extends ConceptDraw PRO v9.5 or later with templates, fault tree analysis example, samples and a library of vector design elements for drawing FTA diagrams (or negative analytical trees), cause and effect diagrams and fault tree diagrams.
 Continent Maps
Continent Maps solution extends ConceptDraw PRO software with templates, samples and libraries of vector stencils for drawing the thematic maps of continents, state maps of USA and Australia.
 Value Stream Mapping
Value stream mapping solution extends ConceptDraw PRO software with templates, samples and vector stencils for drawing the Value Stream Maps (VSM) in lean manufacturing practice.
- Basic Flowchart Symbols and Meaning | How to Create a Timeline ...
- Basic Flowchart Symbols and Meaning | Process Flowchart | How to ...
- How to Create a Timeline Diagram in ConceptDraw PRO | How to ...
- Process Flowchart | How to Create a Timeline Diagram in ...
- Cross-Functional Flowchart | How to Create a Timeline Diagram in ...
- Flow Chart Online | Online Diagram Tool | How to Create a Timeline ...
- Examples of Flowcharts, Org Charts and More | How to Add a ...
- How To Create a Visio Circle-Spoke Diagram Using ConceptDraw ...
- Basic Flowchart Symbols and Meaning | How to Create Flowchart ...
- How to Create Flowchart Using Standard Flowchart Symbols | How ...
- How to Create the New Library in ConceptDraw PRO | How to ...
- Basic Flowchart Symbols and Meaning | Bubble Diagrams | How to ...
- Process Flowchart | Design elements - TQM diagram | How to ...
- How to Draw a Circular Arrows Diagram Using ConceptDraw PRO ...
- The Circular Flow Diagram | Circular Arrows Diagrams | Basic ...
- Flow Chart Online | Process Flowchart | How to Create a Social ...
- How to Add a Circle-spoke Diagram to a PowerPoint Presentation ...
- How to Create a Social Media DFD Flowchart | Sales Flowcharts ...
- Circular Flow Diagram Template
- Step Area Graph | US incarceration timeline -clean - Area graph ...

