Organic Chemistry Symbols
ConceptDraw DIAGRAM diagramming and vector drawing software extended with Chemistry solution from the Science and Education area of ConceptDraw Solution Park is effective for drawing various organic chemistry schemes, diagrams, illustrations thanks to the included collection of predesigned organic chemistry symbols.Software development with ConceptDraw DIAGRAM
Modern software development requires creation of large amount of graphic documentation, these are the diagrams describing the work of applications in various notations and cuts, also GUI design and documentation on project management. ConceptDraw DIAGRAM technical and business graphics application possesses powerful tools for software development and designing technical documentation for object-oriented projects. Solutions included to the Software Development area of ConceptDraw Solution Park provide the specialists with possibility easily and quickly create graphic documentation. They deliver effective help in drawing thanks to the included package of templates, samples, examples, and libraries with numerous ready-to-use vector objects that allow easily design class hierarchies, object hierarchies, visual object-oriented designs, flowcharts, GUI designs, database designs, visualize the data with use of the most popular notations, including the UML and Booch notations, easy manage the development projects, automate projection and development.UML State Machine Diagram.Design Elements
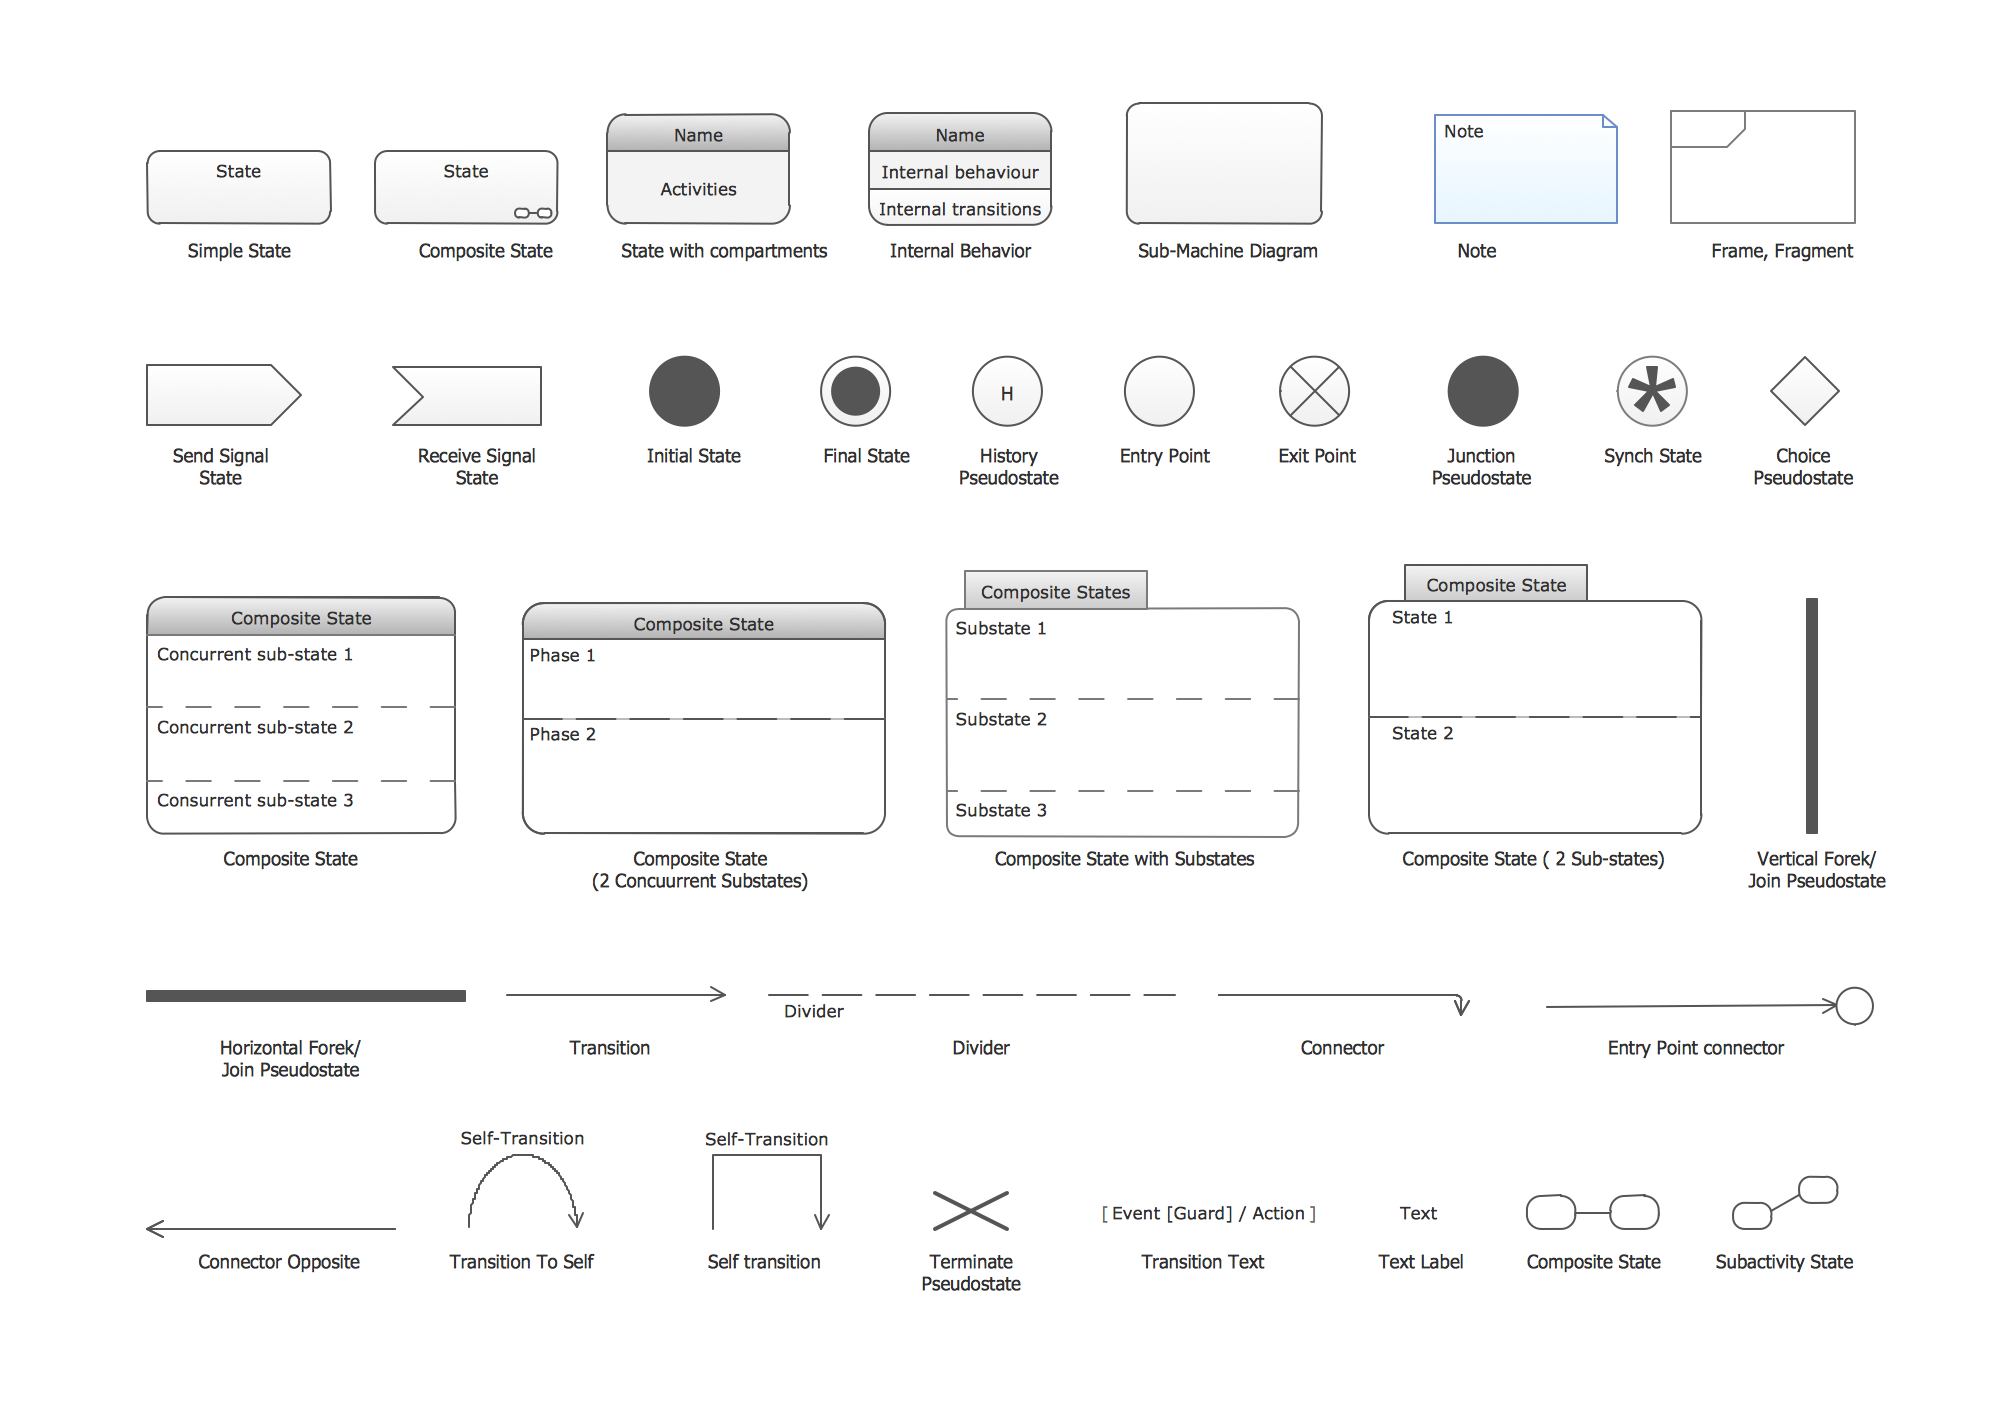
UML state machine's goal is to overcome the main limitations of traditional finite-state machines while retaining their main benefits. ConceptDraw has 393 vector stencils in the 13 libraries that helps you to start using software for designing your own UML Diagrams. You can use the appropriate stencils of UML notation from UML State Machine library.Design Pictorial Infographics. Design Infographics
In the course of recent decades data visualization went through significant development and has become an indispensable tool of journalism, business intelligence and science. The way visual information may be conveyed is not limited simply to static or dynamic representation, it can also be interactive. Infographics can be conditionally divided into several general levels. Primarily, this is level of visualization of information, its interpretation and association on any ground. Second level can be defined as a visualization of knowledge, depiction of thoughts and ideas in the form of images or diagrams. Finally, the level of data visualization, which processes data arrays in charts, enabling the information to be more clearly perceived. You can also identify the main approaches to the creation of infographics: exploratory and narrative. Exploratory method insists on minimalist design in favor of data precision without unnecessary details and is common for scientific researches and anaWork Process
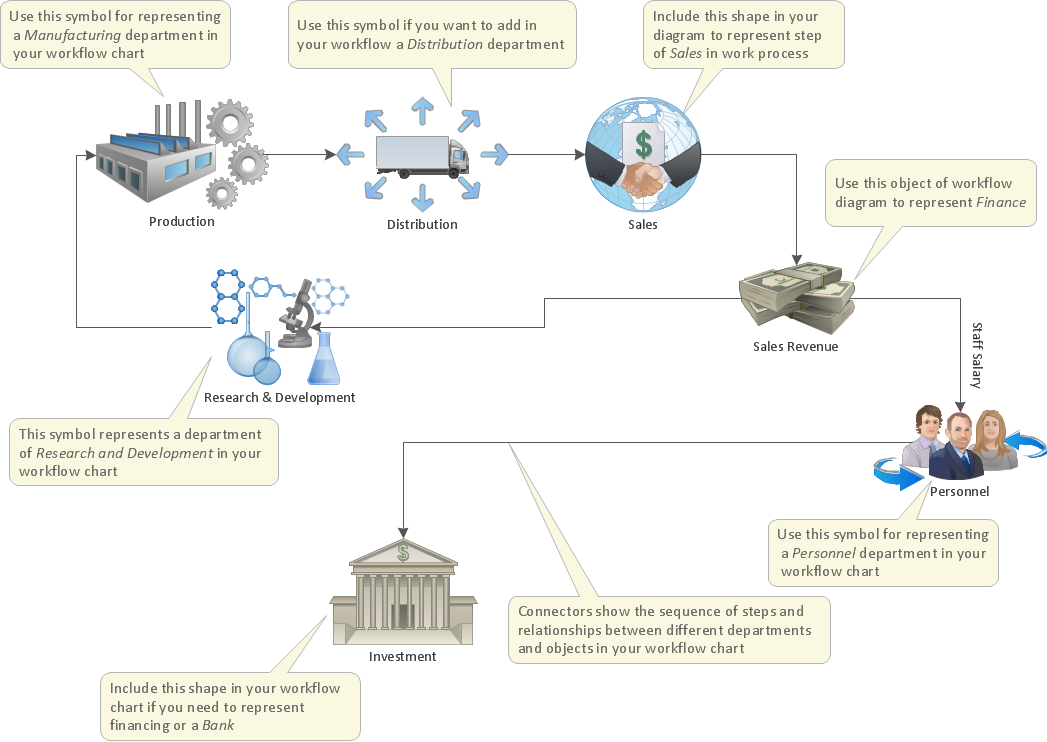
Any work process visualized as a workflow diagram becomes easier-to-analyse. To visualize work processes regularly we recommend to use ConceptDraw DIAGRAM software extended with the Workflow Diagrams solution. This software contains features and technologies designed to draw workflow diagrams faster.Use Case Diagrams technology with ConceptDraw DIAGRAM
Use case diagrams are used at the development of software and systems for definition of functional system requirements or system of systems. Use case diagram presents the consecution of object’s actions (user’s or system’s) which are executed for reaching the definite result.Business Diagram Software
When managing the projects, people, or networks, there are daily designed and used different types of Business diagrams, so the powerful drawing software will be very useful for this. ConceptDraw DIAGRAM with large quantity of business solutions will meet your needs and will help you convey your ideas successful and rapidly, no matter are you professional or beginner. It is the best choice for business specialists and technical professionals who need quickly and easily explore, visualize, and communicate information. ConceptDraw DIAGRAM business diagram software is the most powerful business software and relational charting software. Create advanced, completely customizable Business Process Diagrams, Business Flow Charts, Work Flow Diagrams, Organizational Charts, Audit diagrams, Marketing diagrams, Value Stream Maps, TQM diagrams, ERD diagrams, EPC diagrams, Cause and Effect diagrams, Infographics, Dashboards, and other Relational business diagrams from your data using the powerful drawing tools of ConceptDraw Solution Park.
- Class Diagram For Home Automation System
- UML Class Diagram Example - Apartment Plan | Workflow Diagram ...
- Class Diagram For Parking Management System
- UML Class Diagram Generalization Example UML Diagrams | UML ...
- UML Diagram
- Vehicle Parking System Class Diagram
- UML Class Diagram Example for Transport System
- Car Parking System Class Diagram
- UML Class Diagram Example - Medical Shop | UML Class Diagrams ...
- UML Activity Diagram | UML Sample Project | UML Class Diagrams ...
- UML Class Diagram Generalization Example UML Diagrams | UML ...
- UML Use Case Diagram Example Social Networking Sites Project ...
- Use Case Diagram For Parking System
- UML Use Case Diagram Example Social Networking Sites Project ...
- UML Deployment Diagram Example - ATM System UML diagrams ...
- UML Class Diagram Example - Social Networking Site | UML Use ...
- UML Use Case Diagram Example Registration System | UML ...
- UML Component Diagram Example - Online Shopping | UML Class ...
- UML Class Diagram Example - Social Networking Site | UML Use ...
- How to create a UML Diagram | UML class diagram - Metadata ...


