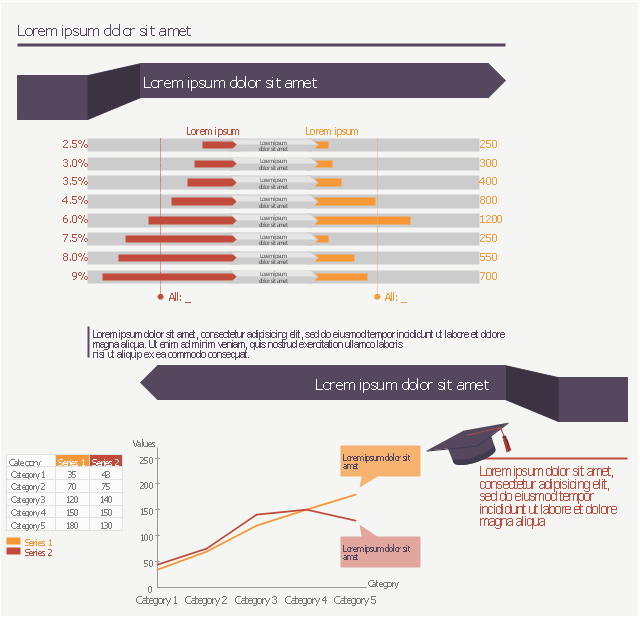
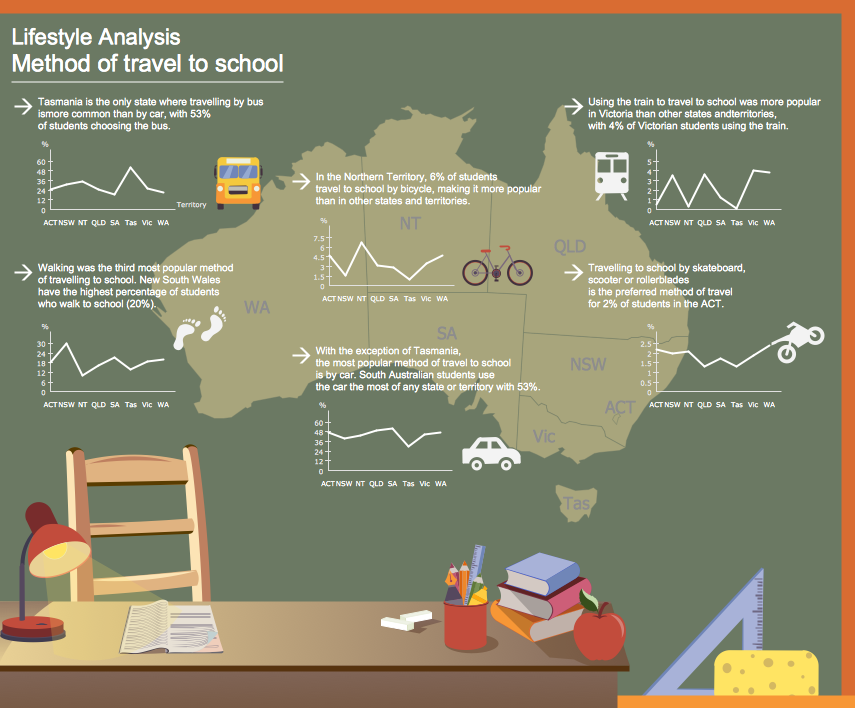
This education infographic template consists of design elements: callouts, bullet indicators, line chart, graduate cap pictogram.
Simply add text and data to design your educational infogram.
The template "Education infogram" for the ConceptDraw PRO diagramming and vector drawing software is included in the Education Infographics solition from the area "Business Infographics" in ConceptDraw Solution Park.
Simply add text and data to design your educational infogram.
The template "Education infogram" for the ConceptDraw PRO diagramming and vector drawing software is included in the Education Infographics solition from the area "Business Infographics" in ConceptDraw Solution Park.
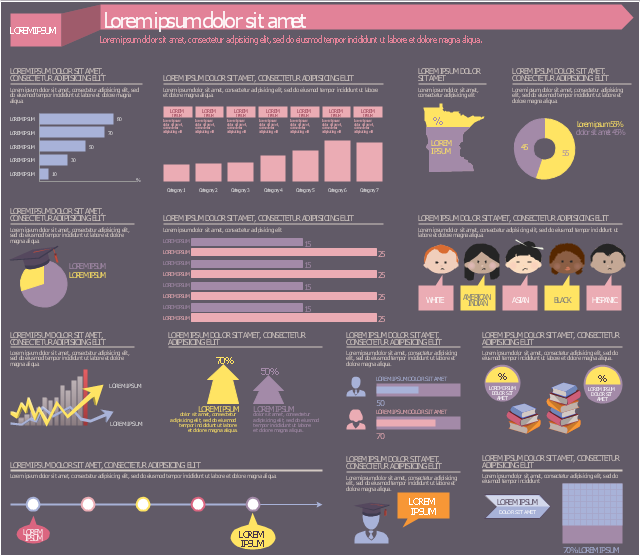
This education infographic template consists of design elements: callouts, horizontal bar chart, column chart (vertical bar graph), state map contour, donut chart indicator, pie chart indicator, horizontal bar chart indicators, arrow chart indicator, bullet indicators, square chart 10x10 indicator, pictograms.
Simply add text to design your own educational infogram.
The template "Education infogram 5" for the ConceptDraw PRO diagramming and vector drawing software is included in the Education Infographics solition from the area "Business Infographics" in ConceptDraw Solution Park.
Simply add text to design your own educational infogram.
The template "Education infogram 5" for the ConceptDraw PRO diagramming and vector drawing software is included in the Education Infographics solition from the area "Business Infographics" in ConceptDraw Solution Park.
Used Solutions
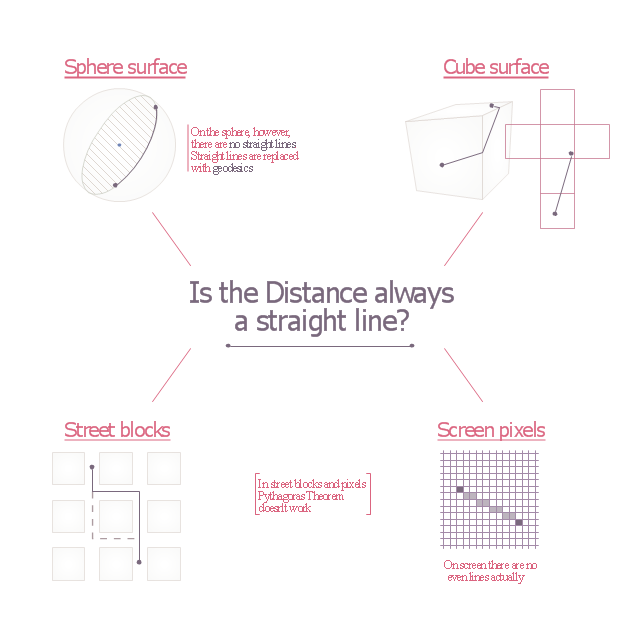
"Distance, or farness, is a numerical description of how far apart objects are. In physics or everyday usage, distance may refer to a physical length, or an estimation based on other criteria (e.g. "two counties over"). In mathematics, a distance function or metric is a generalization of the concept of physical distance. A metric is a function that behaves according to a specific set of rules, and is a concrete way of describing what it means for elements of some space to be "close to" or "far away from" each other. In most cases, "distance from A to B" is interchangeable with "distance between B and A"." [Distance. Wikipedia]
The educational infogram "Distance" was created using the ConceptDraw PRO diagramming and vector drawing software extended with the Education Infographics solition from the area "Business Infographics" in ConceptDraw Solution Park.
The educational infogram "Distance" was created using the ConceptDraw PRO diagramming and vector drawing software extended with the Education Infographics solition from the area "Business Infographics" in ConceptDraw Solution Park.
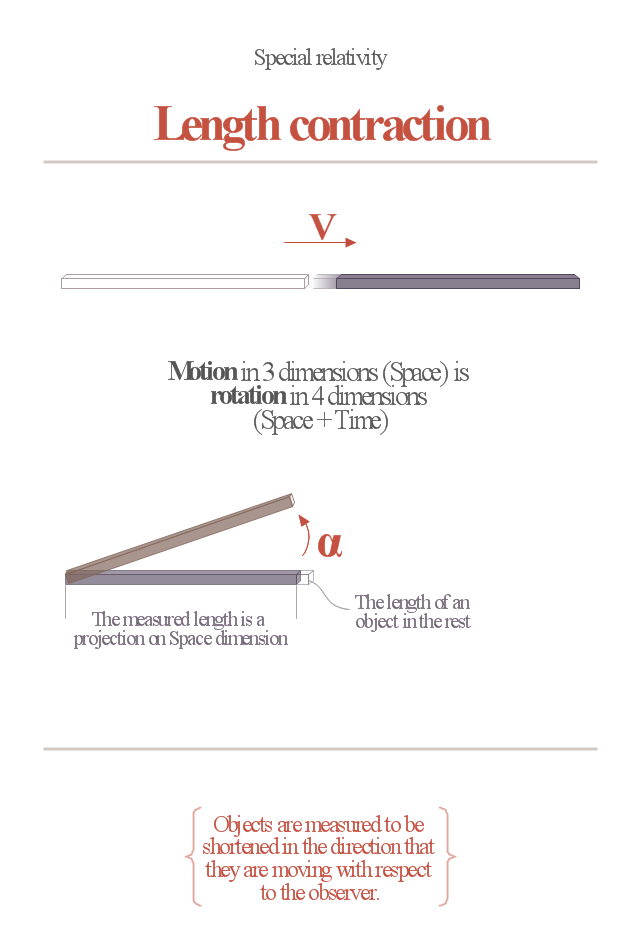
"In physics, length contraction is the phenomenon of a decrease in length measured by the observer of an object which is traveling at any non-zero velocity relative to the observer. This contraction (more formally called Lorentz contraction or Lorentz-FitzGerald contraction after Hendrik Lorentz and George FitzGerald) is usually only noticeable at a substantial fraction of the speed of light. Length contraction is only in the direction parallel to the direction in which the observed body is travelling. This effect is negligible at everyday speeds, and can be ignored for all regular purposes. Only at greater speeds does it become relevant." [Length contraction. Wikipedia]
The educational infogram "Length contraction" was created using the ConceptDraw PRO diagramming and vector drawing software extended with the Education Infographics solition from the area "Business Infographics" in ConceptDraw Solution Park.
The educational infogram "Length contraction" was created using the ConceptDraw PRO diagramming and vector drawing software extended with the Education Infographics solition from the area "Business Infographics" in ConceptDraw Solution Park.
How to Make an Infographic
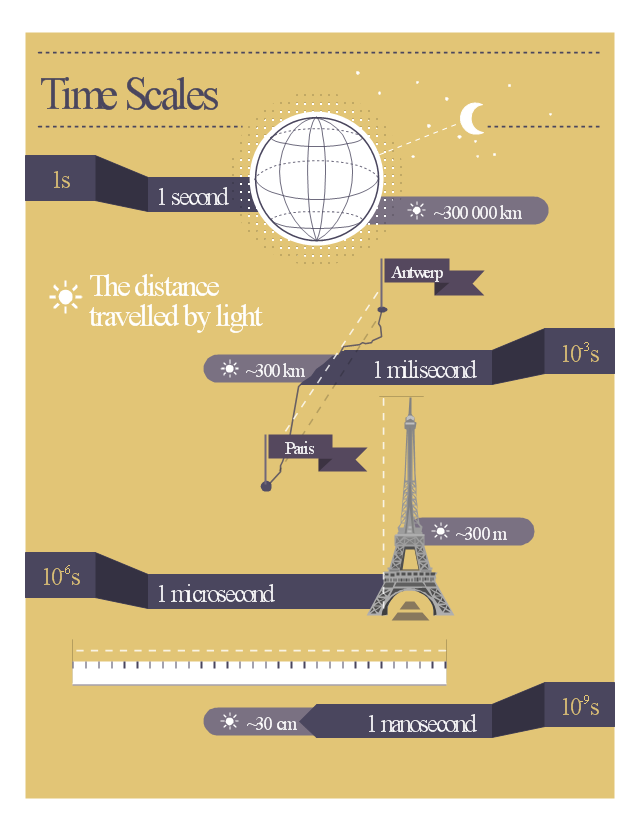
How to Make an Infographic quick and easy? The perfect way is to use the ConceptDraw PRO diagramming and vector drawing software extended with Education Infographics Solution from the Business Infographics Area."Light-travel distance.
This distance is the time (in years) that it took light to reach the observer from the object multiplied by the speed of light. For instance, the radius of the observable Universe in this distance measure becomes the age of the Universe multiplied by the speed of light (1 light year/ year) i.e. 13.8 billion light years. Also see misconceptions about the size of the visible universe." [Distance measures (cosmology). Wikipedia]
The educational infogram "Time scales" was created using the ConceptDraw PRO diagramming and vector drawing software extended with the Education Infographics solition from the area "Business Infographics" in ConceptDraw Solution Park.
Make an Infographic
You want to make an infographic and need the useful and convenient drawing tools for this? In this case the ConceptDraw PRO software extended with Education Infographics Solution is a real godsend for you.Educational Technology Tools
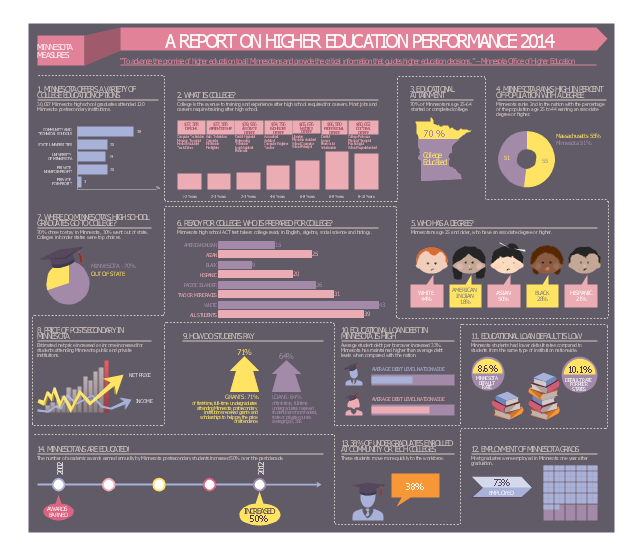
What are the favorite educational technology tools and techniques for teachers? Of course these are pictures, images and education infographics! ConceptDraw PRO software supplied with Education Infographics Solution from the Business Infographics Area provides powerful drawing tools to help design the education infographics of any complexity.This example was designed on the base of infographic "Minnesota measures 2014. A report on higher education performance" from the website of the Minnesota Office of Higher Education (OHE).
"The Minnesota Office of Higher Education is a cabinet-level state agency providing students with financial aid programs and information to help them gain access to postsecondary education. The agency also serves as the state’s clearinghouse for data, research and analysis on postsecondary enrollment, financial aid finance and trends." [ohe.state.mn.us/ pdf/ MN_ MeasuresInfographic.pdf]
The infographic example "Minnesota measures" was created using the ConceptDraw PRO diagramming and vector drawing software extended with the Education Infographics solition from the area "Business Infographics" in ConceptDraw Solution Park.
Used Solutions
Maps
>
Educational Materials
It is impossible to imagine the education process without educational materials and auxiliary illustrations. And it is important that they will be bright, interesting and attractive for the pupils and students. ConceptDraw PRO diagramming and vector drawing software offers the Education Infographics Solution from the Business Infographics Area to help each education-related person create professional looking and attractive educational materials.Education Infographics
The Education Infographics are popular and effectively applied in the educational process. Now you don't need to be an artist to design colorful pictorial education infographics thanks to the unique drawing tools of Education Infographics Solution for ConceptDraw PRO diagramming and vector drawing software.Education Information
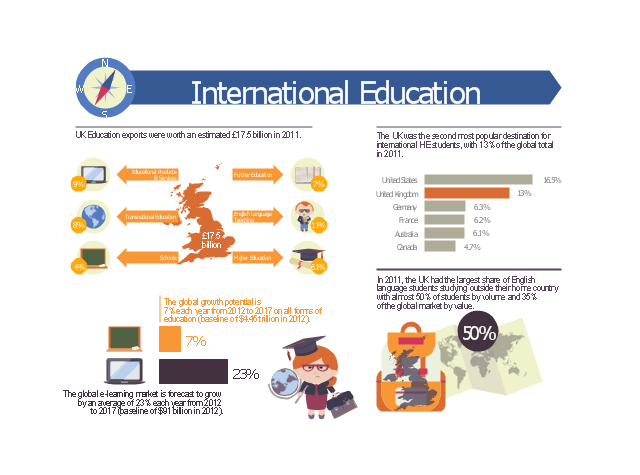
The Education Information is multifariuos and can be often represented in various forms. Еру the most successful ways of presentation the information and data are various illustrations, diagrams and colorful education infographics which you can easily make in ConceptDraw PRO software extended with Education Infographics Solution from the Business Infographics Area.This example was designed on the base of infographic "International education" from the Great Britain Government website.
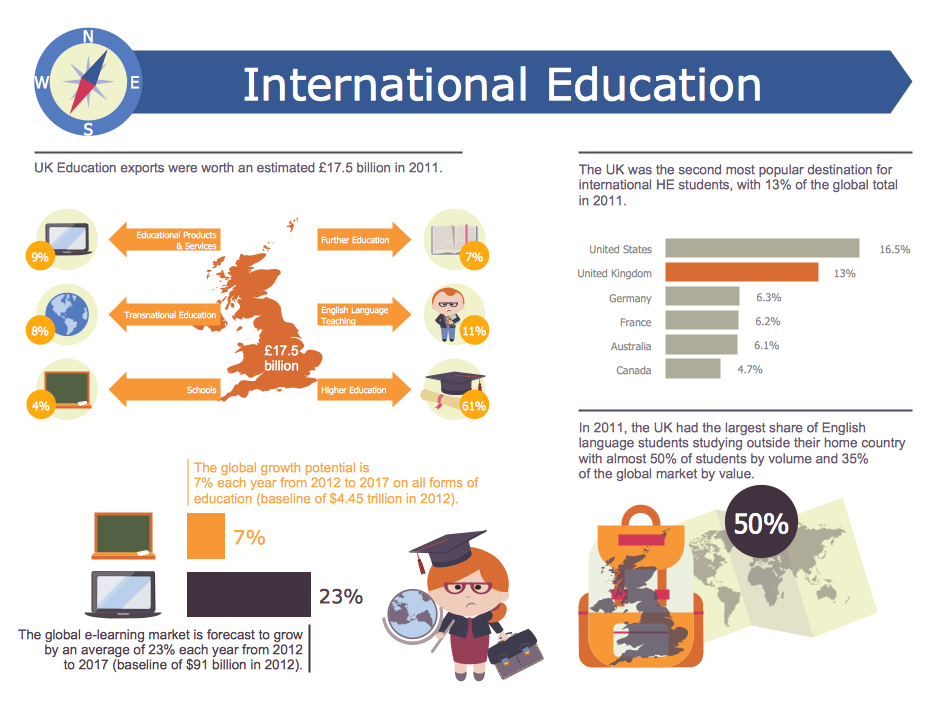
"UK Education exports were worth an estimated £17.5 billion in 2011.
The UK was the second most popular destination for international HE students, with 13% of the global total in 2011.
The global growth potential is 7% each year from 2012 to 2017 on all forms of education (baseline of $4.45 trillion in 2012).
In 2011, the UK had the largest share of English language students studying outside their home country with almost 50% of students by volume and 35% of the global market by value.
The global e-learning market is forecast to grow by an average of 23% each year from 2012 to 2017 (baseline of $91 billion in 2012)." [gov.uk/ government/ uploads/ system/ uploads/ attachment_ data/ file/ 225562/ international-education-industrial-strategy-infographics.pdf]
The educational infogram "International education" was created using the ConceptDraw PRO diagramming and vector drawing software extended with the Education Infographics solition from the area "Business Infographics" in ConceptDraw Solution Park.
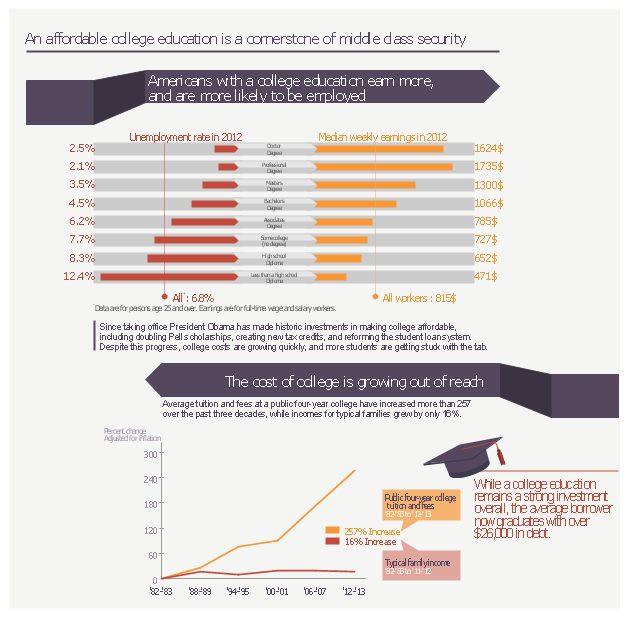
This example was designed on the base of infographic "An affordable college education is a cornerstone of middle class security" from the White House website.
"Since taking office President Obama has made historic investments in making college affordable, including double Pell scholarships, creating new tax credits, and reforming the student low system. Despite this progress, college costs are growing quickly, and more students are getting stuck with the tab." [whitehouse.gov/ share/ college-affordability]
The educational infogram "An affordable college education is a cornerstone of middle class security" was created using the ConceptDraw PRO diagramming and vector drawing software extended with the Education Infographics solition from the area "Business Infographics" in ConceptDraw Solution Park.
- Education charts - Vector stencils library | Education infogram 5 ...
- Minnesota measures - Infogram | Education infogram 5 - Template ...
- Distance - Education infogram
- Design elements - Education charts | Education infogram 4 ...
- How to Create Education Infographics | Education infogram 4 ...
- Length contraction - Education infogram
- Quick YouTube Survey | Education infogram 5 - Template ...
- Design elements - Education charts | Education infogram 5 ...
- Education infogram 4 - Template | Education pictograms - Vector ...
- Length contraction - Education infogram | Education Information ...
- Infographic Example In Education
- Time scales - Education infogram
- International education | Minnesota measures - Infogram | Basic ...
- Education Infographics | Make an Infographic | Educational ...
- Education pictograms - Vector stencils library | Education infogram ...
- Design elements - Education backgrounds | Design elements ...
- Ribbon interface - Vector stencils library | Time scales - Education ...
- How to Create a Typography Infographic Using ConceptDraw PRO ...
- Minnesota measures - Infogram | How to Draw Pictorial Chart. How ...
- Education charts - Vector stencils library | How to Draw the Different ...
