Process Flowchart
The main reason of using Process Flowchart or PFD is to show relations between major parts of the system. Process Flowcharts are used in process engineering and chemical industry where there is a requirement of depicting relationships between major components only and not include minor parts. Process Flowcharts for single unit or multiple units differ in their structure and implementation. ConceptDraw PRO is Professional business process mapping software for making Process flowcharts, Process flow diagram, Workflow diagram, flowcharts and technical illustrations for business documents and also comprehensive visio for mac application. Easier define and document basic work and data flows, financial, production and quality management processes to increase efficiency of your business with ConcepDraw PRO. Business process mapping software with Flowchart Maker ConceptDraw PRO includes extensive drawing tools, rich examples and templates, process flowchart symbols and shape libraries, smart connectors that allow you create the flowcharts of complex processes, process flow diagrams, procedures and information exchange. Process Flowchart Solution is project management workflow tools which is part ConceptDraw Project marketing project management software. Drawing charts, diagrams, and network layouts has long been the monopoly of Microsoft Visio, making Mac users to struggle when needing such visio alternative like visio for mac, it requires only to view features, make a minor edit to, or print a diagram or chart. Thankfully to MS Visio alternative like ConceptDraw PRO software, this is cross-platform charting and business process management tool, now visio alternative for making sort of visio diagram is not a problem anymore however many people still name it business process visio tools.
Value Stream Mapping Symbols
VSM symbols are the best for a production process designing. The entire Value Stream Mapping method uses a graphical representation of the manufacturing process, factors' pros and cons, that all stakeholders can easily understand. Value Stream Mapping is a graphical technique that provides possibilities to improve analysis of a manufacturing process, at the stage of the transferring information or materials that required to deliver a product or service to the customer.HelpDesk
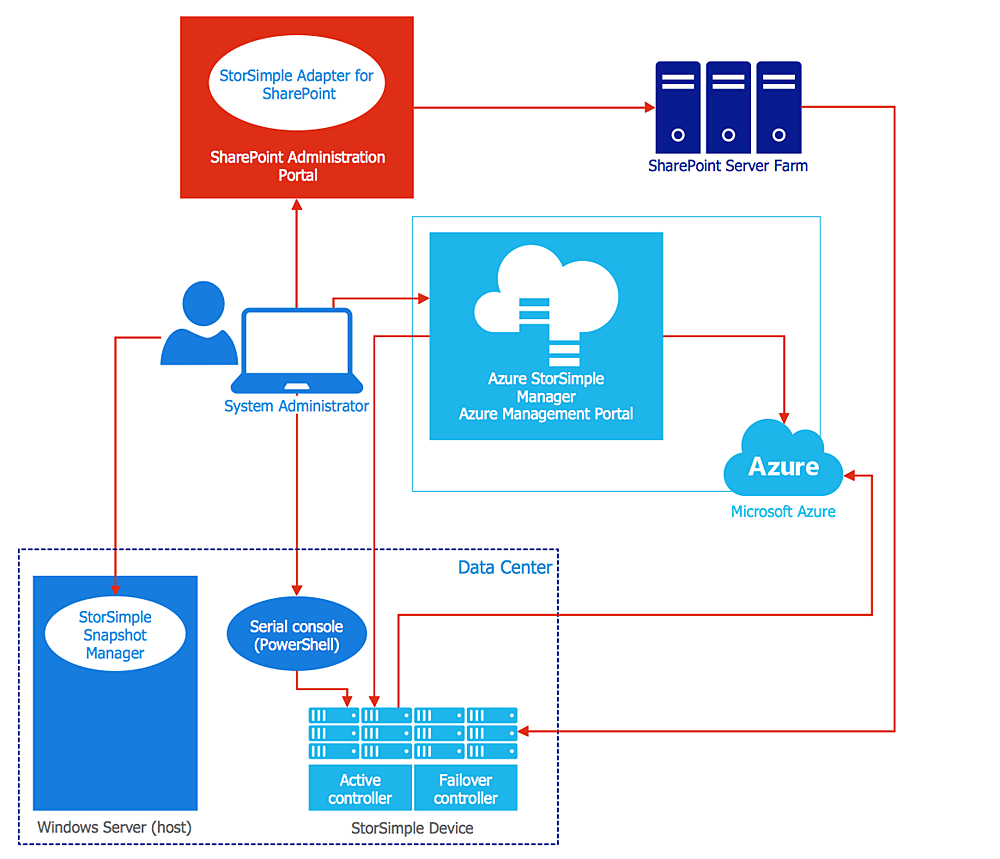
How to Create an Azure Architecture Diagram Using ConceptDraw PRO
Microsoft Azure is an open cloud computing platform, designed by Microsoft. It provides the ability to develop and launch applications and to store data on servers in distributed data centers. Microsoft Azure cloud offers two models - platform as a service (PaaS) and infrastructure as a service (IaaS). The efficiency of the Windows Azure platform is supported by a global network of Microsoft data centers. Developers use Azure Architecture diagrams to visualize and document the architecture of applications bases on Microsoft Azure services. Using the ConceptDraw Azure Architecture solution makes much easier the work on documenting the Microsoft Azure architecture.Competitor Analysis
Competitor analysis is a first and obligatory step in elaboration the proper corporate marketing strategy and creating sustainable competitive advantage. Use powerful opportunities of numerous solutions from ConceptDraw Solution Park for designing illustrative diagrams, charts, matrices which are necessary for effective competitor analysis.Symboles Organigramme
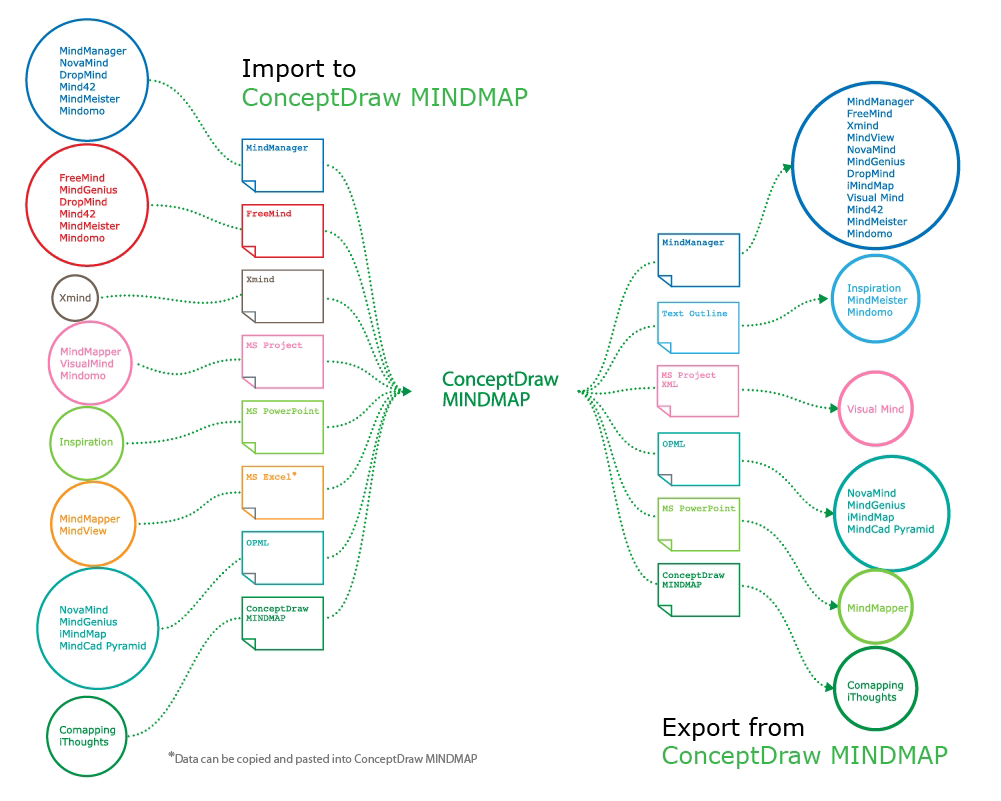
Les organigrammes sont parfaits pour représenter visuellement des processus operationnels. Par exemple, si vous avez besoin d'afficher le flux d'un processus d'ordre personnalisé par l'entremise de divers opérateurs au sein de votre organisation, vous pouvez utiliser un organigramme. Voir aussi d'autres symboles organigramme: Symboles ordinogramme standard, symboles du flux de travail, Vérification Les symboles du schéma fonctionnel, sOrganigramme comptables des symboles, Organigramme de vente des symboles, Symboles pour organigramme des RH, Carte des symboles de processus, Diagramme de processus opérationnels, Symboles utilisés dans le schéma IDEF0.How to Exchange ConceptDraw MINDMAP Files with Mindjet MindManager
ConceptDraw MINDMAP has impressive import and export capabilities includes following formats: OPML Mindjet™ MindManager™ Microsoft™ Office products: PowerPoint™ Project™ Word™ FreeMind (import only) XMind (import only)
SWOT Matrix Template
SWOT analysis is a structured planning method, which lets define the objective of the business, internal and external factors favorable or unfavorable for achieving this objective, represent Strengths, Weaknesses, Opportunities, and Threats on the SWOT Matrix. SWOT analysis can be conducted for an industry, company, product, place, or person. It lets to choose the best path for development of an organization, helps to avoid dangers, gives opportunity to establish relationship between the potential of an organization and the problems, lets to assess the values of profitability and compare them with performance of competitors, gives the possibility to expand and enhance the competitive advantages. SWOT and TOWS Matrix Diagrams solution included to ConceptDraw Solution Park contains wide variety of SWOT and TOWS matrix diagrams examples and samples, and also specially developed templates. Each SWOT template have great value in easy and quick drawing of SWOT matrices and diagrams in ConceptDraw PRO diagramming and vector drawing software for Mac OSX and Windows.- Organogram Template In Excel
- Flow Chart Excel
- Parking Lot Diagram Excel Template
- Excel Symbol For Process Flow Chart Quality
- Cross Functional Flowchart Template Excel
- Excel Supply Chain Template
- Excel Accounting Flow Diagram Template
- Excel Org Chart Templates
- Fault Tree Analysis Excel Template
- Activity Relationship Chart Excel
- Value Chain Template Excel
- Comparison Chart Template Excel
- Organogram Template Excel
- Matrix Org Structure Excel
- Create Hierarchy Tree From Excel
- Product Comparison Template Excel
- Process Map Template Excel
- Flow Chart Maker Android Excel
- Flowchart Software | Process Flowchart | Line Chart Template for ...


