Data structure diagram with ConceptDraw DIAGRAM
Data structure diagram (DSD) is intended for description of conceptual models of data (concepts and connections between them) in the graphic format for more obviousness. Data structure diagram includes entities description, connections between them and obligatory conditions and requirements which connect them. Create Data structure diagram with ConceptDraw DIAGRAM.IDEF0 standard with ConceptDraw DIAGRAM
The activity of any organization is more or less branchy network of processes. The description of these processes is a hard technical task which requires definite methodology and standards. According to the IDEF0 standard any process can be described in the form of a block (Activity Box) which has inputs and outputs. The process consists in transformation of inputs into outputs under the influence of the management and in the presence of necessary resources. Outputs of the given process later on can be either inputs for the next process or resources, or management means.Diagramme Zeichnen
No need for any special drawing skills to create professional looking diagrams outside of your knowledge base. ConceptDraw DIAGRAM takes care of the technical details, allowing you to focus on your job, not the drawing.Amazon Web Services
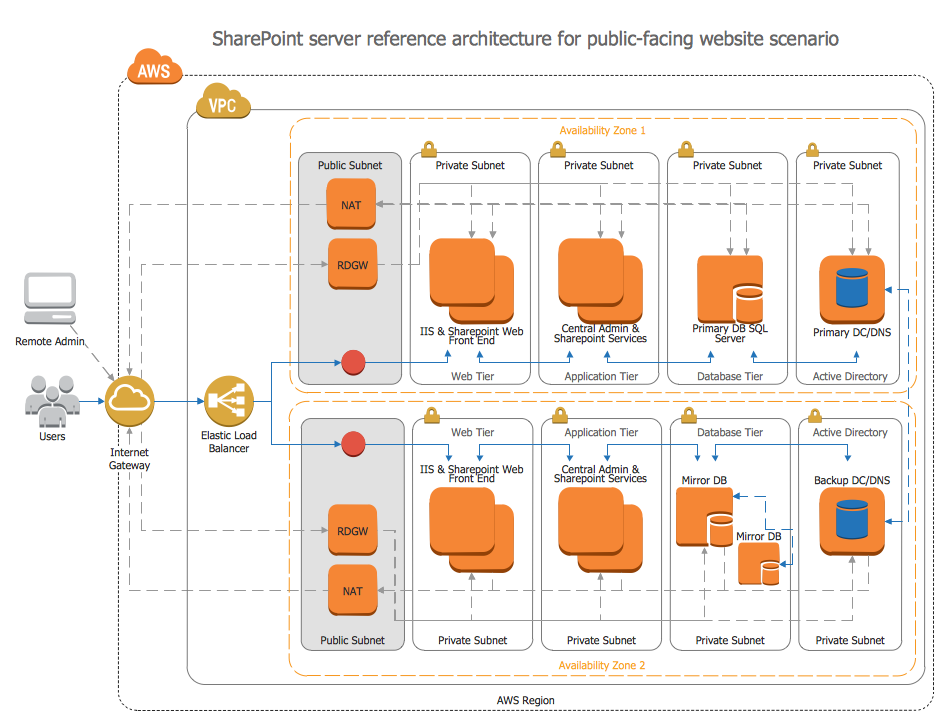
ConceptDraw DIAGRAM is a powerful diagramming and vector drawing software. Extended with AWS Architecture Diagrams Solution from the Computer and Networks Area, ConceptDraw DIAGRAM now is ideal software for Amazon Web Services diagrams drawing.Export from ConceptDraw DIAGRAM Document to MS Visio® XML
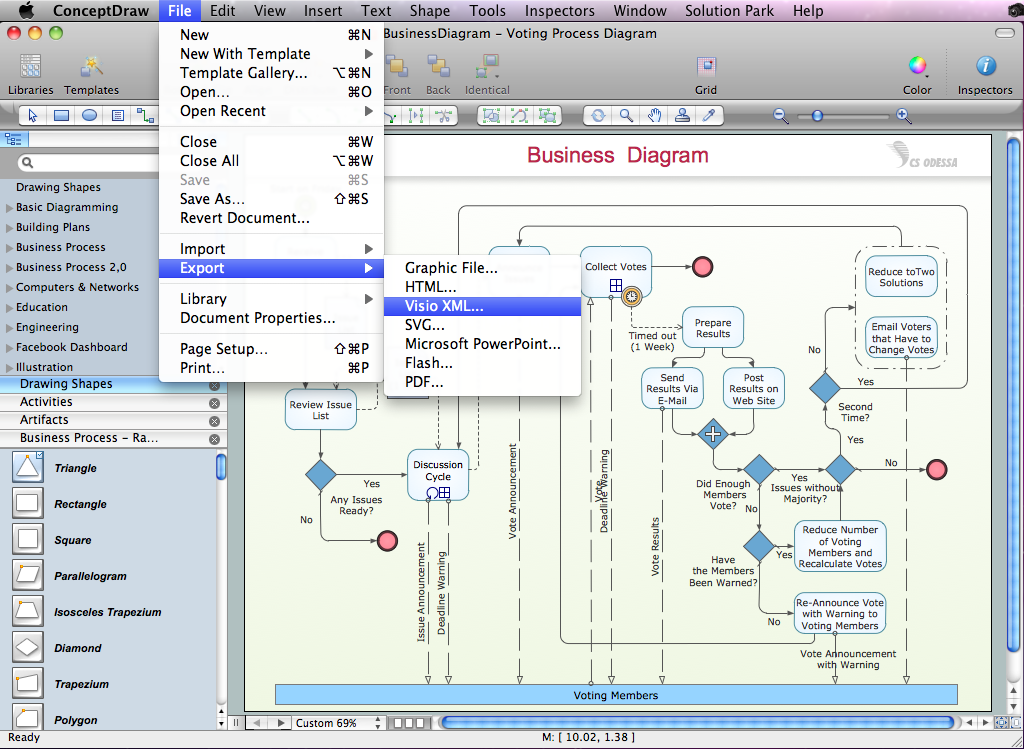
Once you have created your document in ConceptDraw DIAGRAM and you want to share it with your colleagues and friends, who uses MS Visio on their computers, you can easily export your document using ConceptDraw DIAGRAM export to Visio XML files (VDX) feature. Now you can share your ConceptDraw documents with MS Visio users.
Multiprotocol Label Switching (MPLS). Computer and Network Examples
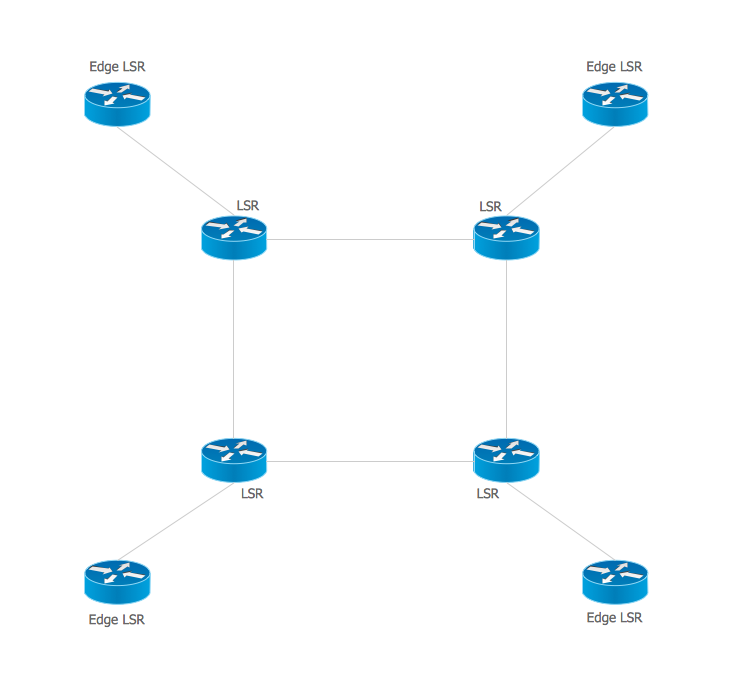
Multiprotocol Label Switching (MPLS) is a mechanism in high-performance telecommunication networks that implements the data transfer from one network node to another using the labels. ConceptDraw DIAGRAM is a powerful network diagramming and vector drawing software that provides the Computer and Networks solution with wide set of ready-to-use predesigned vector stencils and examples to help you design the MPLS Networks quick and easy.
Use Case Diagrams technology with ConceptDraw DIAGRAM
Use case diagrams are used at the development of software and systems for definition of functional system requirements or system of systems. Use case diagram presents the consecution of object’s actions (user’s or system’s) which are executed for reaching the definite result.Modern Garden Design
The modern garden design is a full complex of works for design, decorating and gardening. Landscape design offers a large number of styles for the modern garden design, their origins go back centuries. But do not forget that the modern garden design is first of all an individual project for a specific landscape and specific owner of the land, and sometimes it is appropriate to apply the combination of styles. ConceptDraw DIAGRAM diagramming and vector drawing software offers the unique Landscape & Garden Solution from the Building Plans area for effective development the modern garden design.Network Visualization with ConceptDraw DIAGRAM
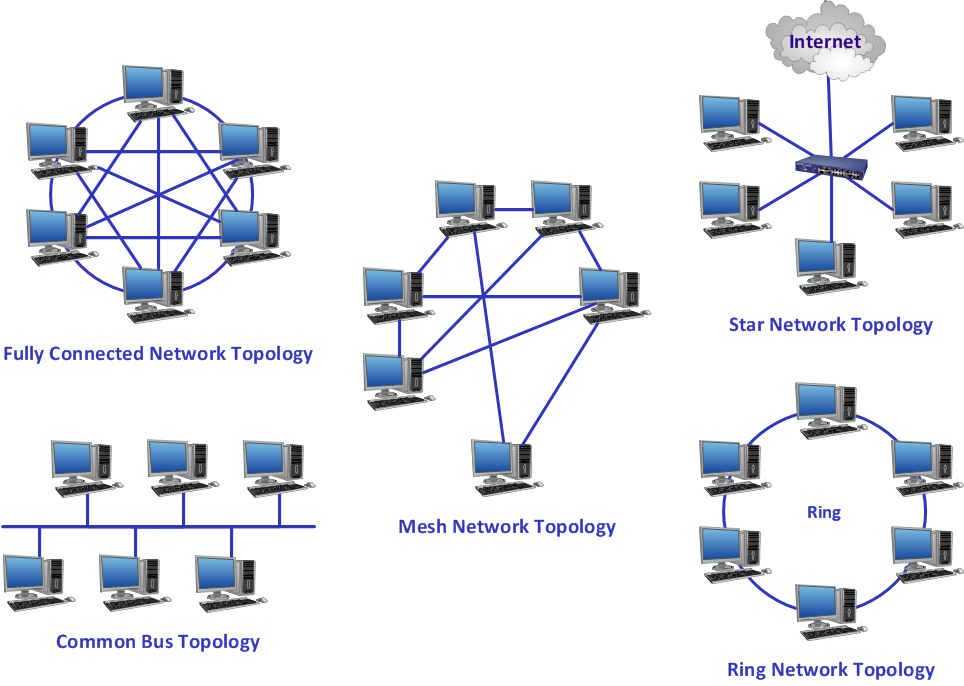
ConceptDraw makes the entire process of network visualization easier thanks to the numerous ready-to-use objects included in the package for presentation of network equipment, LDAP directory symbols and many other objects that symbolize resources in most various representations.Pyramid Diagram and Pyramid Chart
Pyramid Diagram, Triangle Chart or Triangular Diagram is a convenient and useful type of diagrams, which lets represent the data hierarchical structure and to illustrate the foundation-based relationships between the hierarchy levels. Pyramid Diagrams are used to visualize effectively the hierarchical, as well as proportional and foundation-based relationships, the process steps, the interconnections of organizational layers or topics. ConceptDraw DIAGRAM software enhanced with Pyramid Diagrams solution from Marketing area of ConceptDraw Solution Park is a powerful business charting software, that includes all required tools for designing the multilevel Pyramid Diagrams as quickly as possible. The build-in vector stencils and templates are the great aid for designers, a variety of examples and samples is a good base and source of inspiration. Use attractive and vivid 2D and 3D Pyramid Diagrams and Triangle Charts designed in ConceptDraw DIAGRAM to illustrate your documents, presentations, infographics, articles, reports, websites, etc.Control and Information Architecture Diagrams (CIAD) with ConceptDraw DIAGRAM
One of the three main constituents of any enterprise is the Control and Information Architecture. The rest two are Production facilities and People and Organization.Target Diagram
Target Diagram is a convenient and visual way of presentation information which is popular and widely used in marketing, business and economics. ConceptDraw DIAGRAM diagramming and vector drawing software extended with Target and Circular Diagrams solution from the Marketing area of ConceptDraw Solution Park is ideal for fast and easy drawing a Target Diagram.Total Quality Management with ConceptDraw
Total Quality Management (TQM) system is the management method where the confidence in quality of all organization processes is placed foremost. The given method is widely used in production, in educational system, in government organizations and so on.Best Diagramming
Need to draw a diagram, process chart, flowchart, organizational chart, graphic design? ConceptDraw can help you to make professional graphic documents quickly.
- ERD Symbols and Meanings | ERD , Chen's notation - Vector ...
- Entity Relationship Diagram Symbols | ERD Symbols and Meanings ...
- Basic Flowchart Symbols and Meaning | ERD Symbols and ...
- ERD Symbols and Meanings | Basic Flowchart Symbols and ...
- Basic Flowchart Symbols and Meaning | Process Flowchart | ERD ...
- ERD Symbols and Meanings | Entity Relationship Diagram Symbols ...
- ERD Symbols and Meanings | Design elements - ER diagram (Chen ...
- Basic Flowchart Symbols and Meaning | Entity Relationship ...
- Basic Audit Flowchart. Flowchart Examples | ERD Symbols and ...
- ERD Symbols and Meanings | How To Draw Building Plans ...
- ERD Symbols and Meanings | ConceptDraw PRO ER Diagram Tool ...
- How To use House Electrical Plan Software | ERD Symbols and ...
- Process Flowchart | Entity Relationship Diagram Symbols | Basic ...
- Basic Flowchart Symbols and Meaning | ConceptDraw PRO ...
- Entity-Relationship Diagram ( ERD ) | Basic Diagramming | Network ...
- Basic Flowchart Symbols and Meaning | Types of Flowcharts ...
- Competitor Analysis | Entity-Relationship Diagram ( ERD ) with ...
- Entity Relationship Diagram Symbols | Sales Process Flowchart ...
- Competitor Analysis | Venn Diagrams | Entity-Relationship Diagram ...
- Flow chart Example. Warehouse Flowchart | Entity-Relationship ...


