The Fifty Two Elements of TQM

Total Quality Management Value

"Classic TQM Tools ...
Flow Charts Pictures, symbols or text coupled with lines, arrows on lines show direction of flow. Flowcharting enables
modeling of processes; problems/ opportunities and decision points etc. It develops a common understanding of a process by those in
volved." [whaqualitycenter.org/ Portals/ 0/ Tools%20 to%20 Use/ Classic%20 Quality%20 Tools/ Classic%20 TQM%20 Tools%20 R%20 2-12.pdf]
The vector stencils library TQM diagrams contains 58 symbols for drawing total quality management (TQM) flow charts using the ConceptDraw PRO diagramming and vector drawing software.
The example "Design elements - TQM diagram" is included in the Total Quality Management (TQM) Diagrams solution from the Quality area of ConceptDraw Solution Park.
TQM flow chart symbols

Total Quality Management Density
 flowcharts")
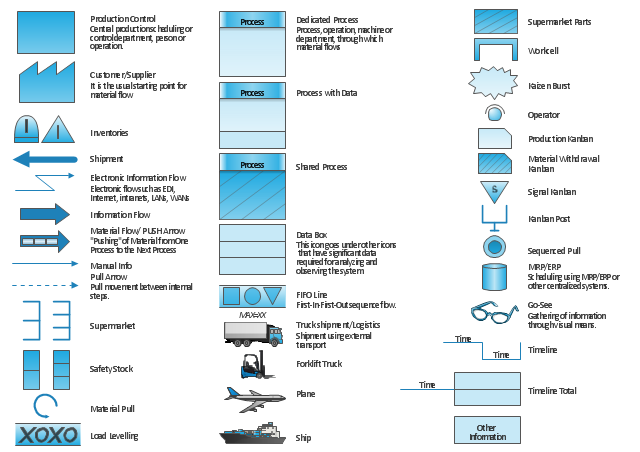
"Value stream mapping usually employs standard symbols to represent items and processes, therefore knowledge of these symbols is essential to correctly interpret the production system problems." [Value stream mapping. Wikipedia]
The vector stencils library Value stream mapping contains 43 symbols for drawing the value stream mapping diagrams using the ConceptDraw PRO diagramming and vector drawing software.
The example "Design elements - Value stream mapping diagram" is included in the Value Stream Mapping solution from the Quality area of ConceptDraw Solution Park.
VSM symbols
Building Drawing Software for Design Office Layout Plan


HelpDesk
How to Create a TQM Diagram

Probability Quality Control Tools

TQM Tools

Total Quality Management

TQM Diagram Tool

Quality Control Chart Software — ISO Flowcharting

ERD Symbols and Meanings


 Computer Network Diagrams
Computer Network Diagrams solution extends ConceptDraw PRO software with samples, templates and libraries of vector icons and objects of computer network devices and network components to help you create professional-looking Computer Network Diagrams, to plan simple home networks and complex computer network configurations for large buildings, to represent their schemes in a comprehensible graphical view, to document computer networks configurations, to depict the interactions between network's components, the used protocols and topologies, to represent physical and logical network structures, to compare visually different topologies and to depict their combinations, to represent in details the network structure with help of schemes, to study and analyze the network configurations, to communicate effectively to engineers, stakeholders and end-users, to track network working and troubleshoot, if necessary.
Create TQM Flowcharts for Mac

- Probability Quality Control Tools | TQM Diagram Tool | Total Quality ...
- Design elements - TQM diagram | Total Quality Management ...
- Quality Control Chart Software — ISO Flowcharting | Design ...
- Design elements - TQM diagram | TQM diagram example | Total ...
- Design elements - TQM diagram | Management Tools — Total ...
- Design elements - TQM diagram | Total Quality Management with ...
- The Fifty Two Elements of TQM | Design elements - TQM diagram ...
- Design elements - TQM diagram | How to Create a TQM Diagram ...
- Total Quality Management Value | TQM Diagram Tool | Design ...
- Design elements - Fishbone diagram | Total Quality Management ...
- TQM Software — Build Professional TQM Diagrams | Design ...
- Create TQM Flowcharts for Mac | Total Quality Management TQM ...
- Total Quality Management with ConceptDraw | Design elements ...
- Total Quality Management TQM Diagrams | The Fifty Two Elements ...
- The Fifty Two Elements of TQM | Organizational Structure Total ...
- How to Create a TQM Diagram Using Total Quality Management ...
- Total value of manufacturers' shipments - Arrow graph | Design ...
- Design elements - Process flowchart | TQM Diagram — Professional ...
- UML Deployment Diagram . Design Elements
- Process Flowchart | The Fifty Two Elements of TQM | Organizational ...