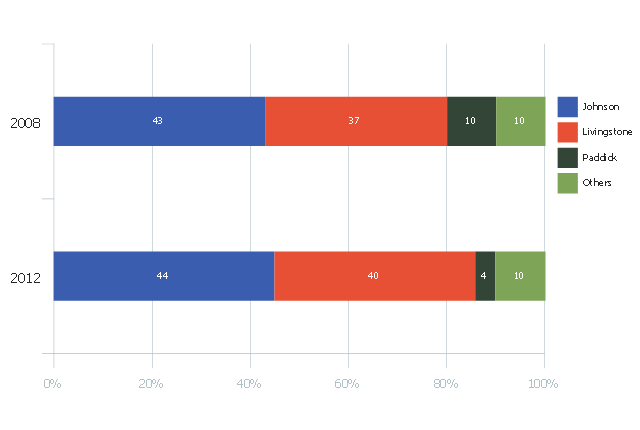
This divided bar chart sample was drawn on the base of the infographics "London Elections Results by Numbers" from the london.gov.uk website.
[data.london.gov.uk/ datastore/ package/ london-elections-results-2012-wards-boroughs-constituency]
"There are six types of elections in the United Kingdom: United Kingdom general elections, elections to devolved parliaments and assemblies, elections to the European Parliament, local elections, mayoral elections and Police and Crime Commissioner elections. Elections are held on Election Day, which is conventionally a Thursday. General elections do not have fixed dates, but must be called within five years of the opening of parliament following the last election. Other elections are held on fixed dates, though in the case of the devolved assemblies and parliaments early elections can occur in certain situations. Currently, six electoral systems are used: the single member plurality system (First Past the Post), the multi member plurality system, party list PR, the single transferable vote, the Additional Member System and the Supplementary Vote.
Elections are administered locally: in each lower-tier local authority, the actual polling procedure is run by the Returning Officer and the compiling and maintenance of the electoral roll by the Electoral Registration Officer (except in Northern Ireland, where the Electoral Office for Northern Ireland assumes both responsibilities). The Electoral Commission only sets standards for and issues guidelines to Returning Officers and Electoral Registration Officers, but is responsible for nationwide electoral administration (such as the registration of political parties and directing the administration of national referendums)." [Elections in the United Kingdom. Wikipedia]
The divided bar diagram example "London election results" was created using the ConceptDraw PRO diagramming and vector drawing software extended with the Divided Bar Diagrams solution from the Graphs and Charts area of ConceptDraw Solution Park.
Divided bar chart
Basic Flowchart Images. Flowchart Examples

This sample shows the Flowchart that displays the procedures of 2PP (two-party preferred) voting and counting the voters. The two-party-preferred vote is the result of the elections that was distributed to the final two parties.
Geo Map - Africa - Botswana

The vector stencils library Botswana contains contours for ConceptDraw PRO diagramming and vector drawing software. This library is contained in the Continent Maps solution from Maps area of ConceptDraw Solution Park.
Bar Diagram Math

Donut Chart Templates

All these donut chart templates are included in the Pie Charts solution.
You can quickly rework these examples into your own charts by simply changing displayed data, title and legend texts.
Relative Value Chart Software

Relative values are widely used in:business, economics, investment, management, marketing, statistics, etc.
ConceptDraw PRO software is the best for drawing professional looking Relative Value Charts. ConceptDraw PRO provides Divided Bar Diagrams solution from the Graphs and Charts Area of ConceptDraw Solution Park.
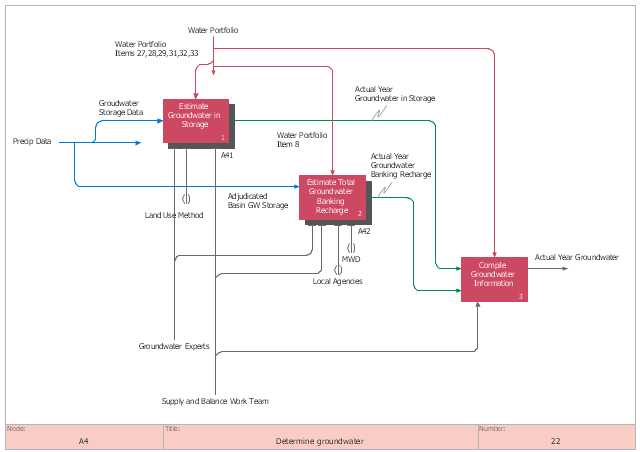
This IDEF0 diagram sample was created on the base of the figure from the California Water Plan website. [waterplan.water.ca.gov/ technical/ cwpu2009/ flowdiaghtml/ dgm18.htm]
"The California Water Plan provides a collaborative planning framework for elected officials, agencies, tribes, water and resource managers, businesses, academia, stakeholders, and the public to develop findings and recommendations and make informed decisions for California's water future. The plan, updated every five years, presents the status and trends of California's water-dependent natural resources; water supplies; and agricultural, urban, and environmental water demands for a range of plausible future scenarios. The California Water Plan also evaluates different combinations of regional and statewide resource management strategies to reduce water demand, increase water supply, reduce flood risk, improve water quality, and enhance environmental and resource stewardship. The evaluations and assessments performed for the plan help identify effective actions and policies for meeting California's resource management objectives in the near term and for several decades to come." [waterplan.water.ca.gov]
The IDEF0 diagram example "Determine groundwater" was created using the ConceptDraw PRO diagramming and vector drawing software extended with the IDEF0 Diagrams solution from the Software Development area of ConceptDraw Solution Park.
IDEF0 diagram
Geo Map - Asia - Georgia

The vector stencils library Georgia contains contours for ConceptDraw PRO diagramming and vector drawing software. This library is contained in the Continent Maps solution from Maps area of ConceptDraw Solution Park.
Geo Map - Asia - Indonesia

The vector stencils library Indonesia contains contours for ConceptDraw PRO diagramming and vector drawing software. This library is contained in the Continent Maps solution from Maps area of ConceptDraw Solution Park.
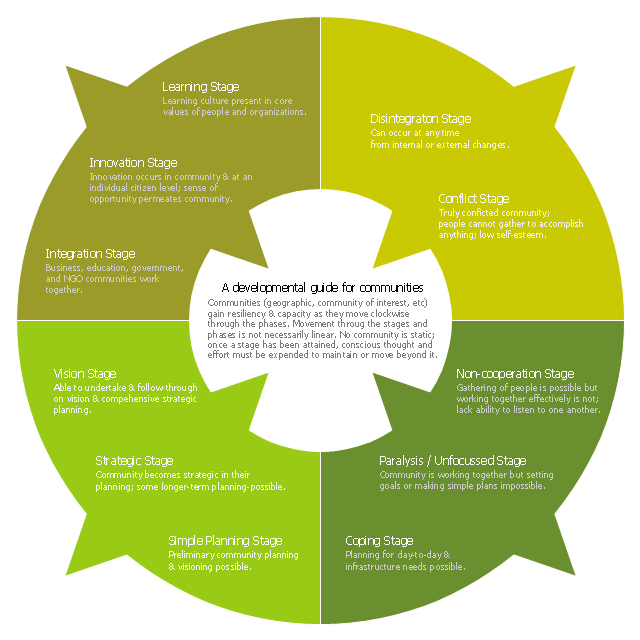
This ring chart sample was created on the base of the figure illustrating the "CCP Handbook - Comprehensive Community Planning for First Nations in British Columbia" from the Government of Canada website. "Tool 1: Centre for Innovative & Entrepreneurial Leadership (CIEL) Community Life Cycle Matrix.
Actualization Phase.
Community is highly developed and encourages learning & innovation while respecting history and culture. Community shares resources with others and regularly monitors itself, continuing to enhance capacity.
Action: Community undertakes regular reviews and reflection activities to maintain or enhance stage / phase.
Pre-Community or Chaos Phase.
Community is undeveloped. Limited sharing of resources or recognition of value of a community.
Action: Community can (re)form through the identification of and action of influential and respected leaders (elected or unelected).
Vision Phase.
Community recognizes the importance of vision and long-term planning; is able to move in this direction.
Action: Community can engage in planning, meaningful consultation of its members, & working towards the development of strategic thinking & planning, and, ultimately, identifying community-wide values, distinct community characteristics and a vision.
Emergence Phase.
Community exists but has significant problems, making anything but survival & fulfilling short-term needs impossible.
Action: Community can advance through focus on small, non-political, trustbuilding projects to build success, respect, confidence, relationships & skills.
Why the Matrix.
The challenge of developing innovative and entrepreneurial communities is in ensuring that the communities have a clear picture of where they are at and where they want to go. This enables a better match of the tools available with both the capacity of the community and the hoped for goal. For example, while strategic planning may work for some communities, the planning process may also lead to frustration and failure in other communities that do not have the necessary trust, social capital or capacity." [aadnc-aandc.gc.ca/ eng/ 1100100021972/ 1100100022090]
The ring chart example "Community life cycle matrix" was created using the ConceptDraw PRO diagramming and vector drawing software extended with the Target and Circular Diagrams solution from the Marketing area of ConceptDraw Solution Park.
www.conceptdraw.com/ solution-park/ marketing-target-and-circular-diagrams
Ring chart
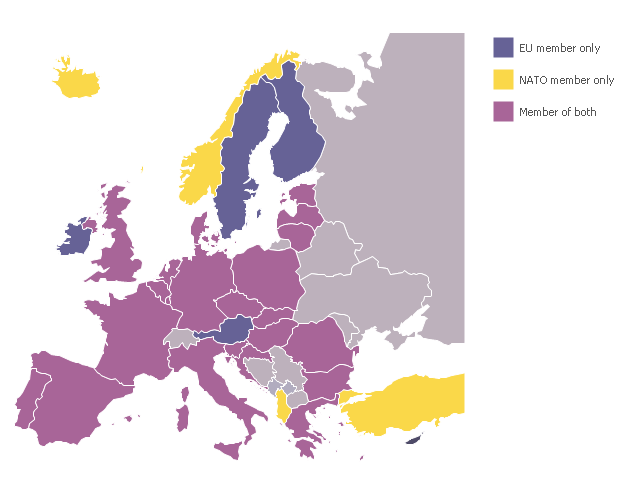
A map showing European membership of the EU and NATO.
"The European Union (EU) is an economic and political union of 28 member states that are located primarily in Europe.
The EU operates through a system of supranational independent institutions and intergovernmental negotiated decisions by the member states. Institutions of the EU include the European Commission, the Council of the European Union, the European Council, the Court of Justice of the European Union, the European Central Bank, the Court of Auditors, and the European Parliament. The European Parliament is elected every five years by EU citizens. The EU's de facto capital is Brussels." [European Union. Wikipedia]
"The principal military alliance in Europe remains NATO, which includes 21 of all EU member states as well as other non-EU European countries, Turkey, the United States and Canada." [Military of the European Union. Wikipedia]
"The North Atlantic Treaty Organization (NATO), also called the (North) Atlantic Alliance, is an intergovernmental military alliance based on the North Atlantic Treaty which was signed on 4 April 1949. The organization constitutes a system of collective defence whereby its member states agree to mutual defense in response to an attack by any external party. NATO's headquarters are in Brussels, Belgium, one of the 28 member states across North America and Europe, the newest of which, Albania and Croatia, joined in April 2009." [NATO. Wikipedia]
This Europe map example was redesigned using the ConceptDraw PRO diagramming and vector drawing software from the Wikimedia Commons file: EU and NATO.svg.
[commons.wikimedia.org/ wiki/ File:EU_ and_ NATO.svg]
The Europe political map example "European membership of the EU and NATO map" is included in the Continent Maps solution from the Maps area of ConceptDraw Solution Park.
Political map - EU and NATO
Geo Map - Africa - Sierra Leone

The vector stencils library Sierra Leone contains contours for ConceptDraw PRO diagramming and vector drawing software. This library is contained in the Continent Maps solution from Maps area of ConceptDraw Solution Park.
 USA Maps
Use the USA Maps solution to create a map of USA, a US interstate map, printable US maps, US maps with cities and US maps with capitals. Create a complete USA states map.
Chart Examples

Pie Chart Examples and Templates

Pie chart examples and templates created using ConceptDraw PRO software helps you get closer with pie charts and find pie chart examples suite your needs.
 Pie Charts
Pie Charts are extensively used in statistics and business for explaining data and work results, in mass media for comparison (i.e. to visualize the percentage for the parts of one total), and in many other fields. The Pie Charts solution for ConceptDraw PRO v10 offers powerful drawing tools, varied templates, samples, and a library of vector stencils for simple construction and design of Pie Charts, Donut Chart, and Pie Graph Worksheets.
 Divided Bar Diagrams
The Divided Bar Diagrams Solution extends the capabilities of ConceptDraw PRO v10 with templates, samples, and a library of vector stencils for drawing high impact and professional Divided Bar Diagrams and Graphs, Bar Diagram Math, and Stacked Graph.
 Continent Maps
Continent Maps solution extends ConceptDraw PRO software with templates, samples and libraries of vector stencils for drawing the thematic maps of continents, state maps of USA and Australia.
- Exploded pie chart - European Parliament election | London election ...
- Divided bar diagram - London election results | Relative Value Chart ...
- Exploded pie chart - European Parliament election | Exploded pie ...
- Exploded pie chart - European Parliament election | European ...
- Divided Bar Diagrams
- London election results - Divided bar diagram | What is a Dashboard ...
- Bar Diagram Math | Divided bar diagram - Template | London ...
- Exploded pie chart template (percentage)
- Bar Diagrams for Problem Solving. Create space science bar charts ...
- Divided bar diagram - London election results | 2012 United States ...
- Bar graph - Serious Crime in Cincinnati | How to Create a Column ...
- How to Draw a Divided Bar Chart in ConceptDraw PRO | Divided ...
- London tube map | How to draw Metro Map style infographics ...
- How to Draw a Divided Bar Chart in ConceptDraw PRO | Waterfall ...
- Divided bar diagram - Template | How to Draw a Divided Bar Chart ...
- UML Diagram Types List | UML Notation | UML Diagrams with ...
- Business process diagram BPMN 1.2 - Hiring process | Process ...
- UML Use Case Diagram Example Registration System | EPC ...
- How to Create a Bar Chart in ConceptDraw PRO | How to Create a ...