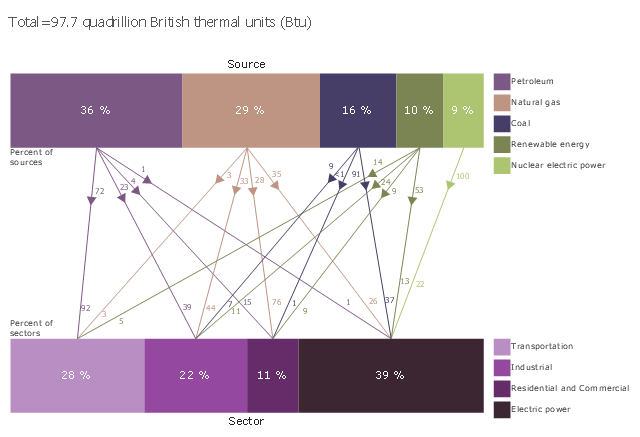
This divided bar diagram sample shows U.S. primary energy consumption by source and sector in 2015. It was designed using data from the chart in the webpage "U.S. Energy Facts Explained, Consumption & Production" on the website of the U.S. Energy Information Administration.
"Americans use many types of energy
Petroleum, natural gas, coal, renewable energy, and nuclear electric power are primary sources of energy. Electricity is a secondary energy source that is generated from primary sources of energy.
Energy sources are measured in different physical units: liquid fuels in barrels or gallons, natural gas in cubic feet, coal in short tons, and electricity in kilowatts and kilowatthours. In the United States, British thermal units (Btu), a measure of heat energy, is commonly used for comparing different types of energy to each other. In 2015, total U.S. primary energy consumption was about 97.7 quadrillion (1015, or one thousand trillion) Btu."
[eia.gov/ energyexplained/ index.cfm?page=us_ energy_ home]
The chart example "U.S. primary energy consumption by source and sector" was created using the ConceptDraw PRO diagramming and vector drawing software extended with the Divided Bar Diagrams solution from the Graphs and Charts area of ConceptDraw Solution Park.
- Electricity Meter Symbol
- Electrical Symbols, Electrical Diagram Symbols | Process Flow ...
- Electrical Drawing Software and Electrical Symbols | Design ...
- Electrical Symbols, Electrical Diagram Symbols | Electrical Drawing ...
- Process Flowchart | Mechanical Engineering | Electrical Symbols ...
- Electrical Symbols — Power Sources | LLNL Flow Charts | Energy ...
- Design elements - Lamps, acoustics, measuring instruments ...
- Electricity Elements
- Electrical Drawing Software and Electrical Symbols | Electrical ...
- Concept Draw Measure To Scale
- Design elements - Lamps, acoustics, measuring instruments ...
- Electrical Drawing Software and Electrical Symbols | Electrical ...
- Electrical Drawing Software and Electrical Symbols | Process ...
- Electrical Drawing Software and Electrical Symbols | Electrical ...
- Electrical Symbols — Lamps, Acoustics, Readouts | How To use ...
- How To use House Electrical Plan Software | Electrical Drawing ...
- Electrical Symbols — Thermo | Design elements - Heating ...
- Design elements - Lamps, acoustics, measuring instruments ...
- Sector diagram - Template. Economic sector weightings. Domestic ...
- Electrical Symbols, Electrical Diagram Symbols | Electrical Drawing ...
