This site uses cookies. By continuing to browse the ConceptDraw site you are agreeing to our Use of Site Cookies.

energy, oil and gas, energy industry, oil industry, oil and gas industry infographics, oil and gas symbols, oil and gas graphics Oil and Gas

energy, oil and gas, energy industry, oil industry, oil and gas industry infographics, oil and gas symbols, oil and gas graphics
The Oil and Gas solution for ConceptDraw DIAGRAM software provides vector libraries of oil and gas symbols and a collection of samples for quick and simple designing of the oil and gas industry infographics, illustrations, presentations, diagrams. The resulting oil and gas graphics and illustrations help to clearly and quickly detail complex information. They are ideal for reporting on the development of best practices in oil and gas exploration and production. Use them to illustrate growth strategies and trends in the oil industry, conduct analysis, forecast the energy industry, and present the results of international energy forums.

energy icons, electrical power industry, industry icons, industry symbols, renewable energy industry, electrical substation diagram Energy Industry Infographics

energy icons, electrical power industry, industry icons, industry symbols, renewable energy industry, electrical substation diagram
Energy Industry Infographics solution is ideal for designing energy-related business infographics, diagrams, charts, illustrations for documents and presentations. It provides a set of libraries with special vector energy industry symbols, icons for electrical power industry, nuclear power industry, fossil fuel industry, and renewable energy industry, energy icons of fuel gas, liquid fuel, solid fuel, industry icons of electrical substations, power plants. Collection of samples including nuclear fuel cycle and energy distribution schematics, electrical substation diagram, energy intelligence dashboard, electricity grid schematics, and many more is also included. This solution is indispensable for all engineers, chefs, managers, marketers, and other professionals working in energy industry.

chemical engineering, process engineering, process flow diagram symbols, process and instrumentation diagram, process diagrams Chemical and Process Engineering

chemical engineering, process engineering, process flow diagram symbols, process and instrumentation diagram, process diagrams
Extending the ConceptDraw DIAGRAM diagramming and drawing software with process flow diagram symbols, samples, process diagrams templates and libraries of design elements for creating process and instrumentation diagrams, block flow diagrams, process flow diagrams, and piping and instrumentation diagrams for chemical and process engineering, the Chemical and Process Engineering solution can be used by both chemical and project engineers, as well as the chemists for creating the needed drawings.

internet of things, iot, web of things, wot, iot devices Internet of Things

internet of things, iot, web of things, wot, iot devices
The Internet of Things solution extends ConceptDraw DIAGRAM with a set of samples and a wide collection of predesigned special clipart, pictograms, and symbols of IoT sensors, IoT devices, smart appliances, retail, industrial, and agricultural IoT devices, and many other IoT objects. This solution is incredibly helpful for designing the Internet of Things (IoT) and Web of Things (WoT) diagrams and infographics of different complexity for numerous areas and industries. It is incredibly useful for engineers, designers, electricians, mechanics, developers, technicians, electronics, and safety-related specialists.

green energy infographics, solar power, renewable energy, cleaner energy, how do solar panels work, wind power, hydropower, tidal power Green Energy

green energy infographics, solar power, renewable energy, cleaner energy, how do solar panels work, wind power, hydropower, tidal power
Green Energy solution extends the ConceptDraw DIAGRAM functionality with a large collection of vector design icons, pictograms, and clipart useful to design green energy infographics and illustrations of any kind. Create overview infographics about solar power, wind power, hydropower, tidal power and other renewable and cleaner energy sources. Compare visually different types of energy or data over several years in one chart. Develop detailed infographics about power generation mechanisms, how do solar panels work, wind and tidal turbines, and more specialized power generation equipment.

Electrical Symbols — Stations

A power station is an industrial facility for the generation of electric power. Most power stations contain one or more generators, a rotating machine that converts mechanical power into electrical power. The relative motion between a magnetic field and a conductor creates an electrical current. The energy source harnessed to turn the generator varies widely. Most power stations in the world burn fossil fuels such as coal, oil, and natural gas to generate electricity. Others use nuclear power, but there is an increasing use of cleaner renewable sources such as solar, wind, wave and hydroelectric. 26 libraries of the Electrical Engineering Solution of ConceptDraw DIAGRAM make your electrical diagramming simple, efficient, and effective. You can simply and quickly drop the ready-to-use objects from libraries into your document to create the electrical diagram.

Process Flow Graphics

Process flow diagrams are applied in industrial engineering, manufacturing, business, project management, chemical engineering, process engineering, and other areas. ConceptDraw DIAGRAM software extended with Chemical and Process Engineering solution provides powerful drawing tools and extensive features to create Process flow graphics, analyze, streamline, and improve business processes and construction designs. Use it to give an overview and document the overall processes, standardize and make their understanding simpler, improve quality control and training of employees, increase process efficiency, and make changes if required.

Process Flow Diagram

A Process Flow Diagram (PFD) is a diagram which shows the relationships between the main components in a system. Process Flow Diagrams are widely used by engineers in chemical and process engineering, they allows to indicate the general flow of plant process streams and equipment, helps to design the petroleum refineries, petrochemical and chemical plants, natural gas processing plants, and many other industrial facilities. ConceptDraw DIAGRAM diagramming and vector drawing software extended with powerful tools of Flowcharts Solution from the "Diagrams" Area of ConceptDraw Solution Park is effective for drawing: Process Flow Diagram, Flow Process Diagram, Business Process Flow Diagrams.

cybersecurity, communications, homeland security, financial services, information technology, emergency services, energy sector Critical Infrastructure Sectors

cybersecurity, communications, homeland security, financial services, information technology, emergency services, energy sector
Critical Infrastructure Sectors solution for ConceptDraw DIAGRAM software provides a set of examples and vector stencil libraries for designing infographics and diagrams about means for the most efficient protection of critical infrastructure, energy sector, and rapid recovery in the case of disruptions. Illustrate your projects on the prevention of physical, environmental, and cyber threats, development of information technology and detection equipment. Improve your projects in communications, financial services, emergency services, homeland security, cybersecurity to solve critical issues efficiently and decrease the detrimental effects of disruptions on society and citizens. Show the results of testing new technologies and newest equipment for critical infrastructure protection and increasing resilience.
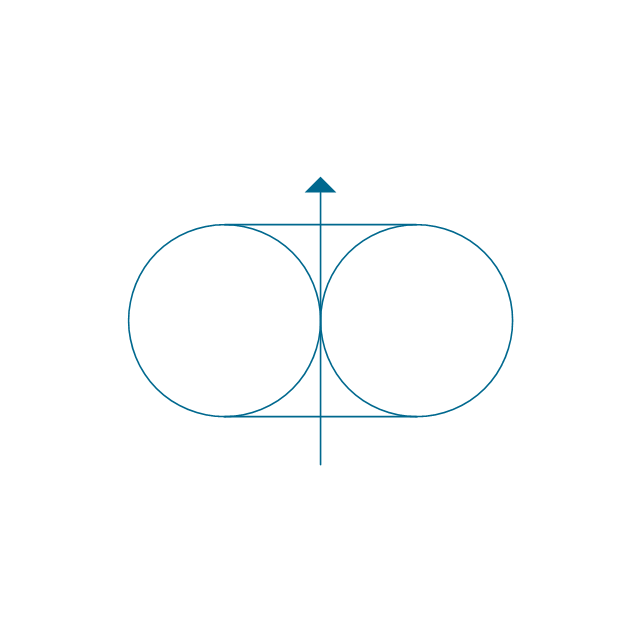
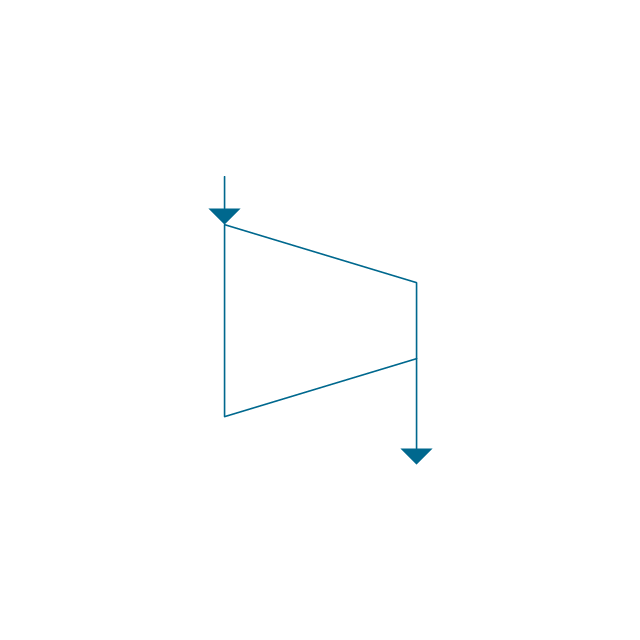
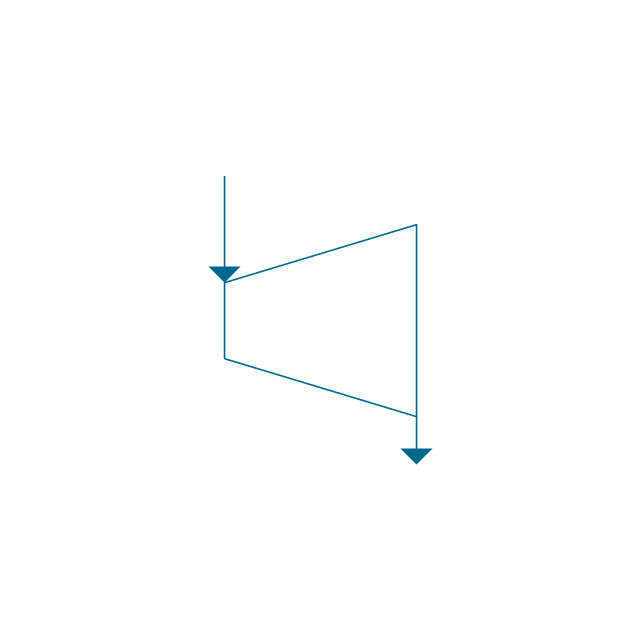
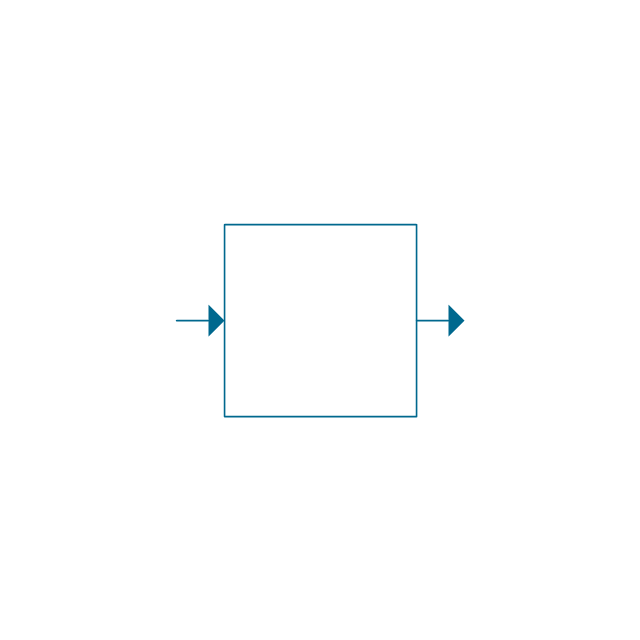
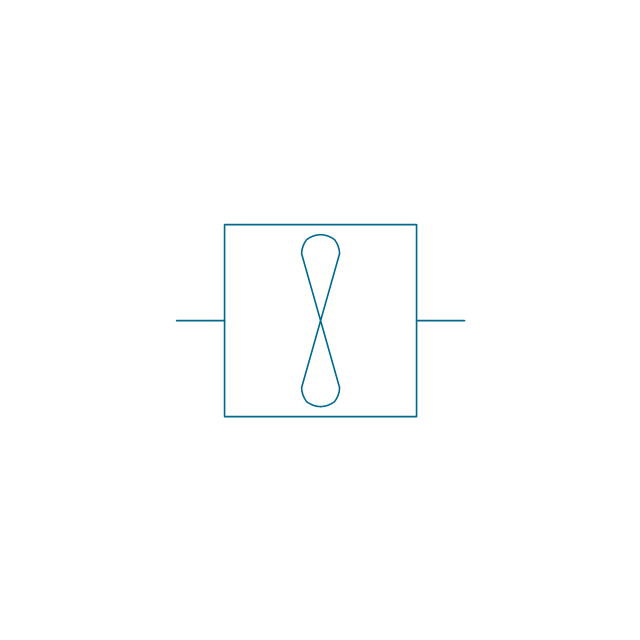
The vector stencils library "Valves and fittings" contains 104 symbols of valve components.
Use these icons for drawing industrial piping systems; process, vacuum, and fluids piping; hydraulics piping; air and gas piping; materials distribution; and liquid transfer systems.
"A valve is a device that regulates, directs or controls the flow of a fluid (gases, liquids, fluidized solids, or slurries) by opening, closing, or partially obstructing various passageways. Valves are technically valves fittings, but are usually discussed as a separate category. In an open valve, fluid flows in a direction from higher pressure to lower pressure.
The simplest, and very ancient, valve is simply a freely hinged flap which drops to obstruct fluid (gas or liquid) flow in one direction, but is pushed open by flow in the opposite direction. This is called a check valve, as it prevents or "checks" the flow in one direction. ...
Valves are found in virtually every industrial process, including water & sewage processing, mining, power generation, processing of oil, gas & petroleum, food manufacturing, chemical & plastic manufacturing and many other fields. ...
Valves may be operated manually, either by a handle, lever, pedal or wheel. Valves may also be automatic, driven by changes in pressure, temperature, or flow. These changes may act upon a diaphragm or a piston which in turn activates the valve, examples of this type of valve found commonly are safety valves fitted to hot water systems or boilers.
More complex control systems using valves requiring automatic control based on an external input (i.e., regulating flow through a pipe to a changing set point) require an actuator. An actuator will stroke the valve depending on its input and set-up, allowing the valve to be positioned accurately, and allowing control over a variety of requirements." [Valve. Wikipedia]
The example "Design elements - Valves and fittings" was created using the ConceptDraw PRO diagramming and vector drawing software extended with the Chemical and Process Engineering solution from the Engineering area of ConceptDraw Solution Park.
Valves and fittings symbols
Valves and fittings symbols, wedge gate valve, valve manifold, tundish, swivel joint, strainer, stop check valve, soldered, solvent, socket, spigot, socket,  spigot, socket weld, sleeve joint, separator, screwed sleeve, screwed joint, screw-down valve, screw-down check valve, relief valve, relief angle valve vacuum, relief angle valve pressure, reel valve, reducing valve, reducer, powered valve, plug valve straight through, plug valve T point, plug valve L point, plug valve 3 way, plug valve, parallel slide valve, open vent, needle valve, lock-shield valve, liquid seal, joint, hydrant, globe valve, gate valve, float operated valve, flanged valve, flanged joint, bolted joint, flame arrester, exhaust silencer, exhaust head, end cap socket and spigot, end cap screwed, end cap quick release, end cap flanged and bolted, end cap fillet welded, end cap butt welded, end cap	screwed and plugged, end cap, electrically insulated, electrically bonded, drain silencer, diaphragm valve, check valve, characterized port valve, butterfly valve, butt weld, bursting disc, bell mouth, ball valve, angle valve, Y strainer, 3-way plug valve,

Process Engineering

ConceptDraw DIAGRAM diagramming and vector drawing software supplied with Chemical and Process Engineering Solution from the Industrial Engineering Area of ConceptDraw Solution Park is powerful and effective process engineering software.

technical drawing, vector icons, plumbing plan, heating plan, electrical diagram, public utility icons Public Utilities

technical drawing, vector icons, plumbing plan, heating plan, electrical diagram, public utility icons
Public Utilities solution is a thematic toolset for designing infographics and diagrams about public utilities. It provides examples and premade public utility icons in vector icons libraries to develop innovative strategies for the improvement of public utility services, enhance their efficiency of delivery, and extend reliable access to services to all communities. The solution helps to public utility companies plan their activities efficiently, develop new technologies and make visual presentation, create plumbing plan, heating plan, electrical diagram, or any other technical drawing, make the overview of modern public utilities, increase utility profits, and remain the best in the market.

Process Diagrams

ConceptDraw DIAGRAM diagramming and vector drawing software extended with Chemical and Process Engineering Solution from the Industrial Engineering Area of ConceptDraw Solution Park offers you the set of useful tools for easy drawing various Process Diagrams.

Technical Drawing Software

Technical drawing or draft is a form of specialized graphic communication, exchange of ideas in industry and engineering. It is a visual representation of object with indication of dimensions and used material, constructed with maintaining the proportions between its parts. Technical drawings are constructed by architects, technologists, engineers, designers, drafters, and other technical professionals according to defined rules, specifications, internationally accepted standards and standardized notations allowing to make unambiguous, clear and understandable technical drawings. ConceptDraw DIAGRAM extended with Electrical Engineering solution, Mechanical Engineering solution, Chemical and Process Engineering solution from Industrial Engineering Area of ConceptDraw Solution Park is ideal technical drawing software. Its powerful drawing tools, predesigned vector objects, templates, samples are helpful for creation all kinds of Technical Drawings and Technical Diagrams, Electrical and Mechanical Schematics, Circuit and Wiring Diagrams, Structural Drawings, and many other.

cross-functional flowchart template, flowchart, example business process flow Cross-Functional Flowcharts

cross-functional flowchart template, flowchart, example business process flow
The Cross-Functional Flowcharts solution extends ConceptDraw DIAGRAM software with cross functional flowchart examples, samples, and libraries of cross functional flow chart vector design elements and CH-1 symbols for easy drawing professional-looking and illustrative Cross Functional Flowchart, Cross Functional Diagram, CH-1 Diagram, Process Flowchart, Deployment Flowchart, Opportunity Flowchart, Swimlane Process Mapping Diagram, or Visio Cross Functional Flowchart for planning and further analyzing, optimizing and improvement processes. The use of included pre-made cross functional flowchart template, opportunity flowchart template, and swimlane process map template, greatly easier designing your Cross-functional flowcharts.

process flow diagram, process flow chart Process Flowcharts

process flow diagram, process flow chart
This solution extends ConceptDraw DIAGRAM software with templates, samples, and library of vector shapes for drawing the Process Flowcharts.
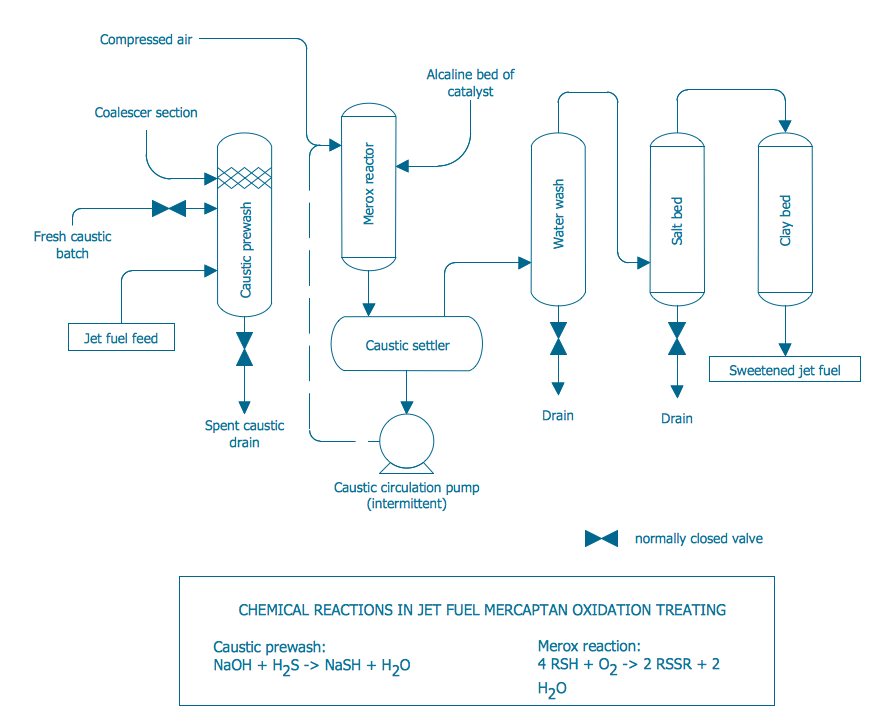
This PFD of jet fuel mercaptan oxidation treating was redrawn from Wikipedia file: ConvLPGMerox.png. [en.wikipedia.org/ wiki/ File:ConvKeroMerox.png]
This file is licensed under the Creative Commons Attribution-Share Alike 3.0 Unported icense. [creativecommons.org/ licenses/ by-sa/ 3.0/ deed.en]
"Merox is an acronym for mercaptan oxidation. It is a proprietary catalytic chemical process developed by UOP used in oil refineries and natural gas processing plants to remove mercaptans from LPG, propane, butanes, light naphthas, kerosene and jet fuel by converting them to liquid hydrocarbon disulfides.
The Merox process requires an alkaline environment which, in some of the process versions, is provided by an aqueous solution of sodium hydroxide (NaOH), a strong base, commonly referred to as caustic. In other versions of the process, the alkalinity is provided by ammonia, which is a weak base.
The catalyst in some versions of the process is a water-soluble liquid. In other versions, the catalyst is impregnated onto charcoal granules.
Processes within oil refineries or natural gas processing plants that remove mercaptans and/ or hydrogen sulfide (H2S) are commonly referred to as sweetening processes because they results in products which no longer have the sour, foul odors of mercaptans and hydrogen sulfide. The liquid hydrocarbon disulfides may remain in the sweetened products, they may be used as part of the refinery or natural gas processing plant fuel, or they may be processed further.

The Merox process is usually more economical than using a catalytic hydrodesulfurization process for much the same purpose." [en.wikipedia.org/ wiki/ Merox]
The process flow diagram (PFD) example "Jet fuel mercaptan oxidation treating" was drawn using the ConceptDraw PRO software extended with the Chemical and Process Engineering solution from the Chemical and Process Engineering area of ConceptDraw Solution Park.
Process flow diagram (PFD)
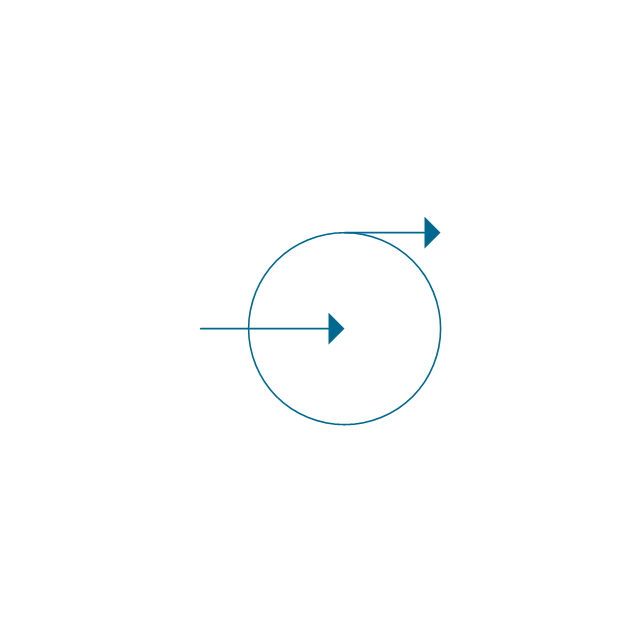
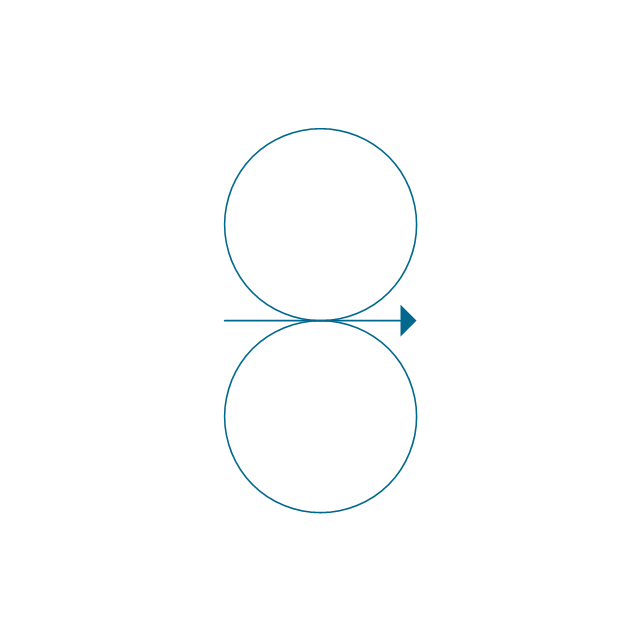
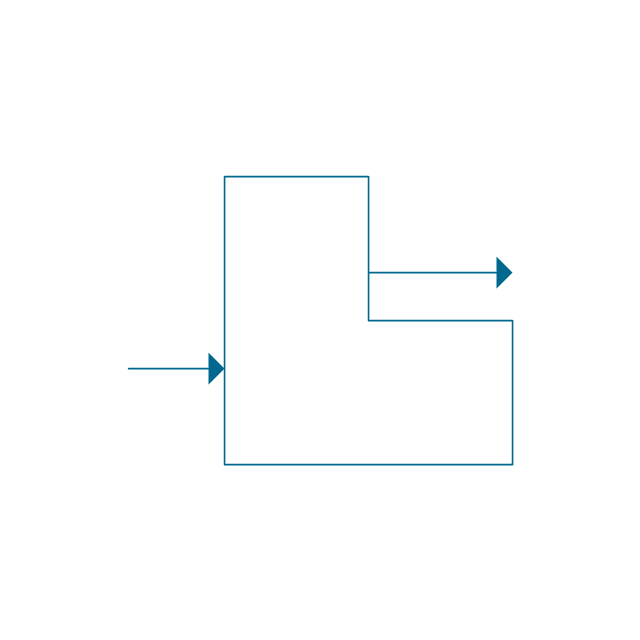
Process flow diagram (PFD), gate valve, electrically insulated, column, centrifugal pump,

Pie Chart Word Template. Pie Chart Examples

The Pie Chart visualizes the data as the proportional parts of a whole and looks like a disk divided into sectors. The pie chart is type of graph, pie chart looks as circle devided into sectors. Pie Charts are widely used in the business, statistics, analytics, mass media. It’s very effective way of displaying relative sizes of parts, the proportion of the whole thing.

electrical symbols, transmission lines, circuit diagram, circuit symbols, electrical circuit, three-phase power, electric generators Power Сircuits

electrical symbols, transmission lines, circuit diagram, circuit symbols, electrical circuit, three-phase power, electric generators
The Power Circuits solution for ConceptDraw DIAGRAM is designed for drawing power electrical circuits, power grids, power generation, transformation, transmission, and distribution systems. It includes a set of samples and a large number of generally accepted electrical circuit symbols that guarantee clarity and simple comprehension of diagrams. The electrical symbols of transformers, motor starters, power stations, electric generators, electrical motors, windings connections, transmission lines, and more equipment are included. Use this solution to successfully create the Power Circuit Diagram of any complexity, display the functional parts of the electrical circuit and connections between them, electrical connections in substations, explain the principles of operation of electrical and power mechanisms, one-phase and three-phase power generation, create specifications of power electrical equipment.

ConceptDraw Solution Park ConceptDraw Solution Park

ConceptDraw Solution Park
ConceptDraw Solution Park collects graphic extensions, examples and learning materials