This circle diagram sample was redesigned from the Wikimedia Commons file: Research cycle.png. "Some of the basic elements of the scientific method, arranged in a cycle to emphasize that it is an iterative process." [commons.wikimedia.org/ wiki/ File:Research_ cycle.png]
This file is licensed under the Creative Commons Attribution 2.0 Generic license. [creativecommons.org/ licenses/ by/ 2.0/ deed.en]
"The scientific method is a body of techniques for investigating phenomena, acquiring new knowledge, or correcting and integrating previous knowledge. To be termed scientific, a method of inquiry must be based on empirical and measurable evidence subject to specific principles of reasoning. ...
Four essential elements of the scientific method are iterations, recursions, interleavings, or orderings of the following:
(1) Characterizations (observations, definitions, and measurements of the subject of inquiry).
(2) Hypotheses (theoretical, hypothetical explanations of observations and measurements of the subject).
(3) Predictions (reasoning including logical deduction from the hypothesis or theory).
(4) Experiments (tests of all of the above)...
A linearized, pragmatic scheme of the four points above is sometimes offered as a guideline for proceeding:
(1) Define a question.
(2) Gather information and resources (observe).
(3) Form an explanatory hypothesis.
(4) Test the hypothesis by performing an experiment and collecting data in a reproducible manner.
(5) Analyze the data.
(6) Interpret the data and draw conclusions that serve as a starting point for new hypothesis.
(7) Publish results.
(8) Retest (frequently done by other scientists).
The iterative cycle inherent in this step-by-step method goes from point 3 to 6 back to 3 again." [Scientific method. Wikipedia]
The circle diagram example "Research cycle" was created using the ConceptDraw PRO diagramming and vector drawing software extended with the Target and Circular Diagrams solution from the Marketing area of ConceptDraw Solution Park.
www.conceptdraw.com/ solution-park/ marketing-target-and-circular-diagrams
Circle diagram

 Target and Circular Diagrams
This solution extends ConceptDraw DIAGRAM software with samples, templates and library of design elements for drawing the Target and Circular Diagrams.
Flowchart Definition

The vector stencils library "Circular diagrams" contains 42 templates of circular diagrams: circular arrow diagram, circular motion diagram, arrow ring chart, doughnut chart (donut chart), circle pie chart, diamond pie chart, circle diagram, pie chart, ring chart, loop diagram, block loop diagram, arrow loop circle, crystal diagram, triangular diagram, diamond diagram, pentagon diagram, hexagon diagram, heptagon diagram, cycle diagram (cycle chart), stacked Venn diagram (onion diagram), arrow circle diagram.
Use these shapes to illustrate your marketing and sales documents, presentations, webpages and infographics in the ConceptDraw PRO diagramming and vector drawing software extended with the Target and Circular Diagrams solution from the Marketing area of ConceptDraw Solution Park.
www.conceptdraw.com/ solution-park/ marketing-target-and-circular-diagrams
Circular arrow diagram 1
Circular arrow diagram 2
Arrow ring chart
Doughnut chart

Diamond pie chart

Pie chart

Circle diagram

Circle pie chart 2

Circle pie chart 1

Ring chart 1 - 3 elements

Ring chart 1 - 4 elements

Ring chart 1 - 5 elements

Ring chart 1 - 6 elements

Ring chart 1 - 7 elements

Ring chart 2 - 3 elements

Ring chart 2 - 4 elements

Ring chart 2 - 5 elements

Ring chart 2 - 6 elements

Ring chart 2 - 7 elements

Crystal diagram - 3 elements

Crystal diagram - 4 elements

Crystal diagram - 5 elements

Crystal diagram - 6 elements

Crystal diagram - 7 elements

Stacked Venn diagram - 4

Stacked Venn diagram - 5

Stacked Venn diagram - 6

Stacked Venn diagram - 7

Basic loop diagram

Block loop diagram

Arrow loop circle
Arrow loop - 3 circles
Arrow loop - 4 circles
Arrow loop - 5 circles
Arrow loop - 6 circles
Arrow loop - 7 circles
Arrow circle diagram - 3
Arrow circle diagram - 4
Stacked Venn diagram - 3

Arrow circle diagram - 5
Arrow circle diagram - 6
Arrow circle diagram - 7
Flowchart Components

Program to Make Flow Chart

The vector clipart library "Presentation design elements" contains 45 presentation symbols and arrows which you can easy use in your slides and illustrations.
"A presentation is the process of presenting a topic to an audience. It is typically a demonstration, lecture, or speech meant to inform, persuade, or build good will. ... the use of visuals reduced meeting times... audiences believe presenters who use visuals are more professional and credible than presenters who merely speak. ... meetings and presentations reinforced with visuals help participants reach decisions and consensus more quickly." [Presentation. Wikipedia]
The clip art example "Presentation design elements - Vector clipart library" was created in the ConceptDraw PRO diagramming and vector drawing software using the Presentation Clipart solution from the Illustration area of ConceptDraw Solution Park.
Advance Direction Sign

Circuit

Growth

Master Link

Comparison

Plus

Minus

Multiplication

Division

Loupe

Plus sign

Minus sign

Pros and Cons

Balance Lever

Balance

Scientific Research

Business People

Hand

Financial Growth

Wallet

Increase

Decrease

Clock

Mechanism

Interaction

Small Company

Big Company

Company Expansion

Foreign Market Entry

Time

Close Cooperation

Company

Company Merger

Company Extension

Foreign Market Penetration

Business Relations

Profits

Frame 1

Frame 2

Background 1

Background 2

Background 3

Background 4

Background 5

Title block

Financial Trade UML Use Case Diagram Example

Computer Hardware - Reseller Business Plan

Data Flow Diagram Model

Network Diagram Software. LAN Network Diagrams. Physical Office Network Diagrams


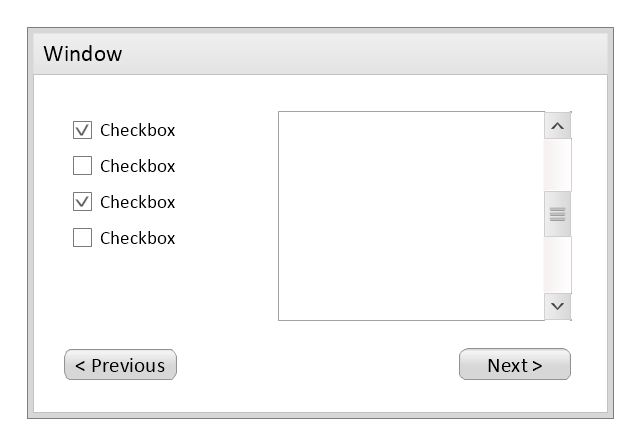
Use this template to prototype and design the wireframe graphic user interface (GUI).
"A website wireframe, also known as a page schematic or screen blueprint, is a visual guide that represents the skeletal framework of a website. Wireframes are created for the purpose of arranging elements to best accomplish a particular purpose. The purpose is usually being informed by a business objective and a creative idea. The wireframe depicts the page layout or arrangement of the website’s content, including interface elements and navigational systems, and how they work together. The wireframe usually lacks typographic style, color, or graphics, since the main focus lies in functionality, behavior, and priority of content. In other words, it focuses on what a screen does, not what it looks like. Wireframes can be pencil drawings or sketches on a whiteboard, or they can be produced by means of a broad array of free or commercial software applications. Wireframes are generally created by business analysts, user experience designers, developers, visual designers and other roles with expertise in interaction design, information architecture and user research.
Wireframes focus on:
(1) The kinds of information displayed.
(2) The range of functions available.
(3) The relative priorities of the information and functions.
(4) The rules for displaying certain kinds of information.
(5) The effect of different scenarios on the display.
The website wireframe connects the underlying conceptual structure, or information architecture, to the surface, or visual design of the website. Wireframes help establish functionality, and the relationships between different screen templates of a website. An iterative process, creating wireframes is an effective way to make rapid prototypes of pages, while measuring the practicality of a design concept. Wireframing typically begins between “high-level structural work - like flowcharts or site maps - and screen designs.” Within the process of building a website, wireframing is where thinking becomes tangible.
Aside from websites, wireframes are utilized for the prototyping of mobile sites, computer applications, or other screen-based products that involve human-computer interaction." [Website wireframe. Wikipedia]
The wireframe GUI template for the ConceptDraw PRO diagramming and vector drawing software is included in the Graphic User Interface solution from the Software Development area of ConceptDraw Solution Park.
Wireframe GUI template
What is SWOT Analysis?

Organization Chart Software


Total Quality Management Value

 Business Diagrams
The Business Diagrams Solution extends ConceptDraw DIAGRAM with an extensive collection of professionally designed illustrative samples and a wide variety of vector stencils libraries, which are the real help for all business-related people, business analysts, business managers, business advisers, marketing experts, PR managers, knowledge workers, scientists, and other stakeholders allowing them to design the bright, neat, expressive and attractive Bubble Diagrams, Circle-Spoke Diagrams, Circular Arrows Diagrams, and Venn Diagrams with different quantity of sets in just minutes; and then successfully use them in documents, reports, statistical summaries, and presentations of any style.
Competitor Analysis

This cycle diagram sample was created on the base of the figure illustrating the article "Environmental Materials" by Cris Arnold from the website of the UK Centre for Materials Education of the Higher Education Academy. "The figure ... schematically shows how the disparate areas under the heading of 'environmental materials' can be linked via a life cycle analysis approach. ...
Life Cycle Analysis.
Life Cycle Analysis is essentially a method of considering the entire environmental impact, energy and resource usage of a material or product. It is often known as a 'cradle-to-grave' analysis and can encompass the entire lifetime from extraction to end-of-life disposal. Life cycle analysis can be an extremely effective way of linking many different aspects of the environmental impacts of materials usage. ...
Materials Extraction and Resource Implications.
The environmental impact of raw materials extraction and processing together with global resource issues provides a good place to start consideration of environmental aspects of materials. ...
Environmental Impacts of Processing.
... Topics that would come under this subject area include the specific environmental problems associated with processing of metals, polymers, ceramics, composites etc, and how these problems can be overcome.
Design for Sustainability.
This area ... will ... cover issues such as design for successful recycling, waste minimisation, energy efficiency and increased lifetime.
Economic, Social and Legislative Issues.
... For example, materials selection within the automotive industry is now heavily influenced by 'end-of-life vehicle' and 'hazardous material' regulations.
Use of Sustainable Materials.
... It is probably sensible to define such materials as those that have distinct differences that achieve environmental benefit compared to conventional materials. With this definition, the list would include:
(1) Materials of a significantly plant-based nature, including wood, natural fibre composites, natural polymers.
(2) Materials produced using a large proportion of waste material, including recycled polymers, composites made from waste mineral powders, and arguably also much steel and aluminium.
Materials for Green Energy.
The most exciting developments in Materials Science are in the realm of functional materials, and many of these serve an environmentally-beneficial purpose, particularly in the production of green energy.
These include:
(1) Solar-cell materials.
(2) Fuel-cell technology.
(3) Catalytic pollution control.
End-of-Life Issues.
The treatment of materials at the end of their lifetime is a significant subject area and encompasses aspects such as recycling techniques and materials limitations, biodegradabilty and composting, chemical recovery and energy recovery." [materials.ac.uk/ guides/ environmental.asp]
The ring chart example "Life cycle analysis" was created using the ConceptDraw PRO diagramming and vector drawing software extended with the Target and Circular Diagrams solution from the Marketing area of ConceptDraw Solution Park.
www.conceptdraw.com/ solution-park/ marketing-target-and-circular-diagrams
Ring chart

This circular arrows diagram sample shows business process management life cycle.
It was designed on the base of the Wikimedia Commons file: Business Process Management Life-Cycle.svg. [commons.wikimedia.org/ wiki/ File:Business_ Process_ Management_ Life-Cycle.svg]
This file is licensed under the Creative Commons Attribution-Share Alike 3.0 Unported license. [creativecommons.org/ licenses/ by-sa/ 3.0/ deed.en]
"BPM life-cycle.
Business process management activities can be grouped into six categories: vision, design, modeling, execution, monitoring, and optimization.
Functions are designed around the strategic vision and goals of an organization. Each function is attached with a list of processes. Each functional head in an organization is responsible for certain sets of processes made up of tasks which are to be executed and reported as planned. Multiple processes are aggregated to function accomplishments and multiple functions are aggregated to achieve organizational goals." [Business process management. Wikipedia]
The arrow donut chart example "BPM life cycle" was created using the ConceptDraw PRO diagramming and vector drawing software extended with the Circular Arrows Diagrams solution from the area "What is a Diagram" of ConceptDraw Solution Park.
Circular arrows diagram

 Health Package
Health Package is a set of multifaceted solutions intended for visualization and illustration in a field of medicine and health, for drawing colorful, interesting and precise illustrations and infographics that will be used successfully in medical documents, articles, special magazines, posters, billboards, websites, presentations, collages. Having these solutions available, it will not be difficult to illustrate the medical editions, to convey the information in a full and interesting form, to teach students with use effective visual methods, to describe the medical facts, to tell about innovations in a field of medicine, health and correct nutrition, to explain the causes and consequences of different diseases, as well as the measures of their prevention and treatment.
- Circular Diagram
- Loyalty - Arrow circle diagram | Circle Diagrams | Research cycle ...
- Research cycle - Circle diagram | Innovation life cycle - Arrow loop ...
- Research cycle - Circle diagram | Circular diagrams - Vector stencils ...
- Research cycle - Circle diagram | Export from ConceptDraw PRO ...
- Water cycle diagram | BPR Diagram. Business Process ...
- Circle Diagrams | Research cycle - Circle diagram | Circle-Spoke ...
- Target and Circular Diagrams | Research cycle - Circle diagram ...
- Research cycle - Circle diagram | Business feedback loop | Life ...
- Research cycle - Circle diagram | Workflow diagram - Template ...
- Research cycle - Circle diagram | Target and Circular Diagrams ...
- Research onion diagram | Research cycle - Circle diagram ...
- Marketing infographics - Market research | Research cycle - Circle ...
- Circle Diagrams | Circular Diagram | Target and Circular Diagrams ...
- Research cycle - Circle diagram | DroidDia PRO unlocker | Porter ...
- Circle-Spoke Diagrams | Basic Circle-Spoke Diagrams | Research ...
- Water cycle diagram | Strategic planning - Cycle diagram | Research ...
- Business feedback loop | Research cycle - Circle diagram | Life ...
- Research cycle - Circle diagram | Research onion diagram ...
- Research onion diagram | Stakeholder Onion Diagrams | Research ...