This site uses cookies. By continuing to browse the ConceptDraw site you are agreeing to our Use of Site Cookies.

segmented cycle diagram, marketing diagrams, circular arrows diagrams Circular Arrows Diagrams

segmented cycle diagram, marketing diagrams, circular arrows diagrams
Circular Arrows Diagrams solution extends ConceptDraw DIAGRAM with extensive drawing tools, predesigned samples, Circular flow diagram template for quick start, and a library of ready circular arrow vector stencils for drawing Circular Arrow Diagrams, Segmented Cycle Diagrams, and Circular Flow Diagrams. The elements in this solution help managers, analysts, business advisers, marketing experts, scientists, lecturers, and other knowledge workers in their daily work.

segmented cycle diagrams, basic circular arrows diagrams, circular flow Basic Circular Arrows Diagrams

segmented cycle diagrams, basic circular arrows diagrams, circular flow
Basic Circular Arrows Diagrams solution extends ConceptDraw DIAGRAM with predesigned samples and a library of vector stencils allowing one to create the Circular Arrows diagrams for any purpose or need. Start with one desired of ready-made vector stencils or samples, use it as a circular flow diagram template and make the Circular Arrow Diagram with the required quantity of sectors in a few minutes. Finally, customize your diagram, make stylish changes using the contrasting colors for different steps or identical for some of them, to highlight the most important steps, so designing a diagram the best fitting your taste.
This circular arrows diagram sample shows the process of emergency management involving four phases: Mitigation, Preparedness, Response, and Recovery. It was designed on the base of the webpage "Emergency Management" on the website of the Downey City Hall, California, U.S.
"The process of emergency management involves four phases: Mitigation, Preparedness, Response, and Recovery. ...
Mitigation efforts attempt to prevent hazards from developing into disasters altogether, or to reduce the effects of disasters when they occur. The mitigation phase differs from the other phases because it focuses on long-term measures for reducing or eliminating risk. ...
In the preparedness phase, emergency managers develop plans of action for when the disaster strikes. ...
The response phase includes the mobilization of the necessary emergency services and first responders in the disaster area. This is likely to include a first wave of core emergency services, such as firefighters, police and EMS crews. ...
The aim of the recovery phase is to restore the affected area to its previous state. It differs from the response phase in its focus; recovery efforts are concerned with issues and decisions that must be made after immediate needs are addressed. Recovery efforts are primarily concerned with actions that involve rebuilding destroyed property, re-employment, and the repair of other essential infrastructure."
[downeyca.org/ gov/ emergency/ default.asp]
"Disaster management (or emergency management) is the creation of plans through which communities reduce vulnerability to hazards and cope with disasters. Disaster management does not avert or eliminate the threats; instead, it focuses on creating plans to decrease the effect of disasters. Failure to create a plan could lead to human mortality, lost revenue, and damage to assets. Currently in the United States 60 percent of businesses do not have emergency management plans. Events covered by disaster management include acts of terrorism, industrial sabotage, fire, natural disasters (such as earthquakes, hurricanes, etc.), public disorder, industrial accidents, and communication failures." [Emergency management. Wikipedia]
The arrow circle diagram example "Emergency management process" was created using the ConceptDraw PRO diagramming and vector drawing software extended with the Circular Arrows Diagrams solution from the area "What is a Diagram" of ConceptDraw Solution Park.
Arrow circle diagram
Arrow circle diagram, umbrella, operator, lightning, firewall, danger, bomb, cloud, circular arrows diagram, alert, bell, alarm, siren, airport, Earth, planet,

bubble diagram, circle-spoke diagram, marketing diagrams, circular arrows diagrams, segmented cycle diagram, Venn diagram, draw logical relations Business Diagrams

bubble diagram, circle-spoke diagram, marketing diagrams, circular arrows diagrams, segmented cycle diagram, Venn diagram, draw logical relations
The Business Diagrams Solution extends ConceptDraw DIAGRAM with an extensive collection of professionally designed illustrative samples and a wide variety of vector stencils libraries, which are the real help for all business-related people, business analysts, business managers, business advisers, marketing experts, PR managers, knowledge workers, scientists, and other stakeholders allowing them to design the bright, neat, expressive and attractive Bubble Diagrams, Circle-Spoke Diagrams, Circular Arrows Diagrams, and Venn Diagrams with different quantity of sets in just minutes; and then successfully use them in documents, reports, statistical summaries, and presentations of any style.
This circular arrows diagram sample shows the exercise cycle stages: 1) Strategy plan, 2) Design and development, 3) Conduct and evaluation, 4) Improvement planning. It was designed on the base of the diagram on the Emergency Management Insitute training IS-120.b webpage from the website of the Federal Emergency Management Agency (FEMA) of the United States Department of Homeland Security.
[emilms.fema.gov/ IS120A/ summary.htm]
"Exercises give communities, states, and regions a set of essential tools to prevent, prepare for, respond to, and recover from disasters." [emilms.fema.gov/ IS120A/ module0.htm]
"Disaster management (or emergency management) is the creation of plans through which communities reduce vulnerability to hazards and cope with disasters. Disaster management does not avert or eliminate the threats; instead, it focuses on creating plans to decrease the effect of disasters. Failure to create a plan could lead to human mortality, lost revenue, and damage to assets. Currently in the United States 60 percent of businesses do not have emergency management plans. Events covered by disaster management include acts of terrorism, industrial sabotage, fire, natural disasters (such as earthquakes, hurricanes, etc.), public disorder, industrial accidents, and communication failures." [Emergency management. Wikipedia]
The diagram example "Emergency management exercise cycle" was created using the ConceptDraw PRO diagramming and vector drawing software extended with the Basic Circular Arrows Diagrams solution from the area "What is a Diagram" of ConceptDraw Solution Park.
Circular arrows diagram
Circular arrows diagram, circular arrows diagram, arrows donut chart,
This arrow ring chart sample was created on the base of the figure illustrating the webpage "National Preparedness Cycle. Plan" from the Federal Emergency Management Agency (FEMA) website. "Planning makes it possible to manage the entire life cycle of a potential crisis. Strategic and operational planning establishes priorities, identifies expected levels of performance and capability requirements, provides the standard for assessing capabilities and helps stakeholders learn their roles. The planning elements identify what an organization’s Standard Operating Procedures (SOPs) or Emergency Operations Plans (EOPs) should include for ensuring that contingencies are in place for delivering the capability during a large-scale disaster." [fema.gov/ plan]
The arrow ring chart example "National Preparedness Cycle" was created using the ConceptDraw PRO diagramming and vector drawing software extended with the Target and Circular Diagrams solution from the Marketing area of ConceptDraw Solution Park.
www.conceptdraw.com/ solution-park/ marketing-target-and-circular-diagrams
Arrow ring chart
Arrow ring chart, circular arrow diagram, circular motion diagram,

Process Flowchart

The main reason of using Process Flowchart or PFD is to show relations between major parts of the system. Process Flowcharts are used in process engineering and chemical industry where there is a requirement of depicting relationships between major components only and not include minor parts. Process Flowcharts for single unit or multiple units differ in their structure and implementation. ConceptDraw DIAGRAM is Professional business process mapping software for making Process flowcharts, Process flow diagram, Workflow diagram, flowcharts and technical illustrations for business documents and also comprehensive visio for mac application. Easier define and document basic work and data flows, financial, production and quality management processes to increase efficiency of your business with ConcepDraw DIAGRAM. Business process mapping software with Flowchart Maker ConceptDraw DIAGRAM includes extensive drawing tools, rich examples and templates, process flowchart symbols and shape libraries, smart connectors that allow you create the flowcharts of complex processes, process flow diagrams, procedures and information exchange. Process Flowchart Solution is project management workflow tools which is part ConceptDraw Project marketing project management software. Drawing charts, diagrams, and network layouts has long been the monopoly of Microsoft Visio, making Mac users to struggle when needing such visio alternative like visio for mac, it requires only to view features, make a minor edit to, or print a diagram or chart. Thankfully to MS Visio alternative like ConceptDraw DIAGRAM software, this is cross-platform charting and business process management tool, now visio alternative for making sort of visio diagram is not a problem anymore however many people still name it business process visio tools.
How To Create a Process Flow Chart (business process modelling techniques)
This wheel diagram sample illustrates the emergency preparedness training and exercise processes. It was designed on the base of the diagram on the webpage "Public Health Preparedness Training and Exercise" from the FloridaHealth website of the Florida Department of Health. [floridahealth.gov/ programs-and-services/ emergency-preparedness-and-response/ training-exercise/ ]
"Emergency Preparedness is the discipline of dealing with and avoiding both natural and manmade disasters. It involves mitigation, preparedness, response and recovery in order to lessen the impact of disasters. Emergency management requires a partnership among all levels of government (local, State, and Federal) and the private sector (business and industry, voluntary organizations, and the public). Successful preparedness requires detailed planning and cooperation among each sector." [Emergency Preparedness. Wikipedia]
The arrow donut chart example "Training and exercise process wheel" was created using the ConceptDraw PRO diagramming and vector drawing software extended with the Circular Arrows Diagrams solution from the area "What is a Diagram" of ConceptDraw Solution Park.
Circular arrows diagram
Circular arrows diagram, pencil, paper, arrows donut chart, Arc text,

Value Stream Mapping Template

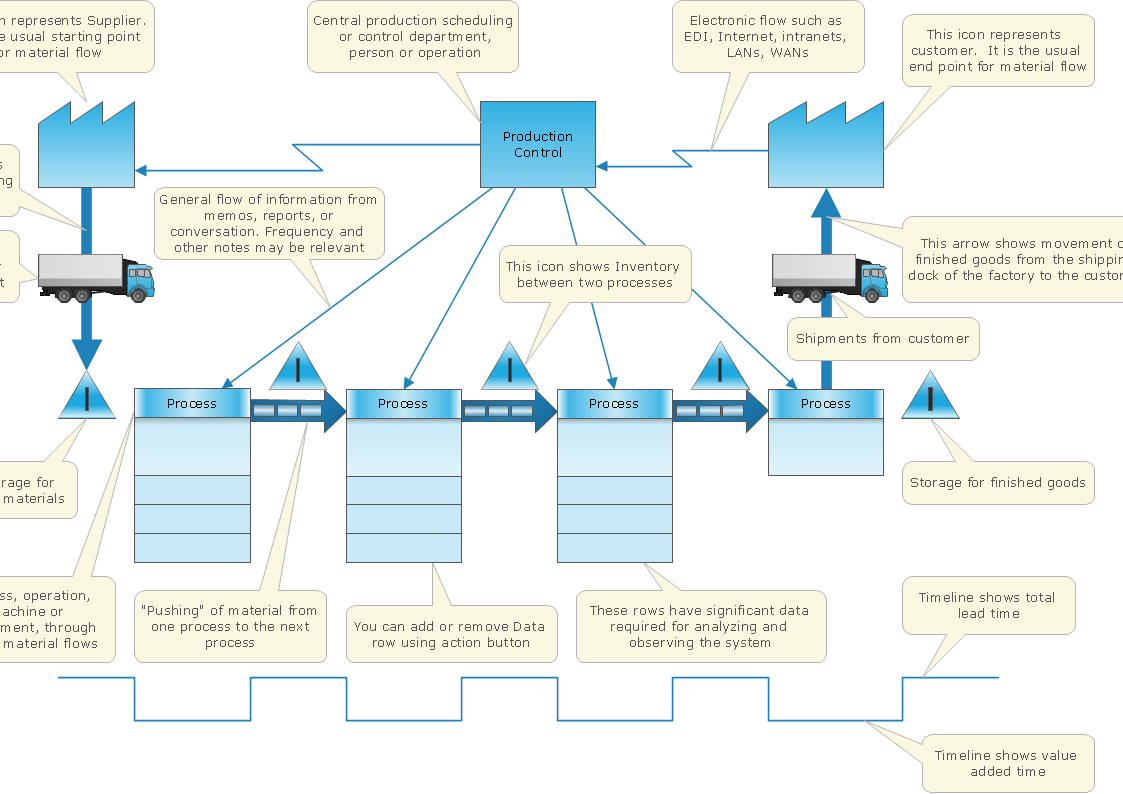
The Value Stream Map is one of the key tools of lean practitioners. It helps aptly describe the manufacturing processes both complex and simple. It supports process improvement, allows identifying waste, and reducing process cycle times. Use ConceptDraw DIAGRAM extended with Value Stream Mapping solution to document processes starting with a professionally designed Value Stream Mapping template.

cybersecurity, communications, homeland security, financial services, information technology, emergency services, energy sector Critical Infrastructure Sectors

cybersecurity, communications, homeland security, financial services, information technology, emergency services, energy sector
Critical Infrastructure Sectors solution for ConceptDraw DIAGRAM software provides a set of examples and vector stencil libraries for designing infographics and diagrams about means for the most efficient protection of critical infrastructure, energy sector, and rapid recovery in the case of disruptions. Illustrate your projects on the prevention of physical, environmental, and cyber threats, development of information technology and detection equipment. Improve your projects in communications, financial services, emergency services, homeland security, cybersecurity to solve critical issues efficiently and decrease the detrimental effects of disruptions on society and citizens. Show the results of testing new technologies and newest equipment for critical infrastructure protection and increasing resilience.

Horizontal Orgchart

The Organizational Chart is a diagram that shows the structure of the organization and the relationships of its parts. There are many ways to present the Organizational Chart. One of them is the Horizontal Organizational Chart: the parts of the diagram are arranged from left to right, or from right to left. This sample was created in ConceptDraw DIAGRAM diagramming and vector drawing software using the Organizational Charts Solution from the Management area of ConceptDraw Solution Park.

Road Transport - Design Elements

Samples, templates and libraries contain vector clip art for drawing the Road Transport Illustrations.

technical drawing, vector icons, plumbing plan, heating plan, electrical diagram, public utility icons Public Utilities

technical drawing, vector icons, plumbing plan, heating plan, electrical diagram, public utility icons
Public Utilities solution is a thematic toolset for designing infographics and diagrams about public utilities. It provides examples and premade public utility icons in vector icons libraries to develop innovative strategies for the improvement of public utility services, enhance their efficiency of delivery, and extend reliable access to services to all communities. The solution helps to public utility companies plan their activities efficiently, develop new technologies and make visual presentation, create plumbing plan, heating plan, electrical diagram, or any other technical drawing, make the overview of modern public utilities, increase utility profits, and remain the best in the market.

draw line graph, draw line chart Line Graphs

draw line graph, draw line chart
The Line Graphs solution extends the capabilities of ConceptDraw DIAGRAM with professionally designed templates, samples, and a library of vector stencils for drawing perfect Line Graphs. Turn your data into a Line Graph with ConceptDraw DIAGRAM software and use it in any document, presentation, report, share it with your team, etc. Building several curves on the same chart, it is recommended to paint them with different colors, this will allow to separate them visually from each other and will make it easier the data comparison.

climate change, waste management, esg, sustainability, diversity, supply chain, biodiversity Environmental, Social, and Corporate Governance

climate change, waste management, esg, sustainability, diversity, supply chain, biodiversity
The Environmental, Social, and Corporate Governance solution with diversity of drawing tools, libraries of pre-made vector elements, and thematic samples is the best to illustrate the key points of ESG, specify ESG criteria and ESG risks. This helps investors evaluate potential investments and avoid investment losses. Outline ESG factors and ESG standards to protect the environment, avoid climate change and biodiversity loss, illustrate principles of sustainability, waste management, supply chain management, and the importance of the use of renewable energy and renewable resources. Depict easily the policies of the companies that adhere to ESG standards.

Microsoft Azure

Microsoft Azure is widely used cloud platform which was created by Microsoft and now is managed by Microsoft datacenters in 19 regions of the world, and has a wide set of benefits and features. ConceptDraw DIAGRAM diagramming and vector drawing software extended with Azure Architecture Solution from the Computer and Networks area of ConceptDraw Solution Park is the best for designing various pictorial infographics, illustrations and materials showing the possibilities and work of Microsoft Azure Cloud System and Azure services.

rack, rack mount, rack solutions, server rack  Rack Diagrams

rack, rack mount, rack solutions, server rack
The Rack Diagrams solution can be used while working in the ConceptDraw DIAGRAM diagramming and drawing software in order to create the necessary Rack diagrams. Choosing any of the 54 vector shapes from its stencil library, you can use the Rack Diagrams solution for drawing various types of Rack diagrams or Server rack diagrams visualizing 19" rack mounted computers and servers. The Rack Diagrams solution, additionally including a collection of samples and a quick-start template, can be useful for many users of the ConceptDraw DIAGRAM who deal with computer networks, such as IT specialists; computer, network and telecommunication engineers; software engineers, technical writers, IT managers, system administrators, technical support, webmasters, system architects and engineers.

Secure Wireless Network

Use the ConceptDraw DIAGRAM diagramming and vector drawing software enhanced with powerful tools of Network Security Diagrams Solution from the Computer and Networks Area of ConceptDraw Solution Park to effectively visualize the importance of network security and wireless network security, and ways to ensure them, to easily design Network Security Diagrams and Maps, Network Security Model, Secure Wireless Network and Network Security Architecture diagrams.

Bubble diagrams in Landscape Design with ConceptDraw DIAGRAM

Bubble Diagrams are the charts with a bubble presentation of data with obligatory consideration of bubble's sizes. They are analogs of Mind Maps and find their application at many fields, and even in landscape design. At this case the bubbles are applied to illustrate the arrangement of different areas of future landscape design, such as lawns, flowerbeds, playgrounds, pools, recreation areas, etc. Bubble Diagram helps to see instantly the whole project, it is easy for design and quite informative, in most cases it reflects all needed information. Often Bubble Diagram is used as a draft for the future landscape project, on the first stage of its design, and in case of approval of chosen design concept is created advanced detailed landscape plan with specification of plants and used materials. Creation of Bubble Diagrams for landscape in ConceptDraw DIAGRAM software is an easy task thanks to the Bubble Diagrams solution from "Diagrams" area. You can use the ready scanned location plan as the base or create it easy using the special ConceptDraw libraries and templates.

The Best Drawing Program for Mac

ConceptDraw DIAGRAM is the professional business graphic software for drawing diagrams and charts with great visual appeal on Mac OS X.