Organizational Charts with ConceptDraw PRO
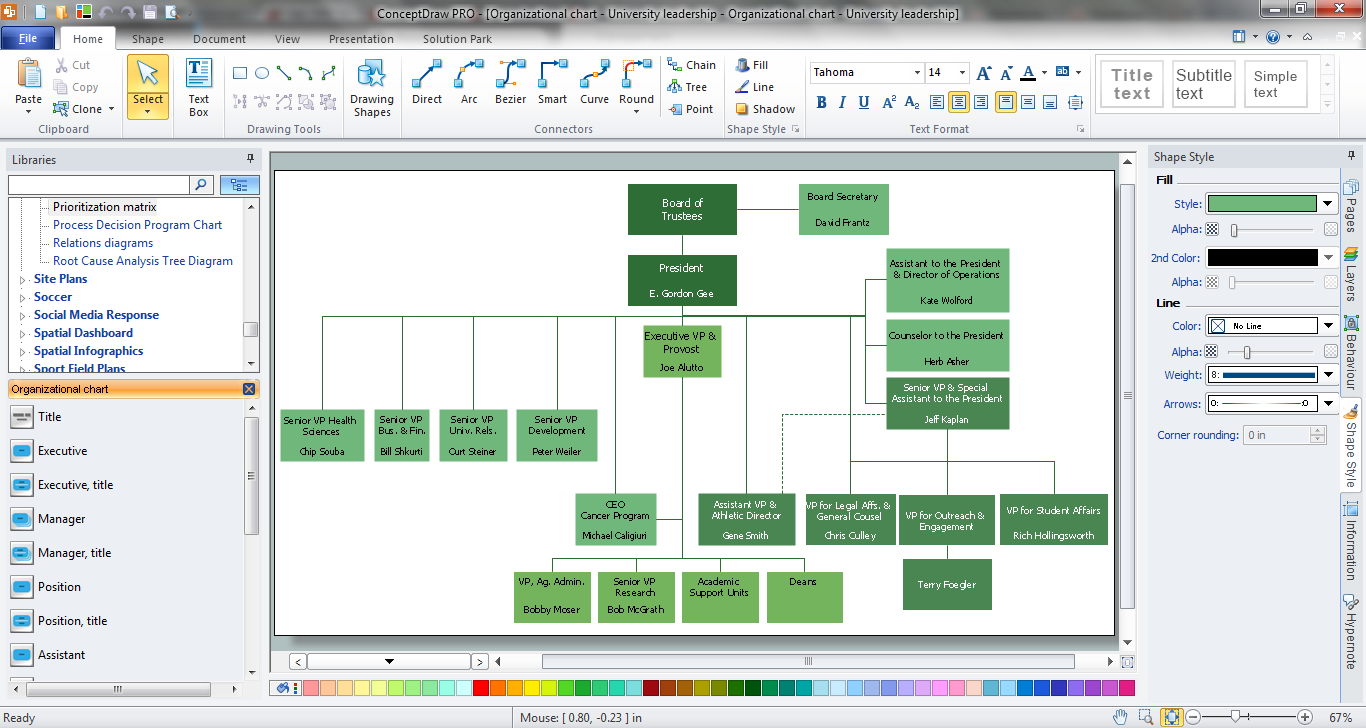
Organizational chart or Orgchart is a diagram that depicts the structure of an organization using the terms of work responsibility and rank position. It is a useful and convenient format to visually illustrate the relationships within an organization, which is moreover applicable for organization of any size. Typically, an Organizational chart is constructed from the rectangular object blocks, which represent a job title, a person's name and relationships associated with them. You looks for the powerful Orgchart software? ConceptDraw PRO software is exactly what you've been searching long. Extended with Organizational Charts Solution, ConceptDraw PRO offers great-looking examples and samples of Orgcharts, built-in templates and various types of predesigned vector block objects and connectors for creation all kinds of Organizational Charts - from simple to complex multi-page. When designing the chart for large organization with complex branched structure, may be convenient to divide it into few smaller charts.
 25 Typical Orgcharts
The 25 Typical Orgcharts solution contains powerful organizational structure and organizational management drawing tools, a variety of professionally designed organization chart and matrix organization structure samples, 25 templates based on various orga
 Organizational Charts
Organizational Charts solution extends ConceptDraw PRO software with samples, templates and library of vector stencils for drawing the org charts.
Flow chart Example. Warehouse Flowchart
Warehouse Flowcharts are various diagrams that describe the warehousing and inventory management processes on the warehouses. Typical purposes of Warehouse Flowcharts are evaluating warehouse performance, measuring efficiency of customer service and organizational performance. This type of Workflow diagrams can be used for identifying any disconnection between business activities and business objectives. They are effectively used by warehouse-related people and organizations, manufacturers, wholesalers, exporters, importers, transporters, and others. Standard Warehousing process flow diagram and standard Workflow diagram are used for process identification for further evaluating effectiveness and profitability of overall business process. Use the ConceptDraw PRO vector graphic software extended with Flowcharts solution to design your own professional-looking Workflow diagrams and Flowcharts of any types, including the Warehouse flowchart, Process flow diagrams which depict in details all steps of Warehouse packages flow. Microsoft Visio, designed for Windows users, can’t be opened directly on Mac. But fortunately, there are several Visio alternatives for Mac which will help Mac users to work Visio files. With ConceptDraw PRO, you may open, edit and save files in Visio format.
Functional Organizational Structure
A functional organizational structure is a structure that consists of activities such as coordination, supervision and task allocation. You want to draw a functional organizational structure and look for the helpful software for this? Pay attention for the ConceptDraw PRO software! Extended with Organizational Charts Solution from the Management Area, it is ideal for functional organizational structure development.How To Make a Bubble Chart
Bubble diagrams solution extends ConceptDraw PRO software with templates, Using ConceptDraw Connectors, you can make a bubble chart in moments. Using ConceptDraw you will be able to make a bubble chart from the ready ConceptDraw library objects or make your own objects. The created diagram can represent ideas organization, in brainstorming processes, by teachers for explaining difficult ideas or for presentations.Basic Flowchart Symbols and Meaning
Flowcharts are the best for visually representation the business processes and the flow of a custom-order process through various departments within an organization. ConceptDraw PRO diagramming and vector drawing software extended with Flowcharts solution offers the full set of predesigned basic flowchart symbols which are gathered at two libraries: Flowchart and Flowcharts Rapid Draw. Among them are: process, terminator, decision, data, document, display, manual loop, and many other specific symbols. The meaning for each symbol offered by ConceptDraw gives the presentation about their proposed use in professional Flowcharts for business and technical processes, software algorithms, well-developed structures of web sites, Workflow diagrams, Process flow diagram and correlation in developing on-line instructional projects or business process system. Use of ready flow chart symbols in diagrams is incredibly useful - you need simply drag desired from the libraries to your document and arrange them in required order. There are a few serious alternatives to Visio for Mac, one of them is ConceptDraw PRO. It is one of the main contender with the most similar features and capabilities.
Simple Drawing Applications for Mac
ConceptDraw gives the ability to draw simple diagrams like flowcharts, block diagrams, bar charts, histograms, pie charts, divided bar diagrams, line graphs, area charts, scatter plots, circular arrows diagrams, Venn diagrams, bubble diagrams, concept maps, and others.
 Management Area
The solutions from Management area of ConceptDraw Solution Park collect templates, samples and libraries of vector stencils for drawing the management diagrams and mind maps.
Human Resource Development
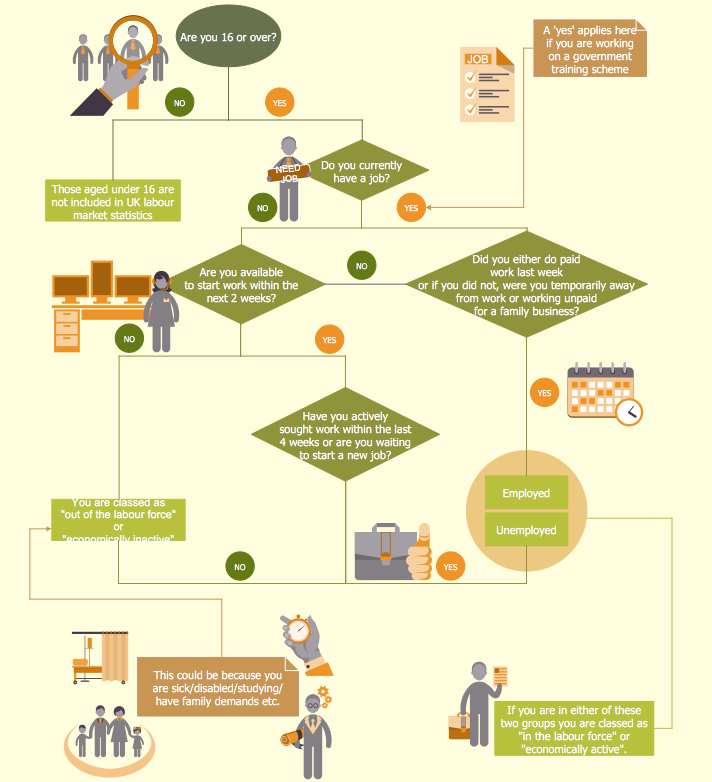
Human Resource Development (HRD) focuses on the help employees develop their personal and organizational skills, abilities, and knowledge, HRD also helps to adapt an organization to the changing of external environment. ConceptDraw PRO diagramming and vector drawing software supplied with HR Flowcharts Solution from the Management Area of ConceptDraw Solution Park can effectively help in labour-intensive process of human resource development.This ring chart sample was redesigned from the Wikipedia file: Virtuous circle in management.svg.
"An example of the use of a virtuous circle in management."
[en.wikipedia.org/ wiki/ File:Virtuous_ circle_ in_ management.svg]
"A virtuous circle and a vicious circle (also referred to as virtuous cycle and vicious cycle) are economic terms. They refer to a complex chain of events that reinforces itself through a feedback loop. A virtuous circle has favorable results, while a vicious circle has detrimental results.
Both circles are complexes of events with no tendency towards equilibrium (at least in the short run). Both systems of events have feedback loops in which each iteration of the cycle reinforces the previous one (positive feedback). These cycles will continue in the direction of their momentum until an external factor intervenes and breaks the cycle. The prefix "hyper-" is sometimes used to describe these cycles if they are extreme. The best-known example of a vicious circle is hyperinflation. ...
Example in management.
Virtuous circle.
An employer's investment in his employees’ ability to provide superior service to customers can be seen as a virtuous circle. Effort spent in selecting and training employees and creating a corporate culture in which they are empowered can lead to increased employee satisfaction and employee competence. This can result in superior service delivery and customer satisfaction. This in turn will create customer loyalty, improved sales levels, and higher profit margins. Some of these profits can be reinvested in employee development, thereby initiating another iteration of a virtuous cycle." [en.wikipedia.org/ wiki/ Virtuous_ circle_ and_ vicious_ circle]
The ring chart example "Virtuous circle (management)" was created using the ConceptDraw PRO diagramming and vector drawing software extended with the Target and Circular Diagrams solution from the Marketing area of ConceptDraw Solution Park.
www.conceptdraw.com/ solution-park/ marketing-target-and-circular-diagrams
 ConceptDraw Solution Park
ConceptDraw Solution Park collects graphic extensions, examples and learning materials
HelpDesk
How to Create a HR Process Flowchart
One of the useful tools of each HR specialist is a HR Process Flowchart. HR Flowchart renders step-by-step the process of Human Resource management in any organization. HR flowchart shows the flow of all HR processes, identifies and standardizes the list of mandatory documents required for the implementation of all HR procedures, including the recruiting process. Usually, the descriptions of entire HR processes in a company requires a big set of graphic documents. They must be regularly redrawn to maintain up to date. The best tool for this is ConceptDraw PRO - the best software to create process flow diagrams of various types. In conjunction with ConceptDraw HR flowchart solution, it delivers comprehensive tool-set for human resource management.Human Resource Management
ConceptDraw PRO diagramming and vector drawing software enhanced with powerful HR Flowcharts Solution from the Management Area of ConceptDraw Solution Park perfectly suits for Human Resource Management.HelpDesk
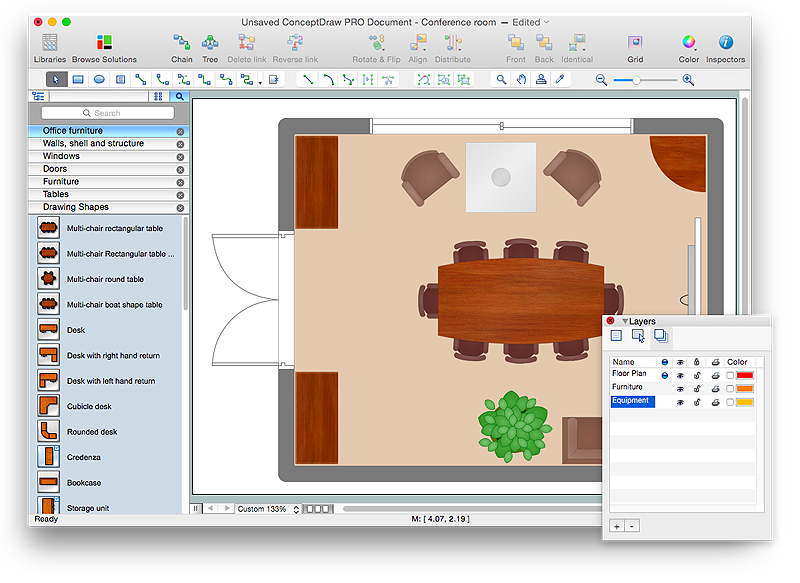
How to Draw a Floor Plan for Your Office
Designing the right office space is is an essential factor of business productivity. An office floor plan should reflect the needs of both employees and customers. ConceptDraw PRO allows you to draw the Floor Plan for your office using a special office equipment library as well as set of?special objects that?displays the?sizes, corners, squares and other floor plan details.HelpDesk
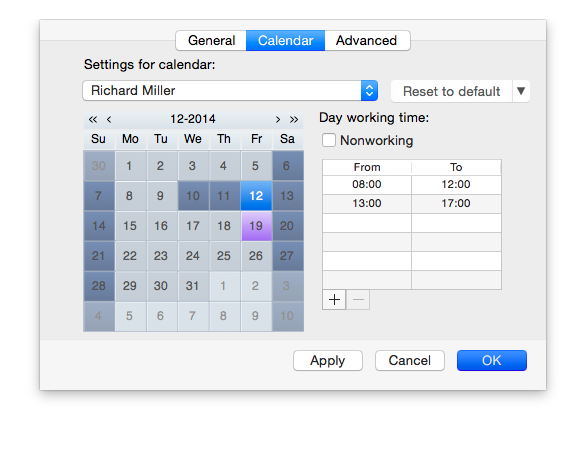
How to Create an Individual Resource Calendar
ConceptDraw PROJECT allows you to modify common working hour schedules individually for each employee.HelpDesk
How to Work with Multiple Licenses in a Cross - Platform Environment
ConceptDraw multiuser license be used for installation on both Mac OS X and Window.HelpDesk
How to Draw a Process Flow Diagram in ConceptDraw PRO
Process Flow diagrams are used in chemical and process engineering to show the flow of chemicals and the equipment involved in the process. When it comes to creating a process flow diagram, it's important to use software that is capable of describing a wide range of processes, using techniques and graphical notation that are easily recognized by engineering workers. An ideal drawing platform will utilize functions that can cope with the output of a high volume of engineering processes, that may change rapidly from development to implementation stages. ConceptDraw PRO, with the extended functionality of the Chemical and Process Engineering Diagrams solution, is the ideal medium for creating designs of this type. The Chemical and Process Engineering Diagrams solution complements this feature with a library of selected icons to represent various steps — all instantly recognizable and applicable to a wide user base. ConceptDraw PRO allows you to draw the Process Flow diagram easily using the set of special libraries.- Business Diagram Software | Org chart - University | Business ...
- How to Draw an Organization Chart | Organizational Structure ...
- Sales Process Flowchart. Flowchart Examples | Marketing and Sales ...
- How to Draw a Bubble Chart | ConceptDraw PRO - Organizational ...
- What is Gantt Chart (historical reference) | Organizational Chart ...
- How to Draw a Bubble Chart | ConceptDraw PRO - Organizational ...
- How To Make a Bubble Chart | How To Create a Bubble Chart ...
- How To Make a Bubble Chart | How to Draw a Bubble Chart ...
- Bubble diagram - Employee needs | Simple Drawing Applications ...
- Pyramid Chart Examples | Cross-Functional Process Map Template ...
- PM Teams | How To Create a Flow Chart in ConceptDraw | Types of ...
- How To Make a Bubble Chart | Cross-Functional Flowchart ...
- Pie Chart Examples and Templates | Bar Diagrams for Problem ...
- Status Dashboard | Projects HR dashboard | Gantt chart examples ...
- Organizational Structure | How to Draw an Organization Chart ...
- Weekly to-do chore chart checklist template | How To Make a Bubble ...
- Process Flowchart | Flowchart - HR management process | Business ...
- Bubble diagram - Employer objectives | How to Create a Bubble ...
- UML Collaboration Diagram Example Illustration | Trouble ticket ...




---ring-chart.png--diagram-flowchart-example.png)
