This site uses cookies. By continuing to browse the ConceptDraw site you are agreeing to our Use of Site Cookies.

Employment Form Software

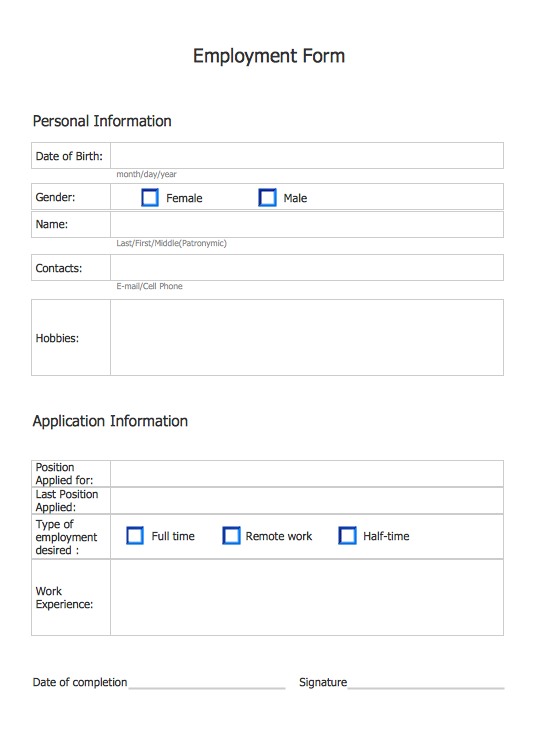
Basic Diagramming Solution contains a wide set of the ready-to-use vector stencils and professional predesigned employment forms and diagrams. These employment forms will help you in the process of management, recruiting and hiring the employees. It's very easy and convenient to use the employment form templates from the Basic Diagramming Solution for ConceptDraw DIAGRAM as the base for creating your own employment forms.
This HR flowchart example was redesigned from the Wikimedia Commons files: File:(5) 2008-07-07 Recruitment pg1.jpg (1st page), File:(5) 2008-07-07 Recruitment pg2.jpg (2nd page).
[commons.wikimedia.org/ wiki/ File:(5)_ 2008-07-07_ Recruitment_ pg1.jpg, commons.wikimedia.org/ wiki/ File:(5)_ 2008-07-07_ Recruitment_ pg2.jpg]
"ROLE OF THE POST EMPLOYMENT COMMITTEE (PEC).
The Post Employment Committee (PEC) ensures the proper application of the US Citizen EFM and US Veterans Hiring Preference is applied." [icass.gov/ home/ Documents/ HR-OE%20 Interagency%20 Docs/ Local%20 Employment%20 Recruitment%20 Policy.pdf]
The cross-functional flowchart example "Post Employment Committee recruitment flowchart" was created using the ConceptDraw PRO diagramming and vector drawing software extended with the HR Flowcharts solution from the Management area of ConceptDraw Solution Park.
Cross-functional flowchart - part 1
Cross-functional flowchart - part 1, terminal point, survey, succession management, subroutine, predefined process, skill, schedule, calendar, run, recruitment, hiring, quality assurance, process step, person specification, off-page reference, meeting, mail room, job performance, job descriptions, interview, job interview, human resource, document, disciplinary procedures, decision indicator, yes, decision indicator, no, decision, checkbox, businessman, profession icon, blog, bank, analyze, accounting,
Cross-functional flowchart - part 2
Cross-functional flowchart - part 2, terminal point, synchronization, sync, survey, subroutine, predefined process, select staff, security, run, resume, receive, process step, problem solving, personnel, staff, employees, off-page reference, negotiation, job pricing, job offer, human resource, health plan, employee onboarding, organizational socialization, direct access storage, decision indicator, yes, decision indicator, no, decision, business conference,

ConceptDraw Arrows10 Technology

When you are connecting existing objects you can control the diagram structure by changing selection order. This is how diagramming software should work. You are able to draw a diagram as quickly as the ideas come to you.

Basic Diagramming

Perfect charts and graphics diagramming software with rich examples and template. ConceptDraw is ideal to draw Charts and Graphics.

software engineering, data model, data modeling tools, orm Object-Role Modeling (ORM) Diagrams

software engineering, data model, data modeling tools, orm
Object-role Modeling (ORM) Diagram solution with powerful vector diagramming and data modeling tools, large quantity of specially developed samples and examples, and rich variety of vector objects corresponding to common ORM notation, ideally suits for developing the comprehensive, clear and visual Object-role Modeling (ORM) diagrams and schematics, understandable for all interested people from the different fields and business directions, for designing the ORM models, and demonstrating advantages from the use of ORM and its notation. It is intended for software developers and computer engineers, specialists in a field of Object-oriented programming (OOP), database architects, web-application constructors and developers, etc.

HR Hierarchy Chart

Visual hierarchy helps to identify who reports to whom in seconds. Design the HR hierarchy for your company without any effort, show visually the structure of roles and authorities in the HR department at all levels. Evaluate efficiently your HR department structure, construct a recruitment model, make improvements, identify critical issues, fill gaps in HR department structure fast and easily with ConceptDraw DIAGRAM charting and vector drawing software and HR Flowcharts solution. HR Flowcharts Solution libraries with vector design objects, pictograms, and clipart make the drawing process easy and comfortable for everyone.

Human Resource Management

ConceptDraw DIAGRAM diagramming and vector drawing software enhanced with powerful HR Flowcharts Solution from the Management Area of ConceptDraw Solution Park perfectly suits for Human Resource Management.

Human Resources

Human resources is the set of individuals who make up the workforce of an organization, business sector, or economy. ConceptDraw DIAGRAM diagramming and vector drawing software extended with unique HR Flowcharts Solution from the Management Area of ConceptDraw Solution Park is the best for designing various flowcharts and diagrams in the field of human resources management.

Hiring Process

Hiring process is a set of actions taken by an organization for attracting, selecting and appointing suitable candidates for jobs. The steps of the hiring process can vary and include unique elements according to the company's specificity. However, there are some common basic steps. ConceptDraw DIAGRAM diagramming and vector drawing software aspires to help its users in the hiring process and offers a powerful HR Flowcharts Solution from the Management Area of ConceptDraw Solution Park. Illustrate the most common steps in the hiring process fast and easily in ConceptDraw DIAGRAM.

human resources, human resource management, recruitment, hiring process, human resource development HR Flowcharts

human resources, human resource management, recruitment, hiring process, human resource development
The HR Flowcharts solution is ideal for using while creating the HR-related drawings in the ConceptDraw DIAGRAM charting and drawing software, providing with a comprehensive collection of human resources themed icons, connectors, and images from the available stencil libraries, helping illustrating flowcharts, infographics and workflow diagrams.

Examples of Flowcharts, Org Charts and More

ConceptDraw DIAGRAM covers a broad spectrum of business graphics categories and offers at ConceptDraw STORE enormous online collection of pictorial examples and samples for different thematics and application areas. It is a plentiful source of inspiration and wonderful examples of professionally designed diagrams, flowcharts, UML diagrams, organizational charts, databases, ERDs, network diagrams, business charts, different thematic charts, schematics, infographics and plans developed specially for knowledge workers, engineers, managers, businessmen, marketing specialists, analytics, scientists, students, professors, journalists and also for a large number of other people that every day use various diagrams and drawings in their work and life activity. Each of these examples is a real art, all they are well thought-out and designed without efforts with help of powerful tools of ConceptDraw DIAGRAM software. ConceptDraw examples display all variety of tasks, possibilities and results that ConceptDraw Product Line lets achieve fast and easy. ConceptDraw is one of the best Visio alternatives for Mac. It open all Visio formats like.vsdx,.vss,.vdx files and allows you to export files to Visio formats.
What is ConceptDraw OFFICE

human resources, human resource management, Recruitment, hiring process, human resource development HR Dashboard

human resources, human resource management, Recruitment, hiring process, human resource development
The HR Dashboard solution extends ConceptDraw DIAGRAM functionality with powerful drawing tools and great collection of comprehensive vector design elements, icons, pictograms and objects, navigation elements, live objects of HR charts, HR indicators, and thematic maps. The range of HR Dashboards applications is extensive, among them the human resource management, recruitment, hiring process, human resource development. ConceptDraw DIAGRAM software is perfect for creation HR Dashboard with any goal you need. It gives you all opportunities for designing not only informative, but also professional looking and attractive HR Dashboards of any style and degree of detalization, that are perfect for using in presentations, reports and other thematic documents.

bubble diagram, circle-spoke diagram, marketing diagrams, circular arrows diagrams, segmented cycle diagram, Venn diagram, draw logical relations Business Diagrams

bubble diagram, circle-spoke diagram, marketing diagrams, circular arrows diagrams, segmented cycle diagram, Venn diagram, draw logical relations
The Business Diagrams Solution extends ConceptDraw DIAGRAM with an extensive collection of professionally designed illustrative samples and a wide variety of vector stencils libraries, which are the real help for all business-related people, business analysts, business managers, business advisers, marketing experts, PR managers, knowledge workers, scientists, and other stakeholders allowing them to design the bright, neat, expressive and attractive Bubble Diagrams, Circle-Spoke Diagrams, Circular Arrows Diagrams, and Venn Diagrams with different quantity of sets in just minutes; and then successfully use them in documents, reports, statistical summaries, and presentations of any style.

Best Diagramming Software for macOS

ConceptDraw DIAGRAM creates drawings, flowcharts, block diagrams, bar charts, histograms, pie charts, divided bar diagrams, line graphs, area charts, scatter plots, circular arrows diagrams, Venn diagrams, bubble diagrams with great visual appeal on Mac OS X.
How to Draw a Bubble Chart

Organization Chart

ConceptDraw DIAGRAM diagramming and vector drawing software extended with 25 Typical Orgcharts solution from the Management area of ConceptDraw Solution Park offers 25 ready Organization Chart templates, 10 samples and 2 libraries with predesigned vector objects.
This BPMN diagram sample shows the recruitment (hiring) process workflow.
"Recruitment refers to the process of attracting, screening, selecting, and onboarding a qualified person for a job. At the strategic level it may involve the development of an employer brand which includes an "employee offering".
The stages of the recruitment process include: job analysis and developing some person specification; the sourcing of candidates by networking, advertising, and other search methods; matching candidates to job requirements and screening individuals using testing (skills or personality assessment); assessment of candidates' motivations and their fit with organizational requirements by interviewing and other assessment techniques. The recruitment process also includes the making and finalizing of job offers and the induction and onboarding of new employees.
Depending on the size and culture of the organization, recruitment may be undertaken in-house by managers, human resource generalists and/ or recruitment specialists. Alternatively, parts of the process may be undertaken by either public-sector employment agencies, commercial recruitment agencies, or specialist search consultancies." [Recruitment. Wikipedia]
The BPMN (Business Process Model and Notation) diagram example "Hiring process BPMN 1.2 diagram" was created using the ConceptDraw PRO diagramming and vector drawing software extended with the Business Process Diagram solution from the Business Processes area of ConceptDraw Solution Park.
Employee recruitment workflow
Employee recruitment workflow, task, start, intermediate message, horizontal lane, lane, group, exclusive, XOR, data-based, end, data object, collapsed sub-process,

Donut Chart Templates

These donut chart templates was designed using ConceptDraw DIAGRAM diagramming and vector drawing software extended with Pie Charts solution from Graphs and Charts area of ConceptDraw Solution Park. All these donut chart templates are included in the Pie Charts solution. You can quickly rework these examples into your own charts by simply changing displayed data, title and legend texts.

Active Directory Diagram

Active Directory (AD) is a directory management service introduced by Microsoft Corporation for Windows domain networks. This service uses the Lightweight Directory Access Protocol (LDAP) and provides quick access to the included information about large structural units such as domains, organizational units, sites, and also about simple objects, such as users names with detailed information about them - contacts information, access rights, etc. Active Directory Diagram is a representation of the network structure in clear graphical format. It is a scheme of correlations of service components with preset degree of detailed elaboration. Active Directory Diagram makes the work of network administrators with Active Directory network structure more easy and convenient, allows plan and service the network quicker and more qualitatively. The help of ConceptDraw DIAGRAM software extended with Active Directory Diagrams solution from the Computer and Networks area is indispensable for easily and quickly creation the highly detailed Active Directory Diagrams.
This financila dashboard example was drawn on the base of the Enterprise dashboard from the Mecklenburg County Government website.
[charmeck.org/ mecklenburg/ county/ CountyManagersOffice/ OMB/ dashboards/ Pages/ Enterprise.aspx]
"In management information systems, a dashboard is "an easy to read, often single page, real-time user interface, showing a graphical presentation of the current status (snapshot) and historical trends of an organization’s key performance indicators to enable instantaneous and informed decisions to be made at a glance."
For example, a manufacturing dashboard may show key performance indicators related to productivity such as number of parts manufactured, or number of failed quality inspections per hour. Similarly, a human resources dashboard may show KPIs related to staff recruitment, retention and composition, for example number of open positions, or average days or cost per recruitment.
Types of dashboards.
Dashboard of Sustainability screen shot illustrating example dashboard layout.
Digital dashboards may be laid out to track the flows inherent in the business processes that they monitor. Graphically, users may see the high-level processes and then drill down into low level data. This level of detail is often buried deep within the corporate enterprise and otherwise unavailable to the senior executives.
Three main types of digital dashboard dominate the market today: stand alone software applications, web-browser based applications, and desktop applications also known as desktop widgets. The last are driven by a widget engine.
Specialized dashboards may track all corporate functions. Examples include human resources, recruiting, sales, operations, security, information technology, project management, customer relationship management and many more departmental dashboards.
Digital dashboard projects involve business units as the driver and the information technology department as the enabler. The success of digital dashboard projects often depends on the metrics that were chosen for monitoring. Key performance indicators, balanced scorecards, and sales performance figures are some of the content appropriate on business dashboards." [Dashboard (management information systems). Wikipedia]
The example "Enterprise dashboard" was created using the ConceptDraw PRO diagramming and vector drawing software extended with the Composition Dashboard solution from the area "What is a Dashboard" of ConceptDraw Solution Park.
Financial dashboard
Financial dashboard, two columns indicator, pie chart,

Feature Comparison Chart Software

An example of marketing analysis diagram, can be used to analyse product market and define marketing strategy. This sample shows the Feature Comparison Chart of the digital scouting cameras. It can be useful for digital cameras production field, marketing, sales, etc.