 Divided Bar Diagrams
The Divided Bar Diagrams Solution extends the capabilities of ConceptDraw DIAGRAM with templates, samples, and a library of vector stencils for drawing high impact and professional Divided Bar Diagrams and Graphs, Bar Diagram Math, and Stacked Graph.
 Picture Graphs
Typically, a Picture Graph has very broad usage. They many times used successfully in marketing, management, and manufacturing. The Picture Graphs Solution extends the capabilities of ConceptDraw DIAGRAM with templates, samples, and a library of professionally developed vector stencils for designing Picture Graphs.
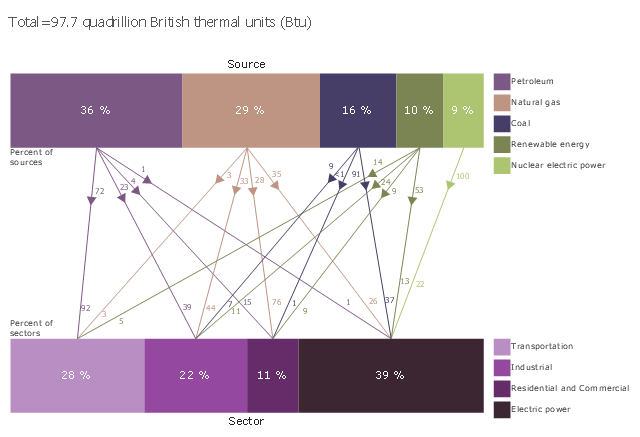
This divided bar diagram sample shows U.S. primary energy consumption by source and sector in 2015. It was designed using data from the chart in the webpage "U.S. Energy Facts Explained, Consumption & Production" on the website of the U.S. Energy Information Administration.
"Americans use many types of energy
Petroleum, natural gas, coal, renewable energy, and nuclear electric power are primary sources of energy. Electricity is a secondary energy source that is generated from primary sources of energy.
Energy sources are measured in different physical units: liquid fuels in barrels or gallons, natural gas in cubic feet, coal in short tons, and electricity in kilowatts and kilowatthours. In the United States, British thermal units (Btu), a measure of heat energy, is commonly used for comparing different types of energy to each other. In 2015, total U.S. primary energy consumption was about 97.7 quadrillion (1015, or one thousand trillion) Btu."
[eia.gov/ energyexplained/ index.cfm?page=us_ energy_ home]
The chart example "U.S. primary energy consumption by source and sector" was created using the ConceptDraw PRO diagramming and vector drawing software extended with the Divided Bar Diagrams solution from the Graphs and Charts area of ConceptDraw Solution Park.
Divided bar chart
The Best Drawing Program for Mac

Competitor Analysis

Chart Templates

Chart Examples

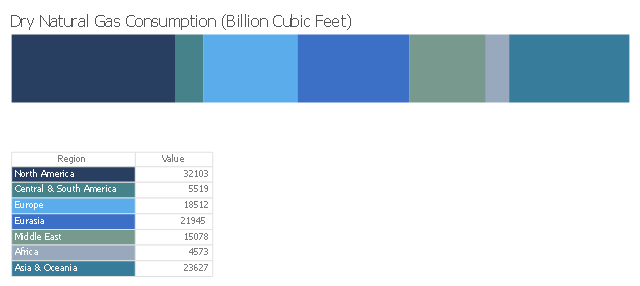
This divided bar diagram sample shows the global natural gas consumption by regions in 2013. It was designed using data of the International Energy Statistics webpage from the U.S. Energy Information Administration (EIA) website. [eia.gov/ cfapps/ ipdbproject/ IEDIndex3.cfm?tid=3&pid=26&aid=2]
"Natural gas is a fossil fuel formed when layers of buried plants and animals are exposed to intense heat and pressure over thousands of years. The energy that the plants originally obtained from the sun is stored in the form of chemical bonds in natural gas. Natural gas is a nonrenewable resource because it cannot be replenished on a human time frame. Natural gas is a hydrocarbon gas mixture consisting primarily of methane, but commonly includes varying amounts of other higher alkanes and even a lesser percentage of carbon dioxide, nitrogen, and hydrogen sulfide. Natural gas is an energy source often used for heating, cooking, and electricity generation. It is also used as fuel for vehicles and as a chemical feedstock in the manufacture of plastics and other commercially important organic chemicals." [Natural gas. Wikipedia]
The chart example "Global natural gas consumption" was created using ConceptDraw PRO diagramming and vector drawing software extended with the Divided Bar Diagrams solution from the Graphs and Charts area of ConceptDraw Solution Park.
Divided bar chart
This divided bar chart sample shows the petroleum products yielded from 1 barrel of crude oil in California in 2004. It was drawn using data from the chart on the California Energy Almanac website. [energyalmanac.ca.gov/ gasoline/ whats_ in_ barrel_ oil.html]
"Petroleum products are useful materials derived from crude oil (petroleum) as it is processed in oil refineries. Unlike petrochemicals, which are a collection of well-defined usually pure chemical compounds, petroleum products are complex mixtures. The majority of petroleum is converted to petroleum products, which includes several classes of fuels.
According to the composition of the crude oil and depending on the demands of the market, refineries can produce different shares of petroleum products. The largest share of oil products is used as "energy carriers", i.e. various grades of fuel oil and gasoline. These fuels include or can be blended to give gasoline, jet fuel, diesel fuel, heating oil, and heavier fuel oils. Heavier (less volatile) fractions can also be used to produce asphalt, tar, paraffin wax, lubricating and other heavy oils. Refineries also produce other chemicals, some of which are used in chemical processes to produce plastics and other useful materials. Since petroleum often contains a few percent sulfur-containing molecules, elemental sulfur is also often produced as a petroleum product. Carbon, in the form of petroleum coke, and hydrogen may also be produced as petroleum products. The hydrogen produced is often used as an intermediate product for other oil refinery processes such as hydrocracking and hydrodesulfurization." [Petroleum product. Wikipedia]
The chart example "Petroleum products yielded from one barrel of crude oil" was created using the ConceptDraw PRO diagramming and vector drawing software extended with the Divided Bar Diagrams solution from the Graphs and Charts area of ConceptDraw Solution Park.
Divided bar chart

 Data Flow Diagrams (DFD)
Data Flow Diagrams solution extends ConceptDraw DIAGRAM software with templates, samples and libraries of vector stencils for drawing the data flow diagrams (DFD).
- Divided Bar Diagrams | Bar Graph On Consuption Of Natural ...
- Energy resources diagram | Divided Bar Diagrams | Pie Charts ...
- Bar Graph In Renewable Energy
- Energy resources diagram | Pie Charts | Divided Bar Diagrams ...
- Pie Charts | Divided Bar Diagrams | Manufacturing and Maintenance ...
- Energy resources diagram | Manufacturing and Maintenance ...
- Types of Flowcharts | Divided Bar Diagrams | Pie Charts | Block ...
- Manufacturing and Maintenance | Pie Charts | Divided Bar Diagrams ...
- Target and Circular Diagrams | Divided Bar Diagrams | Bubble ...