HelpDesk
How to Draw a Pyramid Diagram in ConceptDraw PRO
Pyramid diagram (triangle diagram) is used to represent data, which have hierarchy and basics. Due to the triangular form of diagram, each pyramid section has a different width. The width of the segment shows the level of its hierarchy. Typically, the top of the pyramid is the data that are more important than the base data. Pyramid scheme can be used to show proportional and hierarchical relationships between some logically related items, such as departments within an organization, or successive elements of any process. This type of diagram is often used in marketing to display hierarchical related data, but it can be used in a variety of situations. ConceptDraw PRO allows you to make a pyramid diagram, quickly and easily using special libraries.
 Pyramid Diagrams
Pyramid Diagrams solution extends ConceptDraw PRO software with templates, samples and library of vector stencils for drawing the marketing pyramid diagrams.
HelpDesk
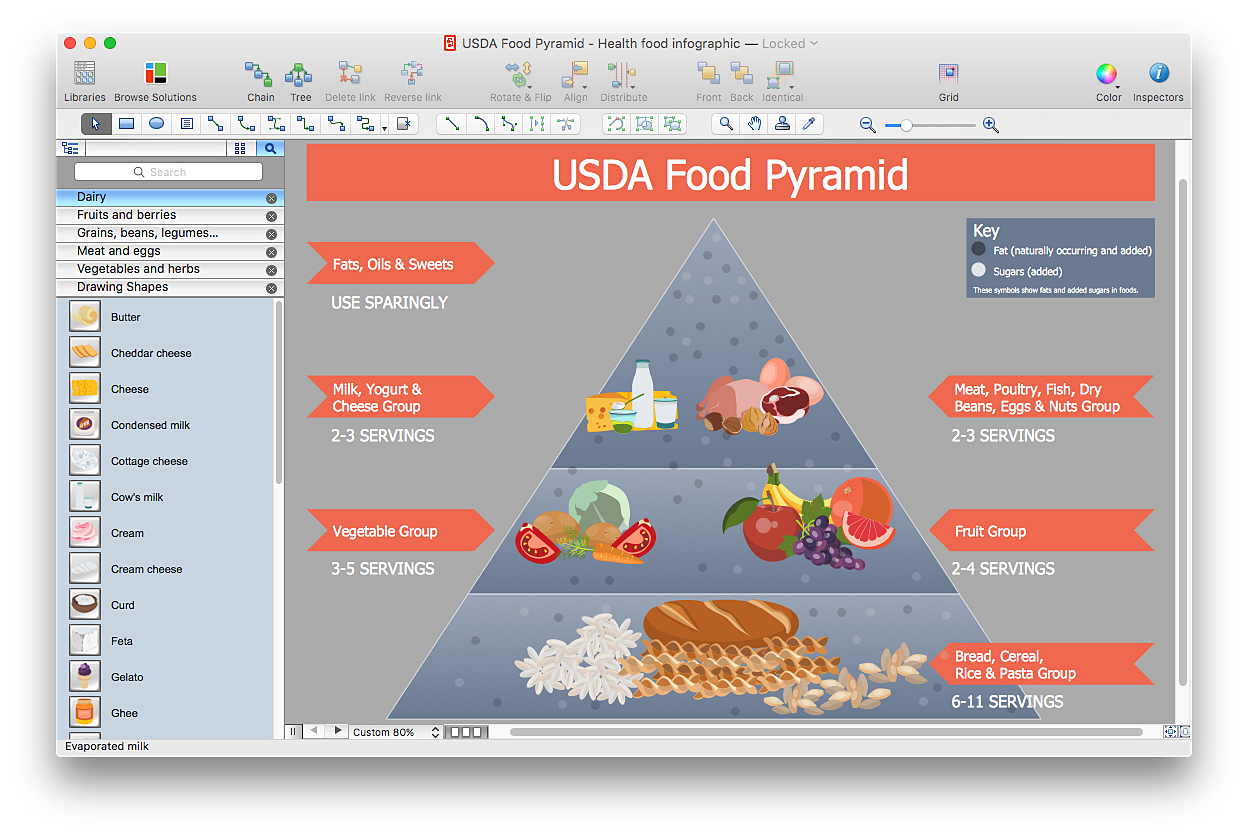
How to Create Infographics that Help People Eat Healthy
The most effective manner of presenting information on healthy diet and food nutrition is using various visualizations such as charts or infographics. To help easily create infographics and diagrams of healthy eating, ConceptDraw has provided the Health Food solution to its Solution Park. It contains vector stencil libraries of healthy eating options, samples of diagrams and infographics, and a set of templates to help you create your own diagrams, infographics and even adds. Using ConceptDraw PRO you can easily create and share healthy food recipes and materials about the proper nutrition.HelpDesk
How to Draw a Circular Arrows Diagram Using ConceptDraw PRO
The cyclic recurrence is a fundamental property of multiple systems. The cycle is a process which consists from elements (phases, stages, stages) following each other. Many processes in astronomy, biology, chemistry, physics, mathematics, etc. have a cycle properties. It is also widely used in information technologies and marketing analysis. Graphical representation of cyclic processes can have many forms. It can be a circle, parabola, hyperbola, ellipse and others. A Circular Arrows Diagram is used as one of the statistical charts in the business, mass media and marketing. ConceptDraw PRO provides its users tools for making easy drawing Circular Arrows Diagrams.- Process Flowchart | Mechanical Drawing Symbols | Pyramid ...
- Wood Symbol In Engineering Drawing
- Pyramid Diagram | Pyramid Diagram | Organizational culture ...
- Energy Pyramid Diagram | Chemical Engineering | Diagram of a ...
- How to Draw a Pyramid Diagram in ConceptDraw PRO | CAD ...
- Mechanical Drawing Symbols | Mechanical Engineering | Process ...
- What Is A Pyramid In Relationship To Technical Drawing
- How to Draw a Pyramid Diagram in ConceptDraw PRO | Basic ...
- Pro Engineering 3d Model Diagram
- Fundraising Pyramid | Pyramid Chart Examples | How to Create a ...
- Process Flowchart | Mechanical Engineering | Mechanical Drawing ...
- Technical drawing - Machine parts assembling | Process Flowchart ...
- Mechanical Engineering | How to Create a Mechanical Diagram ...
- 4 Level pyramid model diagram - Information systems types | 5 Level ...
- Pyramid Diagram | Definition
- Mechanical Diagram Symbols Pdf
- Process Flowchart | Pyramid Diagram | The Best Tool for Business ...
- Mechanical Drawing Symbols | Process Flowchart | Mechanical ...
- Different Joining Process In Engineering Drawing
- Pyramid Chart Maker | ConceptDraw Solution Park | Computer ...


